ii
Can Machine Learning contribute to a Paradigm
Shift in Health?
Ricardo Miguel de Sousa Coelho da Silva
A News Article Listener for continuous identification
of Patient Innovations
Dissertation presented as partial requirement for obtaining
the Master’s degree in Information Management
2 NOVA Information Management School Instituto Superior de Estatística e Gestão de Informação Universidade Nova de Lisboa
CAN MACHINE LEARNING CONTRIBUTE TO A PARADIGM SHIFT IN
HEALTH CARE?
A NEWS ARTICLE LISTENER FOR CONTINUOUS IDENTIFICATION OF
PATIENT INNOVATIONS
by Ricardo Miguel de Sousa Coelho da SilvaDissertation presented as partial requirement for obtaining the Master’s degree in Information Management at Nova IMS, with a specialization in Knowledge Management and Business Intelligence, and the Master’s degree in Management at Nova SBE with specialization in Digital Business. Co Advisor: Leid Zejnilovic Co Advisor: Zita Marinho
3
ACKNOWLEDGEMENTS
This work would not have been possible without the availability and guidance of my advisors, Leid Zejnilonic and Zita Marinho, who have helped and taught me a lot over the last months, the result of which is found in these pages.
Furthermore, I would like to express my gratitude to my parents, who have supported me throughout all of my academic path.
A too large a list to include in this page of people have also helped me, in various ways, to finish this project. To everyone, my sincerest gratitude.
4
ABSTRACT
There is an ongoing paradigm shift in healthcare, with patients increasingly controlling their own health. Patient Innovation is an excellent example of this shift. Observation of the Patient-innovation platform, the largest repository of Patient Innovations in the world, shows most contributions are published by the platform’s staff. Online search for Patient Innovations is a resource-consuming task for very rare outcomes. A novel system to complement such human effort is proposed in the form of a “News Article Listener” to reduce large sets of news articles to a subset of articles that are likely to describe Patient Innovations. Initial tests reduced a set of 14,977 articles to a subset of 519 articles, from which an operator found 6 Patient Innovations. The importance of this result is further discussed for innovation management and health care.
KEYWORDS
5
INDEX
Section 1 – Introduction ….………. 6
Section 2 – Literature Review 2.1 – Open Innovation and User Innovation ……….7
2.2 – Lead User Definition and Method ………...8
2.3 – Patient Innovation ………9
2.4 – Lead User Identification ………. 10
Section 3 – Research context, data and methods 3.1 – Research Context ……….11 3.2. Methods 3.2.1 - Dataset Development ……….12 3.2.2 - Pre-processing ………14 3.2.3 – Model Training ………. 19 Section 4 - Results 4.1 - Training Results ………21
4.2 – Testing with Unlabelled Dataset ………... 23
Section 5 – Conclusions and Future Work ……….………. 25
References……….…… 28
6
Section 1 – Introduction
Since the concept of Open Innovation was first proposed, it has since been expanded to include the contribution of individual users and consumers as a driving force for new product development, with relevant benefits for both firms and overall social welfare, due to the ability to deal with inefficiencies producers cannot, due to their position, apprehend (Gambardella et al. 2015). One specific field where individuals have made relevant contributions is healthcare, with multiple innovations in terms of products and services coming from this source: this specific subset of User Innovators has been previously identified and described as “Patient Innovators” (Oliveira et al. 2015). Currently, efforts to catalogue the wide scope of Patient Innovations found online, done by the Patient-innovation platform, are limited in terms of scalability and labour requirements. While there have been experiments with data analysis and text classification for identification of user innovations (Tuarob and Tucker, 2015) (Karlartz and von Hippel, 2018), including one application to the specific case of Patient Innovation (Almeida, 2018), identification of patient innovators is still mostly limited to a manual task. This work project develops a novel method for Patient Innovation identification, through the development of an “Automatic News Listener”, that can contribute greatly to the effort of mapping out the complete Patient Innovation Ecosystem. The remainder of this work project is organized as follows: Section 2 provides the theoretical background for this work, by introducing concepts related to User and Patient Innovation in a form of the Literature Review. Section 3 describes the Research Context, and Methods used for data pre-processing and classification. Section 4 describes the Results obtained from the training and application of the developed classifier to an unlabeled dataset. Section 5 presents the Conclusions from the complete process, as well as potential future work to be done.
7
Section 2 - Literature Overview
2.1 - Open Innovation and User Innovation
Today, Open Innovation, the notion that new products and services do not need to come exclusively from a company’s research department, is seen as a relevant phenomenon, with it being seen today as a substitute or complement to innovation made by manufacturers (von Hippel, 2005). When looking at the distinct analysis of behaviours of user innovators around the world, the phenomenon is confirmed to be present in large proportions of the overall population in a variety of countries, with users developing new and interesting products and services (de Jong et al. 2015) (Jin et al. 2018) (von Hippel et al. 2015).
These innovators find limitations in terms of their innovations’ diffusion, due to the market failure related to the perceived value that other individuals may gain from a user-developed product, reducing the propensity of the innovator to share his/her development (de Jong et al. 2015). Moreover, these users rarely apply intellectual protection for their innovations, which also contributes to a reduced rate of diffusion of these user innovations (von Hippel et al. 2012). Motives related to the development of user innovation have been identified as both utilitarian user motives (where the motivation is the use value of their developed products) and hedonic user motives (where the motivation is the challenge and pleasure in developing the innovation), with the combination of the two shaping the nature of innovations created (Stock et al. 2015). Furthermore, user innovators generally have a great understanding of the market itself, and this knowledge is used to their advantage for the development of products according to their needs, while concurrently leveraging locally obtained information, through personal connections to other users (Lüthje et al, 2002). Finally, it has been found that users benefit from knowledge intersections when developing new solutions, through the combination of expertise in specific domains of knowledge with their information regarding a specific product (Lüthje et al, 2005). One relevant point regarding innovations done by users
8 is that it is not limited to products, as users have also been found to be able to develop innovations in the form of services (Oliveira and von Hippel, 2011). Regardless of the product or service developed, user communities have been found to be more efficient than producers in developing new innovations for specific fields, in what is referred to as "efficiency of scope", where the great number of user innovators, each applying a small level of resources, has been found to contribute to more innovations than a few innovators with more resources (Hienerth et al, 2014). Studies have also found that in some markets, even if producer-developed products are available, the products producer-developed or adapted by users represent the majority of the market (Hyysalo and Usenyuk, 2015). All of this sets user innovators as significant contributors to the overall market.
2.2 - Lead User Definition and Method
Many User Innovators correspond to a category in itself, known as Lead Users, who have been identified as having the ability to develop commercially feasible innovations (von Hippel, 1986). Because these users have specific needs, they are also the ones that have the most to gain from the innovation done (Morrison et al. 2004). Variables that influence a consumer's “Lead Userness” include high consumer knowledge and use experience, which are related to the field itself, as well as innovativeness, which is related to the personality of the user (Schreier and Prügl, 2008).
Considering the opportunities from including Lead Users in innovation processes, companies have introduced them in their own innovation processes (Schweisfurth and Raasch, 2015). The inclusion of innovation coming from users has been found to have a positive impact on Social Welfare, through the reduction of inefficiencies related to information asymmetries (Henkel and von Hippel, 2003). One approach companies have used to benefit from the efforts and tacit knowledge (the knowledge intrinsic to the individual) of Lead Users is the
9 Lead User Method, which bases innovation on the inclusion of Lead Users in processes for new product development (Lüthje and Herstatt, 2004). This method has been found to generate innovation at a higher rate than traditional tools (Al-Zu’bi and Tsinopoulos, 2012). The identification of Lead Users is, therefore, a relevant practice for product development and innovation.
2.3 - Patient Innovators
One specific subset of User Innovators that has been previously been identified and described in literature corresponds to “Patient Innovators” (Oliveira et al. 2015). These innovators can be distinguished from the ones in general User Innovation terminology, as these individuals are generally dealing with serious conditions themselves, or deal closely with patients dealing with these conditions, which can go from Alzheimer’s to lack of mobility (Canhão et al, 2016). Many of these conditions present, therefore, great obstacles to the patients, as they can range from being very difficult or expensive to treat to having no identified solution to date. As mentioned, this definition does not stop at patients: it includes caregivers, family members and acquaintances of the patient, who driven by the motivations related to personal use or altruism, create new solutions or adapt/combine existing ones, to develop new products or services that can constitute opportunities for an increase of well-being for patients (Zejnilovic and Oliveira, 2015). A previous study on patients with rare diseases and caregivers shows that a significant percentage of patients develop their own solutions to aid in dealing with diseases (Oliveira et al. 2015). Therefore, there are opportunities to be found in extending the knowledge scope beyond the typical knowledge networks of clinicians and medical practitioners. In fact, there have been several interesting applications of technologies and products that do not have their origin in medical R&D and that have since produced a positive impact on health care (Harris et al, 2018).
10 Patient Innovation, in a Do-it-Yourself philosophy, has become more frequent in recent years, with the development of communication technology, as well as of online communities providing patients with new avenues to share their own experiences in terms of healthcare (Zejnilovic et al, 2016). Similar to the innovations from other Lead Users and User Innovators, because of their nature, these innovations usually have very limited diffusion (Zejnilovic et al, 2016). Hence, considering the positive impacts in terms of welfare the diffusion of these innovations can have, the development of methods for efficient identification of Patient Innovators is a relevant pursuit.
2.4 - Lead User Identification
Considering the value of Lead Users, processes for Lead User identification have been built as an alternative to mass screening of populations. These have been included “Snowballing” (Goodman, 1961) and "Pyramiding" (von Hippel et al. 2009). A key issue with approaches for lead user identification is that they have remained mainly manual, demanding considerable resources to execute (Churchill et al. 2008). Considering the limitations with traditional Lead User Identification and based on Machine Learning techniques, namely Natural Language Processing, there have been efforts in automating identification in a scalable and efficient way.
While there is a limited number of publications with this purpose, identified successful methods include the development of applications for web crawling and semantic analysis of user-generated content (Kaulartz and von Hippel, 2018), data mining of social network content (Tuarob and Tucker, 2015), and an effort for automated web crawling of Patient Innovations (Almeida, 2018), confirming the potential for the development of automated tools with this goal.
11
Section 3 - Research context, data and methods
3.1. Research context
The development of an automatic system that helps in identification of innovations developed by users, in the field of healthcare in this study, can be relevant primarily, for its contribution to faster identification of Patient Innovations, and their better diffusion.
The designated diffusion channel for this study is the Patient-innovation platform (www.patient-innovation.com), a centralized repository of Patient Innovations. The aim of this platform is to solve the user innovation in health diffusion problem: to help isolated acts of innovations be easily and openly accessible. An innovation reaches the platform by an act of posting a text that describes it, either by the innovation developer or by an interested party who found the innovation. By looking into the authors of the posts, it is obvious that most contributions are by a group of authors that were part of the Patient Innovation staff at the time of posting. In other words, the Patient Innovation team searches for innovations and submits descriptions of potential Patient Innovation to be reviewed by a medical officer.
It is exactly the search effort that this study aims to enhance with the News Listener and classifier, by making the job from looking through thousands of news into a review of a few hundreds of news per day. The Patient Innovation team, which has been responsible for identifying and cataloguing Patient Innovations for introduction in the Patient Innovation platform, has executed this process mainly through manual web browsing of blogs and news websites, constituting a labour intensive work with the potential to be at least partly automatized, while allowing for the expansion of analysis from a few web pages to millions of news outlets.
12 Considering the topic of Open Innovation in Healthcare, known as Patient Innovation, and the opportunities in text classification through Natural Language Processing techniques, the following question was explored: “Is there a feasible way to enable an automatic text classification system for Patient Innovations in a Text Corpus of newly published news articles, in a form of a ‘News Article Listener’?”. This question is developed in the following section.
3.2. Methods
3.2.1 - Dataset Development
In order to develop a model for training and classification, a choice for data source was made on Articles posted online in English-language newspapers. This decision was made due to the relative consistency in terms of language and structure used in articles and the ease in obtaining them in order to be processed and used in the training of the classification model. Because of the rarity of news articles describing products and services that can be defined as Patient Innovation, in order to provide the model with a relevant number of observations that can be classified as Patient Innovation, a supplement of observations was generated by scrapping the patient-innovation.com website. As previously presented, this website is an online open platform that serves as a repository of innovations made by users, whether they are patients, caregivers, family or friends, with entries comprising solutions and forum posts describing innovations done by users. Each submission crawled from patient-innovation.com provides key information on the innovation, including an overall description of it, which has been edited by the Patient Innovation Team from sources such as news articles or submissions done by users. An example of submission to this platform can be found in Appendix A. Although the submissions crawled are not news articles, it is expected that they will still be valid for training purposes, as they include terminology and descriptions that are adequate in
13 terms of context. The main source used to build the full dataset was the MIT Media Cloud project. This platform provides multiple tools for the retrieval and analysis of news articles, including “Explorer”, which was used in order to extract news articles that are obtained from queries related to health and medicine. Screenshots of this application are included in Appendix B.
The results from different queries were compiled into a set of .csv files containing the information downloaded. Because of constraints in terms of the service itself, it is not possible to extract any text from these articles beyond its title. As each article entry includes the URL to the original web page from which the article was initially found, a web crawler was built to automatically extract the complete text from each URL, using a specialized Python library for Newspaper Articles, called Newspaper3k (Ou-Yang, L. 2013).
After the extraction of a set of news articles (from here onward referred to as a document), both from the ones extracted from the Patient-innovation platform and the ones crawled based on information retrieved from the MIT Media Cloud, two datasets were built:
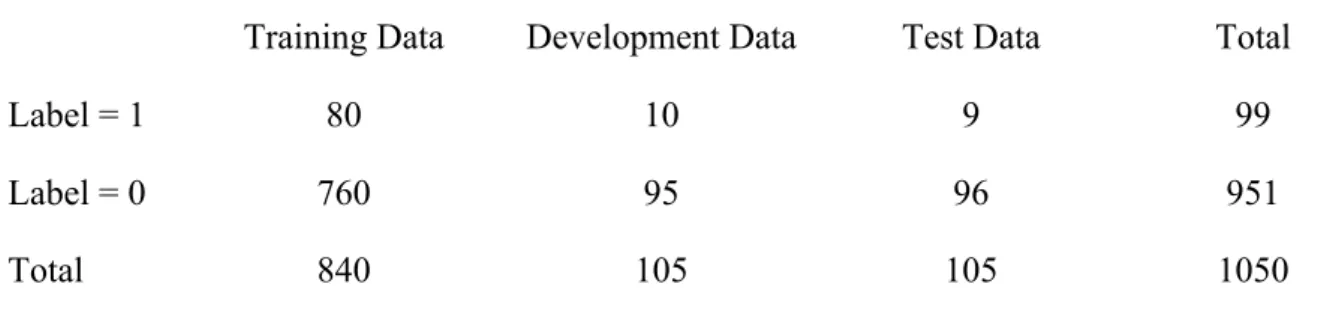
1. A labelled dataset, comprising 1,050 observations, that includes 99 observations describing Patient Innovations, and 951 that do not describe Patient Innovations. Each observation is equivalent to a document and contains the full text from that specific article after normalization. This dataset is used for training the classifier and therefore is labelled to identify documents that describe Patient Innovations.
2. An unlabelled dataset, comprising 14,977 observations, with no prior selection having been done, and that includes an unknown number of Patient Innovations. This dataset is not used in training. Instead, it is used to test the developed classifier's performance in a real-life scenario, of thousands of news articles that are to be labelled as either describing a Patient Innovation or not.
14 The two datasets comprise the total corpus of documents used, composed of 16,027 documents, and are pre-processed together in the same batch for each pre-processing method, to ensure consistency of features extracted to be used in training and classification between the two datasets. In terms of data structure, the initial data to be used has only one parameter: the document containing the complete article or listing describing the Patient Innovation or the news article that has been downloaded. The Label included in the training dataset can take one of two values: “1”, if the document is describing a Patient Innovation, or “0” if the document is not. Documents referring to the label of “1” are retrieved from the two sources presented above: submissions from the patient-innovation.com platform and News articles that have been found describing Patient Innovations. The original URL of each news article is reserved for after conclusion of the process, to confirm the classification of unlabelled data.
3.2.2 - Pre-processing
Pre-processing was done through the NLTK python libraries, specialized in NLP (Bird et al, 2009). After scraping each document, normalization was applied through NLTK, which includes:
• Removal of all upper caps from all documents
• Removal of all punctuation from all documents
• Removal of all numbers from all documents
• Removal of all special characters or characters (e.g. # % /) from all documents
• Removal of all URLs present in all documents
The next stage of pre-processing involves the transformation of the words in the full corpus into reduced forms. The approaches chosen were the Lemmatization (transformation of a
15 word into its lemma, or canonical form) and Porter Stemming (transformation of a word into its stem, or root form) (Porter, 1980) of each word, or tokens, present in each document. Examples of the application of the two techniques to the original dataset are included in Appendix C. These two approaches to text processing reduce the total number of words in the corpus used, resulting in a reduction of the vocabulary without loss of significant information, which will ensure the overall complexity for feature extraction to be done further on to also be reduced. After application of each text transformation approach, a word counter is introduced in order to find words that occur only once in the corpus: since these terms only occur in one document, they are not enough to be used in any comparison between documents, and would affect the overall process of feature extraction (Saif et al. 2014). These words are ignored when performing feature extraction from the documents. Alongside these, words defined as “Stop word” (words with no specific meaning and that do not contribute to the classification of a document, e.g. “and”, “with”, “to”) are also ignored in feature extraction. By excluding words defined as Stop words or Words with a count of one from the Feature Extraction Process, the total size of the vocabulary being considered will be reduced, which is equivalent to suppressing irrelevant dimensions from the data, which could lead to poorer statistical performance. These reductions are presented in the table below:
Table 1 - Size of Vocabulary before and after each step of pre-processing
Method for Text Transformation
Vocabulary Before Text transformation
Vocabulary After Text transformation
Vocabulary after removal of Stop words and words
with Count of 1 Lemmatization 127140 97221 86183 Stemming 127140 95534 77074 Table 1: Values correspond to the size of the vocabulary of the complete dataset, comprising 16027 documents, at each step of pre-processing. Text Transformation comprises the Stemming and Lemmatization of words in the documents. Number of Features after Feature extraction refers to the size of the vocabulary after removal of stop words and words with count of 1.
16 One challenge when dealing with textual data in comparison to numerical data is the property of text as non-quantifiable and unstructured data. Due to this, three approaches to Feature Extraction will be applied, where the text data is converted into a set of numerical variables or regressors, corresponding to the vocabulary present in each document, that can be interpreted by classification algorithms. The three Feature Extraction approaches used are:
1. Count Vectorization provides a matrix of token counts, in the form Number of Features
* Number of Documents, according to the number of occurrences of each word (or feature) in each document. This approach is implemented through Scikit-Learn (Pedregosa et al, 2011).
2. TF-IDF provides a matrix in the form Number of Features * Number of Documents,
where each cell contains the Term Frequency (TF) times the Inverse Document Frequency (IDF). In other words, this approach reweights the value of the frequency of a specific term according to its overall frequency in the full corpus. Similarly to Count Vectorization, this approach is implemented through Scikit-Learn.
3. Doc2Vec develops embeddings of words found in documents (Le and Mikolov, 2014) and
returns a representation of each document in the form of a vector. The number of features and size of vectors extracted was set at 1,000, as higher numbers did not generate significant improvements. This approach is implemented through Gensim (Rehurek and Sojka, 2010).
For the Bag of Words and TF-IDF approaches, both the Stemmed and Lemmatized versions of the training set were used, in two different iterations of the process. In the case of Doc2Vec, the original normalized documents were used, without any additional text transformation. Considering the dimensions of the matrices obtained from feature extraction through Count Vectorization and TF-IDF, which can be translated into Number of Features *
17 Number of Documents, it is plausible to suppose that some classification algorithms will face the issue of high dimensionality when in the process of developing models based on this data. For instance, the full TF-IDF matrix after applying Stemming to the original data has a shape of (77,074 * 16,027). To reduce the total number of features present (which will contribute to a reduction of dimensionality and elimination of noise), a vector space representation will be generated that will take information of every term into account and represent it in simplified form.
This is done with the implementation of Latent Semantic Analysis (LSA). LSA is a mathematical method that decomposes a set of regressors expressed as numerical values into a smaller set of orthogonal factors without the loss of significant information and is based on a spectral decomposition of the count matrices using truncated singular vector decomposition (Dumais et al, 1988). The number of components extracted after LSA was fixed at 500, as higher numbers did not result in significantly improved results, and lower numbers resulted in worse classification results from trials. In this implementation, features that result from LSA are normalized, to deal with different ranges of different features. LSA is only applied in the matrices obtained from Count Vectorization and TF-IDF Feature extraction.
The final output of this section is a set of nine matrices: four matrices with the original features extracted from the CountVectorizer and TF-IDF, after applying lemmatization and stemming; four matrices that decompose the original four into a set of matrices with a lower number of features through LSA; one matrix of the set of vectors that represent the document embeddings obtained through Doc2vVec. Each of the matrices referred (which represent the original corpus) is divided into the labelled (of 1050 documents) and unlabelled dataset. The labelled dataset is then split into three smaller datasets, for training, developing and testing each classifier, corresponding, respectively, to 80%, 10% and 10% of each of the initial training matrices. To ensure the same results from this split for each implementation, the
18 seeds were defined. The resulting datasets have the characteristics described in the table below. Histograms of these distributions are included in Appendix D.
Table 2 – Training, Development and Test Data after split of Labeled Dataset
Training Data Development Data Test Data Total
Label = 1 80 10 9 99
Label = 0 760 95 96 951
Total 840 105 105 1050
Table 2: Values correspond to the number of documents in each class. Division of the Labeled data into Training, Development and Test datasets with a 0.8 / 0.1 / 0.1 ratio resulted in three datasets with roughly the same proportions (10%) of labels with a value 1.
As can be seen in the table above, there is a significant imbalance between documents with a label of 1 (a document describing Patient Innovation) and 0 (a document not describing Patient Innovation) in the training set, with documents with a label of 0 greatly outweighing the documents with a label of 1. Balancing the two classes is critical for the algorithms used to provide better results. A popular approach for dealing with imbalanced datasets makes use of over-sampling techniques (Last et al, 2017). In this work, SMOTE (Synthetic Minority Over-Sampling Technique) (Chawla et al, 2002) was applied in the pre-processing process, as Oversampling has been described as having the potential to generate improved results in previous text classification efforts where classes are not balanced (Ah-Pine and Soriano-Moral, 2016). SMOTE was used in this specific application through the application of the Imbalanced-learn toolkit for Python (Lema et al, 2017). After application of this tecnique to each of the matrices obtained in the Feature Extraction processes, we have reached a training dataset that comprises both real and artificial entries, and that has an equal number of observations classified as “1” and as “0”. After this step, pre-processing is completed, and the
19 datasets to be used in the models’ training have the distributions presented in the following table.
Table 3 – Training, Development Data after application of SMOTE
Training Data Development Data Test Data Total
Label = 1 760 10 9 779
Label = 0 760 95 96 951
Total 1520 105 105 1730
Table 3: Application of SMOTE to the Training Data resulted in a balanced dataset, with equal proportions of labels with value 1 and value 0.
3.2.3 - Model Training
The following algorithms (all corresponding to supervised methods) were chosen for training:
1. Decision Tree
2. K-Means (with K=2, in accordance with the number of classes being used)
3. Multinomial Naïve Bayes
4. Logistic Regression
The choice of the above algorithms was done based on their simplicity in implementation and effectiveness in information retrieval. Multinomial Naive Bayes was chosen as it is suitable for classification with word counts or fractional representations of word counts, such as TF-IDF. Because of this, this method is only applied to the direct outputs of TF-IDF and Count Vectorizer Feature Extractions, without LSA. Logistic Regression was chosen due it being a good classifier for problems of binary classification, as is the case for this work. The Decision Tree Classifier was chosen to check for the possibility of training a model with relatively
20 simple and interpretable rules. K-Means was chosen to check for the possibility of generating well-defined document clusters with different classes. Logistic Regression, Decision Trees and K-Means were applied to each Feature Extraction Method, while Multinomial Naïve Bayes was applied to all except Doc2Vec. As the dataset used is relatively small (comprising 16,027 documents), algorithms that work best with a large corpus, such as Neural Networks (Roberts, 2016) were not applied. All algorithms were applied through the Scikit-Learn toolkit. In total, accounting for the different pre-processing techniques and classification methods, 19 different training approaches were used. A diagram with the complete classification process is found in Appendix E.
21
Section 4 - Results
4.1 - Training Results
For performance measurement, a set of performance metrics have been included for comparison. The chosen metrics are F1-Score, ROC Score, Precision (the number of true positives over the total of true positives and false negatives) and Recall (ratio of the number of true positives over the total of true positives and false negatives). All performance metrics were calculated through Scikit-Learn implementations. The implementation of SMOTE, to balance the dataset between the two labels appears to have made a significant contribution for the training of the different algorithms, in terms of their Precision and Recall. Results from the application of each feature extraction and classifier algorithm to the test set, after being trained and calibrated using the development dataset, are included as confusion matrices and performance metrics in Appendix F.
Looking at the results obtained for performance metrics, the Doc2Vec Feature Extraction method was the worst performing overall. This may have been due to the relatively small sized dataset for model training, as Doc2Vec models have improved performance with larger datasets. TF-IDF and Count Vectorization have similar results between the two. Furthermore, Lemmatization and Stemming text transformation approaches seem to result in most cases in non-significant differences in terms of results. Regardless of the pre-processing approach used, both Decision Trees and K-Means achieve consistently inferior results. This may be due to the spatial distribution of the vectors, as documents with different labels can be visualized as very close to one another and are therefore not easily clustered (for a visualization of a PCA representation with two components of the test set, see Appendix G). Multinomial Naive Bayes and Logistic Regression have consistently good results, regardless of text transformation and pre-processing approaches chosen.
22
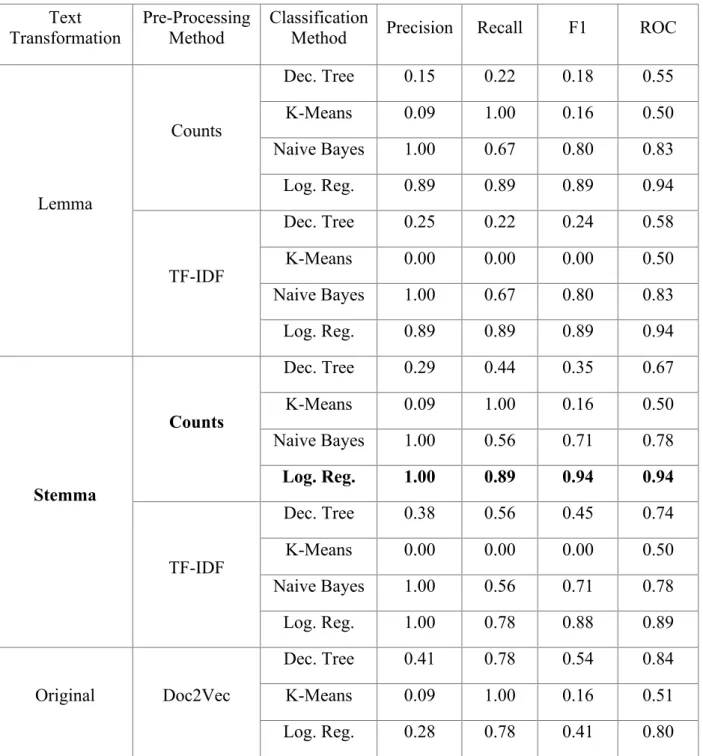
Table 4 – Performance Metrics Results After application of Classification Methods on Test Dataset Text Transformation Pre-Processing Method Classification
Method Precision Recall F1 ROC
Lemma Counts Dec. Tree 0.15 0.22 0.18 0.55 K-Means 0.09 1.00 0.16 0.50 Naive Bayes 1.00 0.67 0.80 0.83 Log. Reg. 0.89 0.89 0.89 0.94 TF-IDF Dec. Tree 0.25 0.22 0.24 0.58 K-Means 0.00 0.00 0.00 0.50 Naive Bayes 1.00 0.67 0.80 0.83 Log. Reg. 0.89 0.89 0.89 0.94 Stemma Counts Dec. Tree 0.29 0.44 0.35 0.67 K-Means 0.09 1.00 0.16 0.50 Naive Bayes 1.00 0.56 0.71 0.78 Log. Reg. 1.00 0.89 0.94 0.94 TF-IDF Dec. Tree 0.38 0.56 0.45 0.74 K-Means 0.00 0.00 0.00 0.50 Naive Bayes 1.00 0.56 0.71 0.78 Log. Reg. 1.00 0.78 0.88 0.89 Original Doc2Vec Dec. Tree 0.41 0.78 0.54 0.84 K-Means 0.09 1.00 0.16 0.51 Log. Reg. 0.28 0.78 0.41 0.80
Table 4: The best performing combination of text transformation, pre-processing method and classification model was the application of a Logistic Regression on the Count Vector after Stemming the original dataset, with top scores for all performance metrics.
The top combination of feature extraction and algorithm, in this application, was the combination of Count Vectorizer on the Stemmed Text, using the Logistic Regression. By
23 applying this method to the test set, a Precision score of 1.00, a Recall score of 0.89 and F1 score and ROC score of 0.94 were obtained. This approach is used in the next stage of the process, where it is applied to the unlabelled dataset and its efficiency will be tested in a similar-to-real-life scenario.
4.2 - Testing with Unlabelled Dataset
Applying the winning classification method, Logistic Regression, with Count Vectors generated from the Stemmed documents, to the Unlabelled Dataset, which comprises 14977 observations, resulted in 519 documents having been classified as containing Patient Innovations. A histogram of this distribution is included in Appendix H. Out of these 519 classifications classified as 1 (describing Patient Innovation), 6 have been confirmed as True Positives after analysis of the original article, corresponding to a precision of 1.2%. A screenshot of the original article page for identified Patient Innovations, as well as a link and a highlight in the text, are included in Appendix I. Furthermore, after ordering the labelled documents according to the probability score also extracted from the application of Logistic Regression, the first document with a Label of 1 that corresponds to a Patient Innovation is found in the second position (rank = 2), which corresponds to a Mean Reciprocal Score (MMR) of 0.5 (1 / rank), constituting a good result. The results obtained show that the classifier is performing as intended, as it is able to distinguish Patient Innovations out from the complete set, even if there is a considerable number of documents being labelled as 1, despite not describing Patient Innovations. This can be explained by the contents found in these articles, as they frequently describe new products developed, either by users or firms, albeit not related to healthcare or medicine, or include stories related to a disease or condition, but not necessarily about a Patient Innovation. Regardless of the relatively low Precision at
24 this stage, the fact that this Classifier can filter a large news article set into a subset of potentially relevant articles is an encouraging result for future developments, promising a reduction in the effort of Patient Innovations identification, while contributing to a strengthening of the knowledge on Patient Innovators worldwide.
25
Section 5 - Conclusions and Future Work
In this project, it has been demonstrated that a system for automatic text classification for Patient Innovations in a Text Corpus is indeed feasible. From the experiment performed in the prototype developed in this project, a set of 14,977 unlabelled articles was reduced to a subset of 519 documents, from which 6 Patient Innovations were found by manual search. This can be interpreted as a successful result: not only was the classification workload for the human operator reduced by the factor of 30, the system was able to identify actual Patient Innovations. The discovery of 6 news articles describing Patient Innovations in 14,977 articles is in itself a successful result, as it demonstrates that with a sufficient volume of news articles to be used as inputs, new Patient Innovations can be indeed routinely found, in a non-insignificant number. Considering the variety of available online newspapers, it is reasonable to expect many additional Patient Innovations may be found with new versions of this process.
With future iterations of the algorithm and of the manual search on the reduced sample, new positive and negative examples of Patient Innovations can be added to the labelled dataset. The larger the labelled dataset, the better the trained classifier is expected to be, which means that by re-applying the system, a positive feedback mechanism can be achieved, which would improve the system’s overall performance. Considering the evolving scenario of increasing recorded instances of user innovation, the development of an AI system that can help human operators in dealing with this increased unprocessed and unstructured data volume, and that can be continually improved and further developed has the potential of generating considerable value and additional knowledge of user innovations.
For further development of the classification model, there are opportunities for future work to improve on this prototype, namely through experimentation with semi-supervised methods in
26 addition to the supervised methods applied in this project, or other approaches to pre-processing, such as additional methods of dealing with imbalanced data beyond SMOTE, which may provide different results in training and classification.
Furthermore, it is relevant to understand the limits of the approach used. At this time, articles used for training and classification were sourced from MIT Media Cloud: future versions of this system should consider integrating feeds from online news outlets as sources, with articles being downloaded to a database and classified by a developed classification model. This model could, similarly to what was done in this project, filter the original dataset into a smaller subset, so a human operator can analyse downloaded news articles. A diagram representing this concept is included in Appendix J. Furthermore, all development in this project was done with articles sourced from English sources. Although using sources with other languages would require building a new classifier model from the ground up, it should still be considered, to expand the search for Patient Innovations beyond the English-speaking world. One final consideration is the current practical inability to calculate recall on the classified unlabelled dataset, as the number of Patient Innovations classified as “Not Patient Innovation” is unknown. Even so, this News Articles Listener shows evidence that, even at this initial stage, it is able to distinguish articles containing Patient Innovations from other articles, which is a promising result for future work, with the potential to contribute to the observed shift in healthcare, as well as accelerate innovation diffusion and increase social welfare of society as a whole.
27
References:
• Ah-Pine, J., & Morales, E. P. S. (2016). A study of synthetic oversampling for twitter imbalanced sentiment analysis. In CEUR Workshop Proceedings (Vol. 1646, pp. 17–24).
• Al-Zu’bi, Z., & Tsinopoulos, C. (2012). Suppliers versus Lead Users: Examining Their Relative Impact on Product Variety. Journal of Product Innovation Management, 29(4).
• Almeida, J. (2018). 2Gather4Health: Web Crawling and Indexing System Implementation.
• Canhão, Helena; Oliveira, Pedro; Zejnilovic, L. (2016). Patient innovation — Empowering patients, sharing solutions, improving lives. The New England Journal of Medicine, Catalyst, (November).
• Chawla, N. V, Bowyer, K. W., Hall, L. O., & Kegelmeyer, W. P. (2002). SMOTE : Synthetic Minority Over-sampling Technique. Journal of Artificial Intelligence Research, 16, 321–357.
• Churchill, J., von Hipel, E., & Sonnack, M. (2009). Lead User Project Handbook
• De Jong, J. P. J., Von Hippel, E., Gault, F., Kuusisto, J., & Raasch, C. (2015). Market failure in the diffusion of consumer-developed innovations: Patterns in Finland. Research Policy, 44(10), 1856–1865.
• Deerwester, S., Dumais, S. T., Furnas, G. W., Landauer, T. K., & Harshman, R. (1990). Indexing by Latent Semantic Analysis. JASIS, 41, 391–407.
• DeMonaco, H. J., Oliveira, P., Torrance, A. W., von Hippel, C., & von Hippel, E. (2018). Free Medical Innovation by Patients – No Producers Required. SSRN Electronic Journal.
• Gambardella, A., Raasch, C., & von Hippel, E. A. (2017). The User Innovation
Paradigm: Impacts on Markets and Welfare. SSRN Electronic Journal, 63(5), 1271–1656.
• Goodman, L. A. (1961). Snowball Sampling. The Annals of Mathematical Statistics, 32(1), 148–170.
• Harris, M., Bhatti, Y., Prime, M., del Castillo, J., & Parston, G. (2018). Low-cost innovation in healthcare: what you find depends on where you look. Journal of the Royal Society of Medicine, 111(2), 47–50.
• Henkel, J., & von Hippel, E. (2005). Welfare Implications of User Innovation. Journal of Technology Transfer, 30(1/2), 73–87.
28
• Hienerth, C., Von Hippel, E., & Berg Jensen, M. (2014). User community vs. producer innovation development efficiency: A first empirical study. Research Policy, 43(1), 190–201.
• Hippel, E. V. O. N. (1986). Lead Users: A Source of Novel Product Concepts. Management Science, 32(7), 791–806.
• Hyysalo, S., & Usenyuk, S. (2015). The user dominated technology era: Dynamics of dispersed peer-innovation. Research Policy, 44, 560–576.
• Kaulartz, S., & Von Hippel, E. (2018). Lead user innovation identification: Rapid semantic analyses of digital conversations.
• Last, F., Douzas, G., & Bacao, F. (2017). Oversampling for Imbalanced Learning Based on K-Means and SMOTE, 1–19.
• Le, Q., & Mikolov, T. (2014). Distributed Representations of Sentences and Documents. In 31st International Conference on Machine Learning (Vol. 32).
• Lemaitre, G., Nogueira, F., & Aridas, C. K. (2017). Imbalanced-learn : A Python Toolbox to Tackle the Curse of Imbalanced Datasets in Machine Learning. Journal of Machine Learning Research, 18, 1–5.
• Lüthje, C., & Herstatt, C. (2004). The Lead User method: An outline of empirical findings and issues for future research. R&D Management.
• Lüthje, C., Herstatt, C., & Von Hippel, E. (2005). User-innovators and “local” information: The case of mountain biking. Research Policy, 34(6), 951–965.
• Lüthje, C., Herstatt, C., & von Hippel, E. (2002). The Dominant Role of “Local” Information in the User Innovation the Case of Mountain Biking. SSRN.
• Morrison, P. D., Roberts, J. H., & Midgley, D. F. (2004). The nature of lead users and measurement of leading edge status. Research Policy, 33(2), 351–362.
• Oliveira, P., & Von Hippel, E. (2011). Users as service innovators: The case of banking services. Research Policy, 40(6), 806–818.
• Oliveira, P., Zejnilovic, L., Canhão, H., & Von Hippel, E. (2015). Innovation by patients with rare diseases and chronic needs. Orphanet Journal of Rare Diseases, 10(1).
• Ou-Yang, L. (2013). Newspaper3k: Article scraping & curation.
• Pajo, S., Verhaegen, P. A., Vandevenne, D., & Duflou, J. R. (2015). Fast lead user identification framework. In Procedia Engineering (Vol. 131, pp. 1140–1145). Elsevier B.V.
29
• Pedregosa, F., ̈Gaël, V., Gramfort, A., Michel, V., Thirion, B., Grisel, O., … Duchesnay, É. (2011). Scikit-learn : Machine Learning in Python. Journal of Machine Learning Research, 12, 2825–2830.
• Porter, M. F. (1980). An algorithm for suffix stripping. Program, 14(3), 130–137.
• Rehurek, R., & Sojka, P. (2010). Software Framework for Topic Modelling with Large Corpora. In Proceedings of the LREC 2010 Workshop on New Challenges for NLP Frameworks.
• Roberts, K. (2016). Assessing the Corpus Size vs. Similarity Trade-off for Word Embeddings in Clinical NLP. In Proceedings of the Clinical Natural Language Processing Workshop (pp. 54–63).
• Saif, H., Fernandez, M., He, Y., & Alani, H. (2014). On Stopwords , Filtering and Data Sparsity for Sentiment Analysis of Twitter. In LREC 2014, Ninth International Conference on Language Resources and Evaluation. Proceedings (pp. 810–817).
• Schreier, M., & Prügl, R. (2008). Extending lead-user theory: Antecedents and consequences of consumers’ lead userness. Journal of Product Innovation Management, 25(4), 331–346.
• Schweisfurth, T. G., & Raasch, C. (2015). Embedded lead users - The benefits of employing users for corporate innovation. Research Policy, 44(1), 168–180.
• Stock, R. M., Oliveira, P., & Von Hippe, E. (2015). Impacts of hedonic and utilitarian user motives on the innovativeness of user-developed solutions. Journal of Product Innovation Management, 32(3), 389–403.
• Tuarob, S., & Tucker, C. S. (2015). Automated Discovery of Lead Users and Latent Product Features by Mining Large Scale Social Media Networks. Journal of Mechanical Design, 137(7).
• von Hippel, E. (2005). Democratizing innovation: The evolving phenomenon of user innovation. Journal Fur Betriebswirtschaft, 55(1), 63–78.
• von Hippel, E. (1986). Lead Users: A Source of Novel Product Concepts. Management Science, 32(7), 791–805.
• von Hippel, E. A., de Jong, J. P. J., & Flowers, S. (2012). Comparing Business and Household Sector Innovation in Consumer Products: Findings from a Representative Study in the UK. Management Science, 58(9), 1669–1681.
• von Hippel, E., Franke, N., & Prügl, R. (2009). “Pyramiding: Efficient search for rare subjects.” Research Policy, 38(9), 1397–1406.
30
• Zejnilovic, L., & Oliveira, P. (2014). Innovation efforts, diffusion, and fall-offs of innovation activity in medical patients community. Academy of Management Annual Meeting Proceedings, 1.
• Zejnilovic, L., Oliveira, P., & Canhão, H. (2016). Innovations by and for Patients , and Their Place in the Future Health Care System. In Boundaryless Hospital (pp. 341–357).
31
Appendix:
Appendix A: Example for a Submission done in Patient Innovation Platform
Example of Patient Innovation Description used for Model Training: Wireless Insulin Pump
32
Appendix B: Screenshots from MIT Media Cloud Platform
Home screen for Explorer Tool of MIT Media Cloud
Accessed at: https://explorer.mediacloud.org/, on 26th February 2019
MIT Media Cloud Explorer – Query Editor
33
Appendix C: Text Transformation Results
34
35
Appendix D: Distribution of Labels for Training, Development and Testing Datasets
Training Dataset Distribution (before Resampling):
Count of 0: 760 Count of 1: 80
Development Dataset Distribution:
Count of 0: 95 Count of 1: 10
Testing Dataset Distribution:
Count of 0: 96 Count of 1: 9
36
Appendix E: Diagram representing complete classification process employed in selection of best pre-processing and classification methods
37
Appendix F: Confusion Matrix Results for different application of Pre-Processing and Classification Models to Testing Dataset
Appendix F-1: Confusion Matrixes after Lemmatization and Count Vectorizer
Decision Tree Precision: 0.15 Recall: 0.22 F1-Score: 0.18 ROC Score: 0.55 K-Means (K = 2) Precision: 0.09 Recall: 1.00 F1-Score: 0.16 ROC Score: 0.5
Multinomial Naïve Bayes
Precision: 1 Recall: 0.67 F1-Score: 0.80 ROC Score: 0.83 Logistic Regression Precision: 0.89 Recall: 0.89 F1-Score: 0.89 ROC Score: 0.94
38
Appendix F-2: Confusion Matrixes after Lemmatization and TF-IDF
Decision Tree Precision: 0.25 Recall: 0.22 F1-Score: 0.24 ROC Score: 0.58 K-Means (K = 2) Precision: 0.00 Recall: 0.00 F1-Score: 0.00 ROC Score: 0.58
Multinomial Naïve Bayes
Precision: 1.00 Recall: 0.67 F1-Score: 0.80 ROC Score: 0.83 Logistic Regression Precision: 0.89 Recall: 0.89 F1-Score: 0.89 ROC Score: 0.94
39
Appendix F-3: Confusion Matrixes after Stemming and Count Vectorizer
Decision Tree Precision: 0.29 Recall: 0.44 F1-Score: 0.35 ROC Score: 0.67 K-Means (K = 2) Precision: 0.09 Recall: 1.00 F1-Score: 0.16 ROC Score: 0.5
Multinomial Naïve Bayes
Precision: 1.00 Recall: 0.56 F1-Score: 0.71 ROC Score: 0.78 Logistic Regression Precision: 1.00 Recall: 0.89 F1-Score: 0.94 ROC Score: 0.94
40
Appendix F-4: Confusion Matrixes after Stemming and TF-IDF
Decision Tree Precision: 0.38 Recall: 0.56 F1-Score: 0.45 ROC Score: 0.74 K-Means (K = 2) Precision: 0.00 Recall: 0.00 F1-Score: 0.00 ROC Score: 0.5
Multinomial Naïve Bayes
Precision: 1.00 Recall: 0.56 F1-Score: 0.71 ROC Score: 0.78 Logistic Regression Precision: 1.00 Recall: 0.78 F1-Score: 0.88 ROC Score: 0.90
41
Appendix F-5: Confusion Matrixes after Doc2Vec
Decision Tree Precision: 0.41 Recall: 0.78 F1-Score: 0.54 ROC Score: 0.84 K-Means (K = 2) Precision: 0.09 Recall: 1.00 F1-Score: 0.16 ROC Score: 0.51 Logistic Regression Precision: 0.28 Recall: 0.78 F1-Score: 0.41 ROC Score: 0.80
42
Appendix G: Graphical Representations of Two-Factor PCA Decomposition of Features from Test Set
In the following graphs, yellow labels represent 1’s (Patient Innovations); Purple labels represent 0’s (No Patient Innovation)
Appendix G-1: PCA Decomposition for Lemmatization and Count Vectorization
Pre-processing
43
Appendix G-3: PCA Decomposition for Stemming and Count Vectorization
Pre-processing
44
45
Appendix H - Distribution of Labels for Unlabelled Dataset
Unlabelled Dataset Distribution (after Classification):
Count of 0: 14458 Count of 1: 519
46
Appendix I – Patient Innovations found through application of Classifier to Unlabelled Data
Appendix I-1 - Walking stick that detects frozen limbs for Parkinson’s patients
Source: TheNews, retrieved on 26th February 2019
News Article Link:
https://www.thenews.com.pk/print/236084-Pakistani-student-develops-innovative-stick-to-assist-Parkinsons-patients
Relevant Excerpt: “A Pakistani student entrepreneur whose maternal grandfather was
debilitated by Parkinson’s disease has developed an innovative walking stick to improve the lives of other patients with the condition. Miss Neha Shahid Chaudhry, a 24-year-old graduate of the University of the West of England originally told Geo News in an exclusive interview that she was inspired to invent the mobility aid – a smart walking stick - after observing with helplessness her late grandfather in Pakistan struggling with Parkinson’s disease.”
47
Appendix H-2 - A ‘smart jacket' to diagnose pneumonia
Source: Yahoo!News, retrieved on 26th February 2019
News Article Link:
https://sg.news.yahoo.com/ugandans-invent-smart-jacket-diagnose-pneumonia-050937951.html
Relevant Excerpt: “A team of Ugandan engineers has invented a "smart jacket" that
diagnoses pneumonia faster than a doctor, offering hope against a disease which kills more children worldwide than any other. The idea came to Olivia Koburongo, 26, after her grandmother fell ill, and was moved from hospital to hospital before being properly diagnosed with pneumonia.”
48
Appendix H-3 - INGA Wellbeing: Fashion for All
Source: Huffington Post, retrieved on 26th February 2019
News Article Link:
https://www.huffingtonpost.co.uk/nikla-lancksweert/dress-well-even-when-unwe_b_15061046.html?guccounter=1
Relevant Excerpt: “Having watched our mothers Inga and Diana go through the
de-humanising process of being treated for cancer, and having been hospitalised several times myself to calm colitis flares, my co-founders and I were convinced that what patients wear - either the hospital gown or awkward home clothes - contributes to a lack of confidence and a debilitating sense of vulnerability and dependence.”
49
Appendix H-4 - Knitted breasts for breast cancer survivors
Source: BBC, retrieved on 26th February 2019
News Article Link: https://www.bbc.com/news/uk-scotland-39429119
Relevant Excerpt: “Sharon, who is originally from Bishopbriggs but now lives in Ireland,
faced her own battle against the disease after being diagnosed with breast cancer in January 2013. (…) Sharon discovered Knitted Knockers on social media during her cancer treatment, having been a keen knitter for years and a member of several other online knitting groups. She found knitting to be therapeutic while she went through chemotherapy and radiotherapy. “
50
Appendix H-5 - ChemoWave: giving chemotherapy patients and their doctors insight on treatments, side effects and mental health.
Source: CNBC, retrieved on 26th February 2019
News Article Link:
https://www.cnbc.com/2017/09/01/the-chemowave-app-feeds-data-from-cancer-patients-to-doctors.html
Relevant Excerpt: “ChemoWave is designed to help track a wide variety of vital data like
symptoms, exercise, water intake and medications. It then compiles those figures into a health compliance database, then graphs the information so patients — and their doctors — can connect what symptoms are related to what medication or activity. (…) Matt Lashey, the developer of the app and co-founder of Treatment Technologies & Insights, came up with ChemoWave when his partner Richard Grenell was diagnosed with cancer in 2013.”
51
Appendix H-6 - Tréxõ Robotics: Exoskeleton to help disabled children walk again
Source: DailyMail, retrieved on 26th February 2019
News Article Link:
https://www.dailymail.co.uk/sciencetech/article-4855818/Startup-
unveils-exoskeletons-help-disabled-kids-walk.html?ITO=1490&ns_mchannel=rss&ns_campaign=1490
Relevant Excerpt: “’We are the first ever commercial exoskeleton for children with
disabilities in the world,' cofounder and CEO Manmeet Maggu told DailyMail.com. (…) Maggu came up with the idea for Tréxō while studying Mechatronics engineering at the University of Waterloo in Canada after discovering his nephew Praneit has Cerebral Palsy and may never be able to walk.”
52
Appendix J – Diagram representation of a concept for a fully developed News Article Listener, with direct connection to Online News Sources
53
Appendix K– Github Code Repository
All code and datasets used in this Work Project are accessible in the link below: