IPRDataCol - software for field labelling and
data storage
Deoclecio Domingos Garbuglio
1*Abstract: The software IPRDataCol was developed in 2017 at the Instituto
Agronômico do Paraná (IAPAR) by a research group (Nucleo1) studying in
-formation technology applied to agricultural research. Due to the software architecture, whether the label-generating nor the data capture module use any native database, i.e, the program can be used directly from portable storage devices with flash memory. It is designed as a support tool to meet the needs of different research projects, regarding optimization in the identification of experimental plots in the field or laboratory/greenhouse, with subsequent log
-ging of yield data measured by electronic scales, and storage in digital files. The software can be downloaded free of charge from the internet (http://nucleo1. org), without registration. The use of this program will contribute to minimize errors in data acquisition since the typing phase is not necessary for yield data measured by electronic scales.
Key words: Pascal language, agricultural experimentation, information tech
-nology.
Crop Breeding and Applied Biotechnology 18: 343-348, 2018 Brazilian Society of Plant Breeding. Printed in Brazil
http://dx.doi.org/10.1590/1984-70332018v18n3s52
SOFTWARE RELEASE
*Corresponding author:
E-mail: [email protected]
Received: 13 June 2017 Accepted: 14 November 2017
1 Instituto Agronômico do Paraná (IAPAR), Rod Celso Garcia Cid, km 375, 86.057-970, Londrina, PR, Brazil
INTRODUCTION
The success of a plant breeding program, for any species, depends directly on a good experimental planning, as well as an adequate management of the information of the genotypes used, to obtain highly reliable results that allow the choice of the best breeding strategies based on genetic parameters and biological phenomena, optimizing human, material and financial resources of the research institution.
are being used for these purposes. However, it is worth noting that the main focus of the development of the above-mentioned software was not the automation of data collection and storage.
According to Mathew and Stones (2005), data storage is one of the bases that sustain information technology. In 2005, an estimated share of more than 80% of all software developed in the world was already connected to some kind of data complex and stored in databases. These databases were defined as record-keeping systems of a computer (Date 1991), i.e., systems with the overall purpose to store and make information available upon request. “Available information” is understood as any information considered significant or necessary in a decision-making process of the breeder or the organization served by a certain partially or fully automated system.
According to Torres (1998), by automation a greater number of traits can be controlled, reducing the loss of information and number of errors imported in the database. In this respect, it should be considered that there are few research programs in which, for example, plot harvesters are used with a combined weighing system and automated data storage of the experimental plots, all in one, mainly due to the high cost of purchase or adaptation of this type of equipment. Therefore, if no such system is available, the harvested material must be weighed and yield data listed manually.
A low-cost alternative would be to connect electronic scales to personal computers that have real-time data capture software, fed with data from the scales, and with automatic recording of plot identification by custom barcode labels. However, as to date no free software for the generation of barcode labels associated with data capture and storage modules was available, universities, companies, public research institutes, and even small and medium-sized private companies have tabulated data in spreadsheets. This makes the process error-prone, since the probability of mistakes in typing data or copying entire cells or columns erroneously is always high (Phenome-Networks 2016). In this sense, Cruz (2013) cites that the development of software in the field of genetics and plant breeding is crucial in view of the scarcity of these resources, available to the scientific community.
The software in question is designed as a free support tool to meet the needs of different research projects with a view to the optimization of the identification of experimental plots both in the field and in the laboratory/greenhouse and the subsequent capture and storage of yield data by electronic scales, making the information available for later transfer to databases or even electronic spreadsheets, according to the user’s preference.
SOFTWARE IPRDATACOL
The software IPRDataCol (Figure 1A) was developed in 2017, at the Agronomic Institute of Paraná (IAPAR), by a Núcleo1 research group studying information technology applied to agricultural research and registered at National Institute of Industrial Property (INPI) with number BR512017001116-8. The Pascal programming language was used
as a basis for Windows® operating systems and IBM-compatible computers. The software can be downloaded free of charge from the internet (http://nucleo1.org) without registration.
During the development of the software, it was decided not to use any native database in order to keep it as independent as possible from updates of the operating system. Instead, transient databases are created from temporary datasets for the generation of labels, capturing, storing, and exporting data to * .txt format files containing the collected data.
With this software architecture pattern, the executable file can be unzipped in any folder and used directly from portable storage devices with flash memory (pendrives or memory cards). However, to avoid any conflicts due to certain security settings of antivirus programs, it is recommended to include the path to the folder where the software executable is located in the antivirus exclusion list.
Software IPRDataCol is divided into two work modules, namely: I) - barcode label generating module (Module EtiqLF); II) - module for capturing and storing data from electronic scales with an RS-232 output (Module DataCapture).
Barcode Label Generator Module (EtiqLF)
On the main screen of module EtiqLF (Figure 1B), the menu displays information about the main functions of the module, such as the type of paper recommended for use and the main features, an example file in * .csv format used for data entry and contact information of the software programmer.
Two buttons for label generation and printing were programmed in the module, one in the strip format, and one in the card format for harvest data. Both label templates have the same basic information for each plot (genotype, experiment, location, replication, year, and plot number), including the information contained in the barcode. The generated barcode contains the information, ordered in the sequence: location identification, trial identification and plot number, separated by a dash so that after the import to spreadsheets (*.xls, *.xlsx, or *.ods extensions) the process of screening this information is facilitated by the “text-to-columns” option.
The barcode on the labels uses the default code 39, or also called Code 3 of 9, which is the most popular format in inventories and non-retail control. The variable length format accepts the following 44 characters: 0123456789ABCDEFGHIJKLMNOPQRSTUVWXYZ. * $/+%. Since the asterisk (*) is used as an information start/stop character, it can not be used in the plot identification body. Code 39 is used with a Module 43 check digit formats employed by U.S. Customs for import export shipments and dozens of other applications.
The labels must be printed on a polyester film called Laser Film. This type of film is used in graphics and for laser printing (especially of texts). It has an additional layer with specific roughness and heat settings to receive the impression, and generally a thickness of 93 or 117 μm.
In agricultural research, Laser Film can be used to print field labels, containing barcodes or even QRCodes (2D codes), which allow the identification of the plots with the greatest amount of information and subsequent automated data collection and storage.
Since field experiments are exposed to more external influence factors, especially in terms of temperature and humidity, after the generation of the labels, the application of clear varnish on the printed area is recommended. The purpose is to ensure the viability of the information printed on the labels for a longer period of time, depending on the thickness and quality of the Laser Film and toner used.
In greenhouse experiments, it is understood that the print quality tends to be maintained for a longer period of time than in field experiments, even without varnishing, due to the greater control of temperature and humidity.
Data file
The sample file distributed with the software (EXAMPLE. csv) was originally created in *.xlsx format and converted to *.csv, with column separation by semicolons. In the case of files generated with a comma as separator, these must be substituted by semicolons to ensure that the information is read and incorporated correctly by the system so as not to compromise label generation.
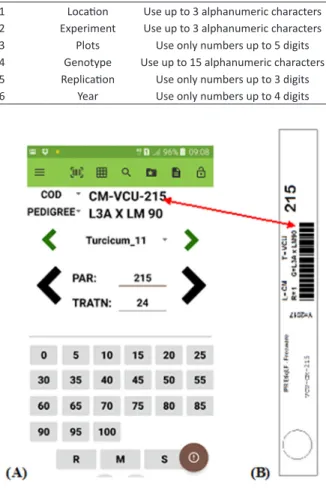
Once the labels were generated and distributed in the experimental area, software for field data collection can be used, e.g., the FieldBook system (Rife and Poland 2014), developed for mobile devices, freely available for both the Android and IOS platforms (Figure 2A). In order to use the barcode reading function of the program, the file with the experiment information that will be entered in the software must contain an identification column of each plot and the same information as the barcode (Location-Experiment-Plot), so that a given plot is localized efficiently (Figure 2B, COD field).
Data Capture Module (DataCapture)
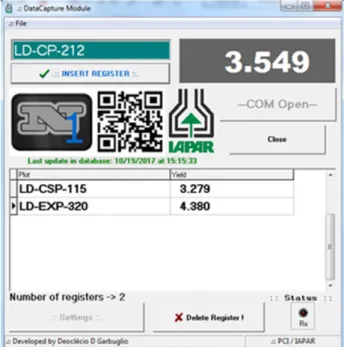
The Module DataCapture displays registry control buttons (Insert and Delete) as well as the “Settings” button to establish a correct connection between the computer and the scale for later data transmission (Figure 3). A display stores the weight transmitted by the scale in continuous mode. Any change in the scale display will change the weight shown on the display of the software for storage in real time.
If no configuration of the scale for continuous data transmission or equivalent denomination is available, the scale print button has to be pressed at each weighing so that the data is transmitted to the Module DataCapture. The scale manual or supplier must be consulted for the correct information.
The data of the experimental plot that appears in the
barcode can be recorded together with the yield, through the use of an optical reader connected to the USB port of the computer.
Connection and data transmission between software and electronic scales
Data transmission is performed via RS232 (international standard), in which the data output of the scale is generally composed of a DB9 or DB25 male connector. As the connection specification between scales models may change, especially for the transmitter (Tx) and receiver (Rx) data pins, the user should consult the communication cable diagram at purchase or construction of the cable/connector for connection to personal computers.
In the RS-232 communication standard, data in ASCII format are sent one by one, using a binary (1 and 0) bitset system. The most commonly used encoding is an asynchronous start-stop type, which uses a start bit, followed by eight data bits (one parity bit), and one to two stop bits, in which case at least 10 bits are required to send a character.
For data reception by personal computers, it is important to note that there are almost no communication ports (models COM1 or COM 2, for example) on current computers, which are replaced by USB ports. In this case, the use Table 1. Description of file *.csv columns, with observations and
limitations, to be used to generate labels by Module EtiqLF Column Information Observations and limitations
1 Location Use up to 3 alphanumeric characters 2 Experiment Use up to 3 alphanumeric characters 3 Plots Use only numbers up to 5 digits 4 Genotype Use up to 15 alphanumeric characters 5 Replication Use only numbers up to 3 digits 6 Year Use only numbers up to 4 digits
Figure 2. Field data readout screen for trait E. turcicum spot
of DB9 USB or DB25 USB connectors is required for data transmission.
When using this type of configuration, the operating systems do not immediately recognize the cable/connector, and it is necessary to create a virtual communication port through a specific driver (software responsible for the communication between the operating system and a certain hardware). In this case, a USB input is virtually recognized as a COM port (COM1, COM2, COM3, COM4, among others), allowing data transmission by RS-232. Thus, at the purchase of the connector it must be checked whether the manufacturer provides the installation driver tool. After connecting and recognizing the cable, the Module DataCapture identifies the virtual port that will be used for data transmission.
Further additional software configurations must be made according to the specifications of each scale for correct data transmission. For serial connections, the most common configurations are data rate and parity bits. Transmission speed is the amount of bits per second transmitted from one device to another. Common transmission rates are 300, 1200, 2400, 9600, and 19200. Typically, both the sending
(scale) and data acquisition (computer) devices must be configured at the same speed.
Parity is a method of checking the data accuracy, normally being null (not used), or it can be even or odd. In the case of using null parity, the data are not modified. In even-par parity, the data are accommodated so that the number of bits 1 (i.e., its count per byte) is an even number; this is done by setting the parity bit (usually the most or least significant bits) to 0 or 1. In odd parity, the number of bits 1 is an odd number that can be used by the receiver to detect error transmission; if for example one byte is received with the wrong number of 1 bits, it must be corrupted.
Generic Driver for DB9 USB cables/connectors
Along with the software comes a folder containing the driver CH341SER of general use for DB9 USB or DB25 USB cables. The Setup.exe file must be run in administrator mode and to continue the installation procedure, the user must select the destination folder of software IPRDataCol files in the next window and click “Install”.
Depending on the configuration pattern of the purchased cable, the CH341SER driver may not establish the cable recognition bridge and release the COM virtual port. In this case, the specific driver for the cable obtained directly from the manufacturer must be used.
It should be considered that antivirus software may prevent the correct execution of the driver installer. In this case the path to the folder where the driver installation file is located must be included in the anti-virus exclusions field.
Exporting data
The yield data are exported to a *.txt format file (separating columns by tabs), where they can be imported into any spreadsheet or specific database that the user is using, simply identifying the tabs as separators of the identification columns of plots and yield.
CONCLUSION
The use of software IPRDataCol with the modules IPREtiqLF and DataCapture can contribute to minimize errors in the identification of experimental plots and data capture, especially with regard to the yield variable, since no typing step is necessary for this type of data, transmitted directly from electronic scales
REFERENCES
Abreu GB, Ferreira DF, Ramalho MAP, Toledo FHRB and Sousa Bueno Filho JS (2013) Computer simulation for the evaluation of recombination strategies in intrapopulation recurrent selection in Eucalyptus. Silvae
Genetica 1: 68-79.
Akbarpour OA, Dehghani H, Sorkhi-Lalelo B and Kang MS (2016) A SAS macro for computing statistical tests for two-way table and stability indices of nonparametric method from genotype-by-environment interaction. Acta Scientiarum: Agronomy 38: 35-50.
Bhering LL (2017) Rbio: A tool for biometric and statistical analysis using the R platform. Crop Breeding and Applied Biotechnology 17: 187-190.
Cruz CD (2013) GENES - a software package for analysis in experimental statistics and quantitative genetics. Acta Scientiarum: Agronomy
35: 271-276.
Cruz CD and Schuster I (2004) GQMOL: aplicativo computacional para
análise de dados moleculares e de suas associações com caracteres
quantitativos. versão 2.1. Available at: <http://www.ufv.br/dbg/
gqmol/gqmol.htm>. Accessed Oct on 20, 2010.
Cruz CD, Vianna JMS, Carneiro PCS and Bhering LL (2011) GBOL-Software
para ensino e aprendizagem de genética. 2nd edn, Editora UFV,
Viçosa, 326p.
Date CJ (1991) Introdução a sistemas de bancos de dados. Editora
Campus, Rio de Janeiro, 674p.
Ferreira DF (2011) SISVAR: A computer statistical analysis system. Ciência e Agrotecnologia35: 1039-1042.
Ferreira DF (2013) Estatística computacional em java. 1st edn, Editora
UFLA, Lavras, 695p.
Fritsche-Neto R and Matias FI (2016) Be-Breeder - Learning: a new tool for teaching and learning plant breeding principles. Crop Breeding and Applied Biotechnology 16: 240-245.
Mathew N and Stones R (2005) Beginning databases with PostgreSQL: From novice to professional. 2nd edn, APress, New York, 637p.
Matias FI, Granato I and Fritsche-Neto R (2018). Be-Breeder: an R/Shiny application for phenotypic data analyses in plant breeding. Crop Breeding and Applied Biotechnology 18: 241-243.
Peternelli LA (2011) Program R: applications in plant breeding. Crop Breeding and Applied Biotechnology S.1: 91-92.
Peternelli LA, Ferreira FM, Rocha RB, Barros WS and Barbosa MHP (2009) Análise dos coeficientes de endogamia e parentesco para qualquer nível de ploidia usando o pacote estatístico R. Bragantia 68: 849-855. Phenome-Networks (2016) Spreadsheets vs plant breeding software:
8 reasons why the latter is better. Available at
<http://phenome- networks.com/phenome-one/plant-breeding-software-vs-spreadsheets>. Accessed on Jan 16, 2017
Resende MDV (2016) Software Selegen-REML/BLUP: a useful tool for plant breeding. Crop Breeding and Applied Biotechnology 16: 330-339.
Rife TW and Poland JA (2014) Field book: An open-source application for field data collection on android. Crop Science 54: 1624.
Torres RJA (1998) Perspectivas e conseqüências do melhoramento genético de frango de corte. In Simpósio nacional de melhoramento animal. Universidade Federal de Viçosa, Viçosa, p. 75-80.