Repositório ISCTE-IUL
Deposited in Repositório ISCTE-IUL: 2019-05-09
Deposited version: Post-print
Peer-review status of attached file: Peer-reviewed
Citation for published item:
Vicente, P. & Lopes, I. (2015). When should I call you? An analysis of differences in demographics and responses according to respondents’ location in a mobile CATI survey. Social Science Computer Review. 33 (6), 766-778
Further information on publisher's website: 10.1177/0894439314560696
Publisher's copyright statement:
This is the peer reviewed version of the following article: Vicente, P. & Lopes, I. (2015). When should I call you? An analysis of differences in demographics and responses according to respondents’ location in a mobile CATI survey. Social Science Computer Review. 33 (6), 766-778, which has been published in final form at https://dx.doi.org/10.1177/0894439314560696. This article may be used for non-commercial purposes in accordance with the Publisher's Terms and Conditions for self-archiving.
Use policy
Creative Commons CC BY 4.0
The full-text may be used and/or reproduced, and given to third parties in any format or medium, without prior permission or charge, for personal research or study, educational, or not-for-profit purposes provided that:
• a full bibliographic reference is made to the original source • a link is made to the metadata record in the Repository • the full-text is not changed in any way
When should I call you? An analysis of differences in demographics and responses according to respondents’ location in a mobile CATI survey
Paula Vicente
Instituto Universitário de Lisboa (ISCTE-IUL), Business Research Unit (BRU-IUL)
Inês Lopes
Business Research Unit (BRU-IUL)
Abstract
Mobile phones are increasingly being used to collect social and marketing data and some say it is just a question of time before they replace fixed phones. Although there is some evidence that much of the knowledge on CATI surveys can be applied to mobile CATI
surveys, the specificities of mobile communications must be given due consideration in the design and procedures for surveys using mobile phones. This study investigates whether the location of the respondent at the time of the interview – at home or outside the home – affects sample composition and responses in a mobile CATI survey.
While findings reveal several significant distinctions between the demographic characteristics of at-home and outside-home respondents, namely sex, age, educational level, professional status and the major contributor to household income, only few differences were found in responses to behavioral and attitudinal items.
Keywords: mobile phones, CATI surveys, respondents’ location, sample composition, data quality
1. Introduction
Over the past century, survey methodologists have developed many new methods of collecting survey data. In the early 20th century, face-to-face interviews and questionnaires sent by mail were the usual methods; however, telephone surveys started being more common in the late 1960s, and had become the dominant mode for collecting survey data by the end of the century. The variety of methods and approaches to the survey process increased even further with the introduction of computers and nowadays the most common data collection methods are computer assisted: computer-assisted personal interviewing (CAPI), audio computer-assisted self-administered interviewing (ACASI), computer-assisted telephone interviewing (CATI), web surveys, interactive voice response (IVR), to mention just a few (Nathan, 2001; Couper, 2011). More recently, mobile communications technology has attracted the attention of survey researchers, with the mobile phone now being seen as a new survey instrument for both mobile CATI surveys and mobile Web surveys.
This shift to mobile phones is to a great extent due to its high coverage rates. In the EU countries, nearly 90% of the households have at least one mobile phone, and this figure exceeds 95% in countries like Sweden, Finland or Netherlands. In specific subpopulations, e.g. those under the age of 29 and people living in urbanized areas, the mobile phone has coverage rates of over 90% (European Commission, 2012). Portugal is much in line with the EU trend with 88% of the households owning at least one mobile phone (European
Commission, 2012) and more than 90% of individuals (aged 10 or more) owning or using a mobile phone (Marktest, 2012). The mobile phone coverage rate is also very high among young people (99.5% in the 25-34 years group), upper social classes (97.7% in the A/B classes) and in highly urbanized areas (95% in the Metropolitan Area of Lisbon) (Marktest, 2012).
But in addition to good coverage rates, the mobile phone also enables survey organizations to complete fieldwork quickly. A study on the time occupation of European citizens shows that most people, and specifically working people, spend a lot of time outside the home: on average European citizens travel to work between 7.30 am and 8.30 am, are at their work place between 10.30 am and 5.30 pm, and return from work between 5.30 pm and 7 pm (Eurostat, 2004). When conducting CATI surveys, this forces survey organizations to restrict calling periods to when people are more likely to be at home, i.e., evenings and weekends (Hansen, 2008). However, mobile CATI surveys can extend the calling period to times of the day when potential respondents are outside the home since the mobile phone is a personal device that people carry at all times and in all places. By enlarging the daily calling period survey organizations can reduce the number of days needed to complete the fieldwork stage of the surveys.
Moreover, the CATI systems developed for fixed phones can accommodate mobile CATI surveys as the two modes involve random dialing or the random generation of phone numbers, have teams made up of interviewers and supervisors, and require a computer and dialer technology to manage call scheduling (Kelly, Link, Petty, Hobson & Cagney, 2008). As such, survey organizations may also benefit from the investments made in CATI facilities when shifting to mobile CATI surveys.
When a new mode for survey data collection is adopted, research must always be done to determine the suitability of existing designs and procedures to this new mode. The research involving mobile CATI surveys has so far focused mainly on a comparison to CATI surveys on topics related to coverage error (e.g. Callegaro & Poggio, 2004; Keeter, Kennedy, Clark, Tompson & Mokrzycki, 2007; Vicente & Reis, 2009), sampling error (Boyle, Fleeman, Kennedy, Lewis & Weiss, 2012), data quality (e.g. Brick, Dipko, Presser, Tucker & Yuan, 2006; Witt, ZuWallack, & Conrey, 2009; Lynn & Kaminska, 2012; Jablonski, 2012), survey
feasibility (e.g. Kuusela & Simpanen, 2002; Brick, Brick, Dipko, Presser, Tucker & Yuan, 2007; Vicente, Reis & Santos, 2009; Reimer, Roth & Montgomery, 2012) and response content (e.g. Roy & Vanheuverzwyn, 2002; Dipko, Brick, Brick & Presser, 2005; Kennedy, 2007; Link, Battaglia, Frankel, Osborn & Mokdad, 2007; Lynn & Kaminska, 2011; Kühne & Häder, 2012). Although the existing research suggests that mobile CATI surveys can make use of much of the knowledge acquired about CATI surveys, the specificities of mobile phones must be given due consideration in the survey design and procedures (Steeh & Piekarski, 2008).
Mobility is one such specificity: the mobile phone is a communication device that people carry with them at all times and in all places. This may modify the ease with which potential respondents can be contacted since it gives survey organizations easier access to people who are usually hard to find at home. It is well known that population subgroups who spend a lot time away from home, namely males, people with a higher educational level, younger people and residents in large cities, are difficult to interview in CATI surveys (Shaiko, Dwyre, O’Gorman, Stonecash & Vike, 1991; Merkle, Bauman & Lavrakas, 1993; Traugott, 1987; Groves & Couper, 1998; Johnson & Cho, 2004; Eurostat, 2004); however, this problem may be overcome in mobile CATI surveys.
The mobility of the mobile phone may also change the way interviews are conducted. It is assumed in CATI surveys that all respondents are at home when being interviewed, but this may not be the case in mobile CATI surveys (Häder, 2012; Kühne & Häder, 2012). Differences in respondents’ location at the time of the interview may trigger a context effect, i.e., the question-answer process may be affected by the surroundings or interview setting (e.g. Schuman, 1992; Smyth, Dillman & Christian, 2008) and this will probably change the way respondents answer the survey. In fact, the specific circumstances and disturbances affecting respondents outside the home may make answering a mobile CATI survey a more
cognitively complex task for them than for at-home respondents. Taking a mobile phone call while driving the car, shopping or walking on the street can affect respondents' concentration and ability to provide complete and accurate answers (e.g. Krosnick, 2000; Shoemaker, Eichholz, & Skewes, 2000; Steeh & Piekarski, 2008; Häder, 2012).
Despite the increased use of the mobile phone, methodologically speaking it is still a novelty and much research must still be done to glean a better understanding of its benefits and drawbacks as a survey mode. This paper contributes to this area by investigating whether the location of the respondent at the moment of the interview affects survey outcomes in a mobile CATI survey context. Specifically, our research aims to determine whether at home- respondents and outside-home respondents are demographically equivalent subgroups and have identical behavioral and attitudinal characteristics.
2. Data and methods
Data comes from a mobile CATI survey conducted in Portugal by a well-known survey research company in 2012 to collect information on Portuguese adults' (aged ≥ 15 years) use of the mobile phone and their attitudes towards it; it used the design typically adopted by the company in studies of this size and duration.
The survey involved 1501 interviews, completed over a three-week fieldwork period. Calls were made on all days of the week, from 5 pm till 10 pm on weekdays, and from 10 am till 2 pm on weekends.
Sample selection was not list-assisted as there are no official lists of mobile phone subscribers in Portugal that can be used as a sampling frame; the sample was therefore comprised of randomly generated mobile phone numbers. Mobile phones numbers have nine digits and the first two digits identify the operator. Information from the Portuguese
phone operators in Portugal was used to stratify the population according to service operator. For each operator, mobile phone numbers were created by a generator of seven-digit random numbers, thus making the sample selection method very similar to simple random sampling.
Short questionnaires are usually recommended if the telephone is the mode of data collection because long conversations are difficult to maintain when the respondent can hang up easily (Morton-Williams, 1986). The risk of a premature end to the interview also applies to mobile phone communications, due not only to respondents hanging up but also to
technical problems such as poor network coverage or battery failure. In light of this and on the advice of the researchers of the survey company cooperating in the project, our
questionnaire was intentionally designed to be short. The questionnaire took about 16 minutes on average to be administered. It included: (1) questions about mobile phone use (18 yes/no response items and 6 open ended response items) and one question about the monthly outlay on mobile communications, (2) questions about attitudes towards mobile phones (set of 20 attitudinal items with a 4 point scale of response) and (3) questions about demographics. For methodological purposes, one question was asked before the last section on demographics to determine the respondent's location at the time of the interview, namely “Are you currently at home or elsewhere?”; an “elsewhere” response was followed by the question “Where are you?”. No information was collected about changing location during the interview.
Our analysis starts with a set of results describing survey implementation, specifically calling outcomes, time of interviews, respondents’ location and level of effort to obtain the interviews. In a second stage of analysis, at-home and outside-home respondents are compared to assess sample equivalence. Comparisons are made using logistic regression models and taking respondents’ location as the independent variable. Respondents’ location is measured by a dichotomous variable with the categories “1–at-home”, which includes all respondents interviewed in their own home, and “0–outside home”, which includes all
respondents interviewed in places such as work, on the street, in shops, etc. In a subsequent stage, we examine missing data in several items of the questionnaire. Finally, the analysis focuses on the estimates for a set of parameters concerning attitudinal and behavioral items; comparisons between at-home and outside-home respondents are based on the significance of coefficients from regression models.
3. Results
A total of 11472 mobile phone numbers were dialed, 4410 of which were not
attributed, not working, or disconnected and 314 that were found to be out-of-the-scope, i.e., the person answering the phone was aged under 15 years. Table 1 presents the outcomes of the mobile phone numbers dialed.
(Table 1 about here)
A total of 1501 interviews were completed, representing a 13.1% response rate (RR1) (AAPOR, 2006). The percentage of break-offs was only 1.5% (Table 1); the average time of interview for the break-off cases was around 7 minutes, compared with 16 minutes for those coded as completed; only 5 of the break-off cases reached the question about the respondent’s location (values not shown in the table).
Information about the time of each call and call outcomes was also available and this allowed us to analyze the distribution of calls made, interviews completed and break-offs per time shift. For the purpose of the analysis, the time of calls/interviews are organized into five time shifts: 10 am-12 noon; 12 noon-2 pm; 5 pm-7 pm; 7 pm-9 pm; 9 pm-10 pm. Table 2 presents the percentage of calls made, interviews completed and broken off on each time shift. The percentages for calls made are computed considering all call attempts made on each
mobile phone number; percentages for completed interviews are computed considering the final time shift, i.e., the shift in which the interview was obtained regardless of previous attempts.
(Table 2 about here)
The time shifts for both the distribution of calls made and the distribution of
completed interviews are very similar . The 7 pm-9 pm period is when most calls were made (31.1%) and also when most interviews were completed (34%). On the other hand, 9.9% of all the calls were made and 9.9% of the interviews obtained in the 10 am–12 noon period. The interview was most likely to be broken off between 5 pm and 9 pm (more than 30% of break-offs) and least likely in the 10 am – 12 noon time shift (only 8.3%).
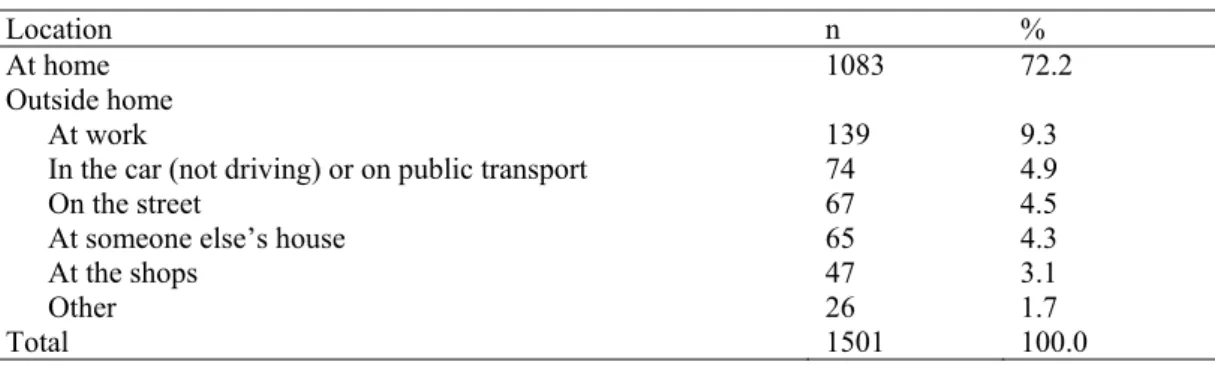
Table 3 presents the distribution of respondents' location; only the cases coded as completed interview are considered. The distribution reflects the respondent's location when being asked the question about location.
(Table 3 about here)
Most of the respondents were interviewed while they were at home (72.2%); the majority of the 418 outside-home respondents were interviewed at work (9.3%).
The respondents' location when being interviewed may be associated to the time the call is made given that the likelihood of finding someone at home is strongly linked to people’s lifestyles and varies across subgroups of the population (e.g. Eurostat, 2004).
Table 4 presents the percentage of at-home and outside-home interviews completed in each time shift.
(Table 4 about here)
A chi-square test of independence reveals a statistically significant association between time period and respondents’ location ( 2 31.28
) 4 ( =
χ , p<0.001). In all time periods,
most of the interviews were obtained at home, but the largest percentage of at-home
interviews was in the 9 pm-10 pm period (83.1%). The percentage of outside-home interviews ranged from 16.9% in the 9 pm-10 pm shift to 36.4% in the 5 pm-7 pm shift. This distribution is to a great extent coherent with the typical pattern of being at home/outside home: people are most likely to be at work/on their way home until 7 pm but tend to be at home at night (Eurostat, 2004).
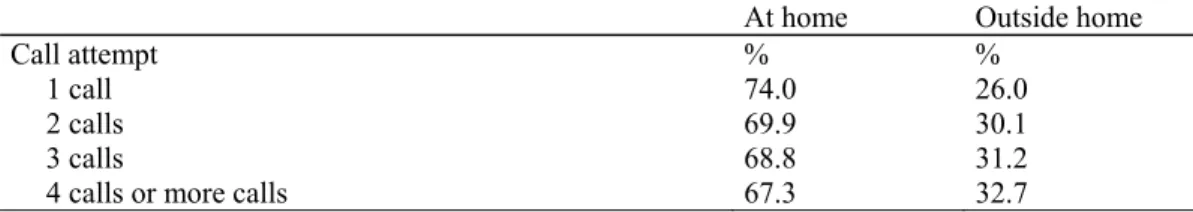
Finally, we look at the level of effort required to complete the interviews. The number of call attempts ranged from 1 to 10 in the at-home sample and from 1 to 11 in the outside- home sample. More than 50% of the interviews were obtained on the first call attempt in both response groups (values not presented in tables). For the purpose of the analysis, mobile phone numbers called 4 or more times were collapsed into a single category. Table 5 presents the percentage of at-home and outside-home interviews completed in each call attempt.
(Table 5 about here)
The chi-square test reveals a significant association between level of effort (measured by the number of call attempts) and respondents’ location (linear-by-linear test = 3.87, df=1, p<0.05). Specifically, the number of call attempts tends to rise when the location changes
from at home to outside the home. Among the interviews obtained after 4 or more call attempts, 32.7% were obtained with outside-home respondents which contrasts with the 26% of outside interviews obtained with a single call attempt.
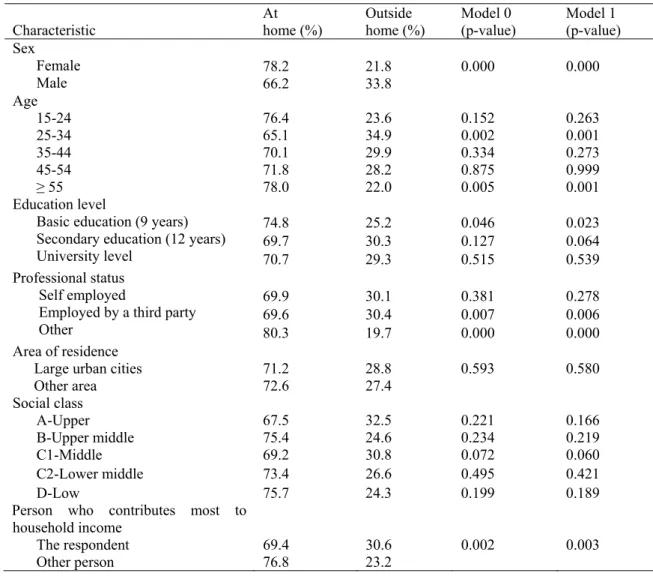
In a second stage of the analysis, we move to an evaluation of the differences between the socio-demographic characteristics of at-home and outside-home respondents. Table 6 presents the p-values of coefficient estimates from the binary logistic models considering respondents’ location as the independent variable (Model 0), and respondents’ location as the independent variable plus time period of interview as covariate (Model 1). Time period enters the model as covariate because of the association found between respondents’ location and time period (Table 4).
(Table 6 about here)
The analysis of the respondents' socio-demographic profile reveals significant differences (p<0.05) between at-home and outside-home respondents in terms of sex, age, educational level, professional status and main contributor to household income (Model 0). Compared to at-home respondents, outside home respondents were significantly more likely to be male, aged 25-34 years, employed by a third party and contribute more to household income. On the other hand, outside home respondents were less likely to be aged 55 or older, have a basic level of education or have “other” professional status (which includes retired, housewives and students).
When accounting for the effect of the time period of the interview (Model 1), at-home and outside-home respondents are also found to be significantly different in terms of sex, age, education, professional status and main contributor to household income, i.e., the same
different from at-home respondents regardless of the distinctions in the time periods of the interviews.
We now turn to response content and how data substance might vary due to respondents’ location at the time of the interview. We start by looking at item omissions before analyzing survey estimates for behavioral and attitudinal parameters.
(Table 7 about here)
As shown in Table 7, there were no item omissions in the demographic questions or in the yes/no response questions about functionalities of the mobile phone used by the
respondents, i.e., both at-home and outside- home respondents answered all these questions. In the set of open-ended response items on mobile phone usage, the percentage of items omissions reached a maximum of almost 9% for outside-home respondents compared to 5.8% for the at-home respondents. The mean value for item omissions is also slightly higher on the outside home questionnaires (4.7% vs. 4%). This might reflect difficulty in remembering the information requested about number of calls and SMS sent and received, and monthly outlay, thus making some respondents give a “don’t know” answer rather than risk giving incorrect information. In the attitudinal items, outside-home respondents have on average 0.9% of item omissions compared with 1.5% for at-home respondents.
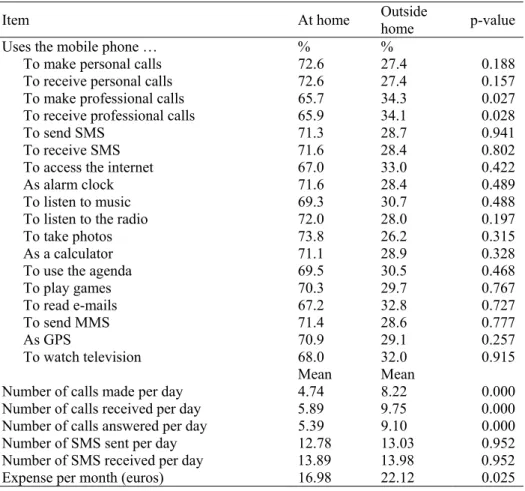
Table 8 presents the percentage of respondents using each of the 18 functionalities or services of the mobile phone, plus the mean number of calls and SMSs made or received on the mobile phone and monthly outlay for mobile phone. Binary logistic models and Ordinary Least Squares models were estimated considering respondents’ location as the independent variable and demographics – sex, age, educational level, professional status and main
contributor to household – as covariates. Table 8 presents the p-values for the differences between the two response groups.
(Table 8 about here)
Significant differences (p<0.05) were found in just 2 out the 18 mobile phone
functionalities used, namely “to receive professional calls” and “to make professional calls”. A higher percentage of outside-home respondents use the mobile phone to receive
professional calls (34.1%) and make professional calls (34.3%). Additionally, outside-home and at-home respondents differ in the mean number of calls made, received and answered daily and on the average monthly expense (p<0.05). Outside-home respondents send (mean=8.22), receive (mean=9.75) and answer (mean=9.10) more calls and spend more money (mean=22.12 Euros) on the mobile phone than at-home respondents.
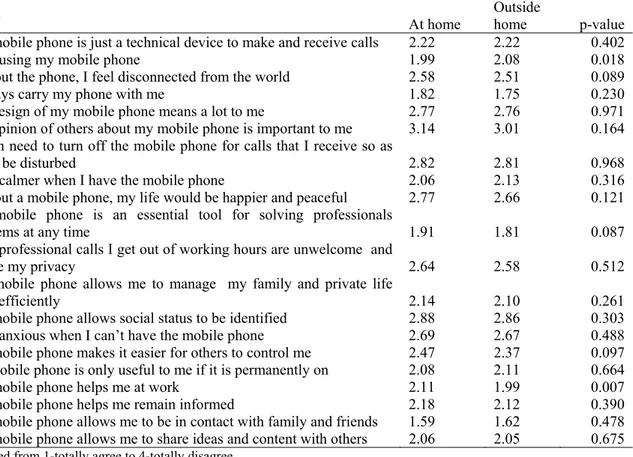
Finally, we assess the differences between at-home and outside-home respondents in response content for attitudinal items. Table 9 presents the mean estimates and the p-values from ordinal regression models for each item. The models include respondents’ location as the independent variable and demographics as covariates.
(Table 9 about here)
Significant differences (p<0.05) were found in the mean agreement scores for 2 of the 20 Likert statements on perceptions about mobile phones. Outside-home respondents agree with the statement “the mobile phone helps me at work” more strongly than at home respondents (means=1.99) and less strongly with “I like using my mobile phone” (mean=2.08).
5. Discussion and conclusion
This study examines whether the respondents’ location when being interviewed in a mobile CATI survey explains differences in sample composition and response content. Evidence was found that at-home respondents and outside-home respondents are not demographically equivalent, namely in terms of sex, age, educational level, professional status and main contributor to household income. It was found that outside-home respondents were more likely to be males, aged 25-34 years, employed by a third party and contribute more to household income than any other person in the household, and less likely to be 55 years or older, have a basic level of education or no professional occupation. The
demographic profile of outside-home respondents is to a great extent coherent with the profile of the so-called hard-to-reach people (Groves, Fowler, Couper, Lepkowski, Singer &
Tourangeau, 2004, p. 172; Montaquila, Brick, Hagedorn, Kennedy & Keeter, 2008); this shows that mobile phones help survey organizations reach specific subgroups of the
population because they make it easier to contact potential respondents when they are not at home.
Although few statistically significant differences were found in response content, we were able to identify a pattern indicating that outside-home respondents are more intensive users of their mobile phone than at-home respondents, especially for receiving and making phone calls. People who spend more time outside the home are more likely to be socially and professionally active (Groves and Couper 1998) “creating” communication needs that can be met by the mobile phone. The kind of functionalities/services used and the frequency of mobile phone usage are already known to differ across subgroups of the population: young people, those living in urban areas, and those with a professional occupation are the most intensive users of mobile phones (e.g. Glasscock & Wogalter, 2006; Ofcom, 2013). This profile is coherent with the demographics of our outside-home respondents and helps
understand why a more intensive use of the mobile phone was found among outside-home respondents.
Outside-home and at-home samples were also different in terms of time of interview – 5 pm-7 pm was the period which obtained the highest percentage of outside-home interviews. Survey organizations usually avoid 5 pm-7 pm when scheduling calls in CATI surveys due to the strong probability of not finding people at home (Eurostat, 2004). Not only are our results coherent with this idea, but they indicate that mobile phones allow survey organizations to widen the calling periods on mobile CATI surveys because with mobile phones respondents can be reached when they are not at home.
No consistent pattern of item omission was found that could be easily generalized to other surveys: at-home questionnaires had more item omissions in the attitudinal Likert scale items while outside-home questionnaires had more in the behavioral open ended questions. However, the figures for item omissions were low in both response groups (less than 10%), perhaps because respondents were asked to give their opinions and behaviors about mobile phones – as mobile phone users, this is something they were likely to know about and enjoy talking about. Additionally, questions were generally easy to answer and did not invade respondents’ privacy, which may have favored response regardless of respondents’ location.
Although not being the main focus of the investigation, we verified that the hardest-to-reach respondents, i.e., those requiring more call attempts to complete the interview, were more likely to be interviewed outside home. This is probably related to the fact that people outside the home are more likely to be engaged in activities that do not allow them to take calls immediately, which means they can only be reached through callbacks. This outcome is also a sign that although mobile phones do allow potential respondents to be called at any time, in fact people are not always available to speak on the phone.
This study was not based on a randomized experimental design. It was conducted with the standard procedures of sample selection utilized by the marketing research company conducting the survey. Despite any limitations this might have caused, it had the advantage of showing the actual distribution of the interviews according to location: the large majority of respondents – 72% – were interviewed at home and only 28% outside home. This outcome is consistent with previous reports that reveal that approximately one third of respondents of mobile CATI surveys are not at home when interviewed (e.g. Lavrakas, Tompson, Benford & Fleury, 2010; Kühne & Häder, 2012; Häder, 2012). It also indicates respondents are more likely to respond when they are at home than outside the home even though the mobile phone allows respondents to be called at any time. The “preference” for responding at home is also confirmed by the fact the highest percentage of at-home interviews (over 75%) was obtained in the after 7 pm period (on weekdays) and the morning period (10 am-12 noon) (on
weekends) when people are more likely to be at home (Table 4).
The situational context of the respondents at the time of the interview should also be addressed in research on the effect of respondents’ location . The hypothesis that a better interview can be conducted at home than outside the home may not apply if the at-home respondent is engaged in other activities while on the phone, is in a noisy environment, or within earshot of other persons. On the other hand, the outside-home respondent may be in a quiet, safe and appropriate environment to answer a survey. Our research was unable to fully explore this issue. In addition to the location question, the two following questions were included in the preliminary version of the questionnaire that was pre-tested in the preparatory stage of our survey: (1) “What are you doing at this moment?” and (2) “Are you alone or accompanied?”. However, most people in the pre-test sample saw this as an invasion of privacy so refused to answer the questions, which were therefore removed from the final version of the questionnaire. The respondents’ refusal to provide this type of information may
indicate people’s lack of familiarity with mobile CATI surveys in Portugal. Mobile CATI surveys are increasing but are still in their infancy and people are not yet used to being contacted on their mobile phones to be interviewed. The growing dissemination and popularity of mobile CATI surveys is expected to increase people's confidence and willingness to cooperate and provide information about the interview context.
As the number of mobile CATI surveys continues to rise, research on how mobile communications affects survey designs and procedures will be of growing importance. Research involving mobile CATI surveys can be expected to continue attracting the attention of survey methodologists in the near future.
Authors information
Paula Vicente is Assistant Professor at Instituto Universitário de Lisboa (ISCTE-IUL),
Department of Quantitative Methods for Management and Economics and a Researcher at the Business Research Unit – Research Methods Group (BRU-IUL). Her research interests are focused on Survey Methodology.
e-mail: pbcv@iscte.pt phone: +351 21 790 32 85
Inês Lopes is a PhD student at Instituto Universitário de Lisboa (ISCTE-IUL).
e-mail: inesislopes@gmail.com
Acknowledgements
This work received financial support from Fundação para a Ciência e Tecnologia through the PTDC/EGE-GES/116934/2010 project.
References
American Association for Public Opinion Research (AAPOR) (2006). Standard Definitions: Final Dispositions of Case Codes and Outcome Rates for Surveys. KS: Lenexa.
Boyle, J., Fleeman, A., Kennedy, C., Lewis, F., & Weiss, A. (2012). Sampling Cell Phone Only Households: A Comparison of Demographic and Behavioral Characteristics from ABS and Cell Phone Samples. Survey Practice, 5, 1-7.
Brick, J. M., Dipko, S., Presser, S., Tucker, C., & Yuan, Y. (2006). Nonresponse bias in a dual frame sample of cell and landline numbers. Public Opinion Quarterly, 70, 780-793. Brick, M., Brick, P., Dipko, S., Presser, S., Tucker, C., & Yuan, Y. (2007). Cell phone survey
feasibility in the US: sampling and calling cell numbers versus landline numbers. Public Opinion Quarterly, 71, 23-29.
Callegaro, M., & Poggio, T. (2004). Where Can I Call You?: The Mobile Phone Revolution and Its Impact on Survey Research and Coverage Error – A Discussion of the Italian Case. Paper presented at the 6th International Conference on Logic and Methodology, Amsterdam, Netherlands.
Couper, M. (2011). The future of modes of data collection. Public Opinion Quarterly, 75, 889-908.
Dipko, S., Brick, P., Brick, J., & Presser, S. (2005). An Investigation of Response Difference Between Cell Phone and Landline Interviews. Paper presented at the Annual Conference of the American Association for Public Opinion Research, Miami Beach, Florida, USA. European Commission (2012). Special Eurobarometer 381: E-communications household
survey. Available at: http://ec.europa.eu/public_opinion/archives/ebs/ebs_381_en.pdf.
Accessed 4th September 2014.
Eurostat (2004). How Europeans spend their time. Luxembourg: Office for Official Publications of the European Communities. Available at:
http://epp.eurostat.ec.europa.eu/cache/ITY_OFFPUB/KS-58-04-998/EN/KS-58-04-998-EN.PDF. Accessed 29th September 2014.
Glasscock, N. & Wogalter, M. (2006). Evaluating preferences for mobile phone features. Proceedings of the Human Factors and Ergonomics Society 50th Annual Meeting, 1259-1263. Available at:
http://www.safetyhumanfactors.org/wp-content/uploads/2011/12/291Glasscock_Wog2006.pdf. Accessed 8th October 2014.
Groves, R., & Couper, M. (1998). Nonresponse in household interview surveys. New York: Wiley.
Groves, R., Fowler, F., Jr., Couper, M., Lepkowski, J., Singer, E. & Tourangeau, R. (2004) Survey methodology. New York: Wiley.
Häder, M. (2012). Data quality in telephone surveys via mobile and landline phone. In S. Häder, M. Häder, M. Kühne (Eds.), Telephone surveys in Europe. (pp. 247-262). New York: Springer.
Hansen, S. (2008). CATI sample management systems. In J. Lepkowski, C. Tucker, J. Brick, E. de Leeuw, L. Japec, P. Lavrakas, M. Link, R. Sangster (Eds.), Advances in telephone survey methodology, (pp. 340-358). New Jersey: Wiley.
Jablonski, C. (2012). Five signs the mobile phone form factor is maxed out. Available at:
http://www.zdnet.com/blog/emergingtech/five-signs-the-mobile-phone-form-factor-is-maxed-out/3145. Accessed 8th October 2014.
Johnson, T., & Cho, Y. (2004). Understanding nonresponse mechanisms in telephone surveys, Proceedings of the Section on Survey Research Methods. American Statistical
Keeter, S., Kennedy, C., Clark, A., Tompson, T., & Mokrzycki, M. (2007). What’s Missing from National Landline RDD Surveys? The Impact of the Growing Cell-Only Population. Public Opinion Quarterly, 71, 772-792.
Kelly, J., Link, M., Petty, J., Hobson, K., & Cagney, P. (2008). Establishing a new survey research call center. In J. Lepkowski, C. Tucker, M. Brick, E. De Leeuw, L. Japec, P. J. Lavrakas, et al. (Eds.), Advances in telephone survey methodology (pp. 317-339). Hoboken, NJ: Wiley.
Kennedy, C. (2007). Assessing Measurement Error in Landline and Cell Phone RDD Surveys. Paper presented at the 32nd Annual Conference of the Midwest Association for Public Opinion Research, Chicago.
Krosnick, J. (2000). The threat of satisficing in surveys: The shortcuts respondents take in answering questions. Survey Methods Newsletter, 20, 4-8.
Kühne, M., & Häder, M. (2012). Telephone surveys via landline and mobile phones: mode effects and response quality. In S. Häder, M. Häder, M. Kühne (Eds.), Telephone surveys in Europe (pp. 229-246). New York: Springer.
Kühne, M., & Häder, M. (2012). Telephone surveys via landline and mobile phones: mode effects and response quality. In S. Häder, M. Häder, M. Kühne (Eds.), Telephone surveys in Europe (pp. 229-246). New York: Springer.
Kuusela, V., & Simpanen, M. (2002). Effects of Mobile Phones on Telephone Survey Practices and Results. Paper presented at the International Conference on Intelligent Computing, Copenhagen, Denmark.
Lavrakas, P., Tompson, T., Benford, R., & Fleury, C. (2010). Investigating Data Quality in Cell Phone Surveying. Paper presented at the 65th annual conference of the American Association for Public Opinion Research, Chicago, USA.
Link, M., Battaglia, M., Frankel, M., Osborn, L., & Mokdad, A. (2007). Reaching the U.S. Cell Phone Generation: Comparison of Cell Phone Survey Results with an Ongoing Landline Telephone Survey. Public Opinion Quarterly, 71, 814-839.
Lynn, P., & Kaminska, O. (2012). Factors affecting measurement error in mobile phone interviews, In S. Häder, M. Häder, M. Kühne (Eds.), Telephone surveys in Europe. (pp. 211-228). New York: Springer.
Marktest (2012). Posse de telemóvel nos 92% (Mobile phone ownership reaches 92%). Available at: http://www.marktest.com/wap/a/n/id~18f8.aspx. Accessed 19th September 2014.
Merkle, D., Bauman, S., & Lavrakas, P. (1993). The impact of callbacks on survey estimates in an annual RDD survey. Proceedings of the Section on Survey Research Methods. American Statistical Association, 1070-1075.
Montaquila, J., Brick, J., Hagedorn, M., Kennedy, C. & Keeter, S. (2008). Aspects of
nonresponse bias in RDD telephone surveys. In J. Lepkowski, C. Tucker, J. Brick, E. de Leeuw, L. Japec, P. Lavrakas, M. Link, R. Sangster (Eds.), Advances in telephone survey methodology, (pp. 561-586). New Jersey: Wiley.
Morton-Williams, J. (1986). Questionnaire design, In R. Worcester, J. Downham (Eds.), Consumer Market Research Handbook. (pp. 111-147). London: McGraw Hill. Nathan, G. (2001). Telesurvey methodologies for household surveys – a review and some
thoughts for the future. Survey Methodology, 27, 7-31.
Ofcom (2013) Mobile phone usage: attitudes towards mobile phone functions including reception. Available at: http://stakeholders.ofcom.org.uk/binaries/consultations/mobile-voice-data-experience/annexes/usage.pdf. Accessed 12th October 2014.
Reimer, B., Roth, V., & Montgomery, R. (2012). Optimizing call patterns for landline and cell phone surveys. Proceedings of the Section on Survey Research Methods. American Statistical Association, 4648-4660.
Roy, G., & Vanheuverzwyn, A. (2002). Mobile Phone in Sample Surveys. Paper presented at the International Conference on Intelligent Computing, Copenhagen, Denmark.
Schuman, H. (1992) Context effects: State of the Past/State of the Art. In N. Schwarz, S. Sudman (Eds.), Context Effects in Social and Psychological Research, (pp. 3-22). New York: Springer-Verlag.
Shaiko, R., Dwyre, D., O’Gorman, M., Stonecash, J., & Vike, J. (1991). Pre-election political polling and the non-response bias issue. International Journal of Public Opinion
Research, 3, 86-99.
Shoemaker, P. J., Eichholz, M., & Skewes, E. A. (2002). Item nonresponse: Distinguishing between don’t know and refuse. International Journal of Public Opinion Research, 14, 193-201.
Smyth, J., Dillman, D., & Christian, L. (2008). Context effects in internet surveys: New issues and evidence. Available at:
http://www.sesrc.wsu.edu/dillman/papers/2007/ContextEffects.pdf. Accessed 19th
September 2014.
Steeh, C., & Piekarski, L. (2008). Accommodating new technologies: mobile and VoIP communication, In J. Lepkowski, C. Tucker, J. Brick, E. de Leeuw, L. Japec, P.
Lavrakas, M. Link, R. Sangster (Eds.), Advances in telephone survey methodology, (pp. 423-448). New Jersey: Wiley.
Traugott, M. (1987). The importance of persistence in respondent selection for preelection surveys, Public Opinion Quarterly, 51, 48-57.
Vicente, P., & Reis, E. (2009). The mobile-only population in Portugal and its impact in a dual frame telephone survey, Survey Methods Research, 3, 105-111.
Vicente, P., Reis, E., & Santos, M. (2009). Using mobile phones for survey research: a comparison with fixed phones. International Journal of Market Research, 51, 613-633. Witt, L., Conrey, F., & ZuWallack, R. (2009). Out and About: An Evaluation of Data Quality
in Cell Phone Surveys. Paper presented at the 64th Annual Conference of the American Association for Public Opinion Research, Hollywood, FL.
Table 1. Outcomes for dialed numbers Outcome n % Completed interview 1501 13.1 Interview break-off 169 1.5 Noncontactg 3908 34.1 Refusals 1470 12.8
Out of the scope (aged under 15) 314 2.7
Not working, non attributed or disconnected 4110 35.8
Total 11472 100.0
gIncludes hang up without answer, busy, ring with no answer, voice-mail and temporarily unavailable (message from
the operator).
Table 2: Calls, completed interviews and break-offs by time period (%)
10 am–12 noon 12 noon-2 pm 5 pm-7 pm 7 pm-9 pm 9 pm-10 pm
Calls made 9.9 14.4 23.9 31.1 20.8
Completed interviews 9.9 14.7 23.8 34.0 17.7
Break-offs 8.3 14.8 30.8 31.4 14.8
Table 3. Respondents’ location at the moment of the interview
Location n %
At home 1083 72.2
Outside home
At work 139 9.3
In the car (not driving) or on public transport 74 4.9
On the street 67 4.5
At someone else’s house 65 4.3
At the shops 47 3.1
Other 26 1.7
Table 4. Respondents’ location and time period of the interviews (%)
Time period At home Outside home
10 am – 12 noon 75.7 24.3
12 noon – 2 pm 68.6 31.4
5 pm – 7 pm 63.6 36.4
7 pm – 9 pm 72.9 27.1
9 pm – 10 pm 83.1 16.9
Table 5. Completed interviews per call attempt and respondents’ location (%)
At home Outside home
Call attempt % %
1 call 74.0 26.0
2 calls 69.9 30.1
3 calls 68.8 31.2
Table 6. Demographic characteristics of at home and outside home respondents Characteristic At home (%) Outside home (%) Model 0 (p-value) Model 1 (p-value) Sex Female Male 78.2 21.8 0.000 0.000 66.2 33.8 Age 15-24 25-34 35-44 45-54 ≥ 55 76.4 23.6 0.152 0.263 65.1 34.9 0.002 0.001 70.1 29.9 0.334 0.273 71.8 28.2 0.875 0.999 78.0 22.0 0.005 0.001 Education level
Basic education (9 years) Secondary education (12 years) University level 74.8 25.2 0.046 0.023 69.7 30.3 0.127 0.064 70.7 29.3 0.515 0.539 Professional status Self employed
Employed by a third party Other
69.9 30.1 0.381 0.278 69.6 30.4 0.007 0.006 80.3 19.7 0.000 0.000 Area of residence
Large urban cities 71.2 28.8 0.593 0.580
Other area 72.6 27.4 Social class A-Upper 67.5 32.5 0.221 0.166 B-Upper middle 75.4 24.6 0.234 0.219 C1-Middle 69.2 30.8 0.072 0.060 C2-Lower middle 73.4 26.6 0.495 0.421 D-Low 75.7 24.3 0.199 0.189
Person who contributes most to household income
The respondent 69.4 30.6 0.002 0.003
Table 7. Item omissions by respondents’ location (%)
Item At home Outside home
Mobile phone functionalities (18 items yes/no response)
Range (%) – –
Mean (%) 0.0 0.0
Mobile phone functionalities and monthly expense(6 items open ended response)
Range (%) 2.7–5.8 2.4–8.9
Mean (%) 4.0 4.7
Likert scales (20 items)
Range (%) 0.2–6.5 0.0–4.1
Mean (%) 1.5 0.9
Demographic (7 questions)
Range (%) – –
Mean (%) 0.0 0.0
Table 8. Items of mobile phone usage by respondents’ location
Item At home Outside home p-value
Uses the mobile phone … % %
To make personal calls 72.6 27.4 0.188
To receive personal calls 72.6 27.4 0.157
To make professional calls 65.7 34.3 0.027
To receive professional calls 65.9 34.1 0.028
To send SMS 71.3 28.7 0.941
To receive SMS 71.6 28.4 0.802
To access the internet 67.0 33.0 0.422
As alarm clock 71.6 28.4 0.489
To listen to music 69.3 30.7 0.488
To listen to the radio 72.0 28.0 0.197
To take photos 73.8 26.2 0.315
As a calculator 71.1 28.9 0.328
To use the agenda 69.5 30.5 0.468
To play games 70.3 29.7 0.767 To read e-mails 67.2 32.8 0.727 To send MMS 71.4 28.6 0.777 As GPS 70.9 29.1 0.257 To watch television 68.0 32.0 0.915 Mean Mean
Number of calls made per day 4.74 8.22 0.000
Number of calls received per day 5.89 9.75 0.000
Number of calls answered per day 5.39 9.10 0.000
Number of SMS sent per day 12.78 13.03 0.952
Number of SMS received per day 13.89 13.98 0.952
Table 9. Mean values of extent of agreement with attitudinal statements about mobile phones by respondents’
location
Item g At home Outside home p-value
The mobile phone is just a technical device to make and receive calls 2.22 2.22 0.402
I like using my mobile phone 1.99 2.08 0.018
Without the phone, I feel disconnected from the world 2.58 2.51 0.089
I always carry my phone with me 1.82 1.75 0.230
The design of my mobile phone means a lot to me 2.77 2.76 0.971
The opinion of others about my mobile phone is important to me 3.14 3.01 0.164 I often need to turn off the mobile phone for calls that I receive so as
not to be disturbed 2.82 2.81 0.968
I feel calmer when I have the mobile phone 2.06 2.13 0.316
Without a mobile phone, my life would be happier and peaceful 2.77 2.66 0.121 My mobile phone is an essential tool for solving professionals
problems at any time 1.91 1.81 0.087
Most professional calls I get out of working hours are unwelcome and
invade my privacy 2.64 2.58 0.512
The mobile phone allows me to manage my family and private life
more efficiently 2.14 2.10 0.261
The mobile phone allows social status to be identified 2.88 2.86 0.303
I feel anxious when I can’t have the mobile phone 2.69 2.67 0.488
The mobile phone makes it easier for others to control me 2.47 2.37 0.097 My mobile phone is only useful to me if it is permanently on 2.08 2.11 0.664
The mobile phone helps me at work 2.11 1.99 0.007
The mobile phone helps me remain informed 2.18 2.12 0.390
The mobile phone allows me to be in contact with family and friends 1.59 1.62 0.478 The mobile phone allows me to share ideas and content with others 2.06 2.05 0.675