Abstract— The femtocell concept aims to combine fixed-line broadband access with mobile telephony using the deployment of low-cost, low-power third and fourth generation base stations in the subscribers' homes. While the self-configuration of femtocells is a plus, it can limit the quality of service (QoS) for the users and reduce the efficiency of the network, based on outdated allocation parameters such as signal power level. To this end, this paper presents a proposal for optimized allocation of users on a co-channel macro-femto network, that enable self-configuration and public access, aiming to maximize the quality of service of applications and using more efficiently the available energy, seeking the concept of Green networking. Thus, when the user needs to connect to make a voice or a data call, the mobile phone has to decide which network to connect, using the information of number of connections, the QoS parameters (packet loss and throughput) and the signal power level of each network. For this purpose, the system is modeled as a Markov Decision Process, which is formulated to obtain an optimal policy that can be applied on the mobile phone. The policy created is flexible, allowing different analyzes, and adaptive to the specific characteristics defined by the telephone company. The results show that compared to traditional QoS approaches, the policy proposed here can improve energy efficiency by up to 10%.
Index Terms— Femtocell, Green Network, Markov Decision Process, Optimized Allocation, Quality of Service.
I. INTRODUCTION
Studies conducted in recent years have revealed the explosive growth of wireless communications raised by technological advances in the telecommunication industry. The low price of the wireless terminals has also strongly contributed to the growth of the number of users. However, one of the main agents that have helped to increase the number of users is the ubiquitous wireless access to voice and data services. The use of mobile phones is a good example, now widespread in several layers of society. Data released from ANATEL (Telecommunication Regulating Agency in Brazil) indicate that Brazil ended the month of December 2011, with 242.2 million mobile phones and a density of 123.87
Green-Markov models - new optimization
strategies: a case study for user allocation in
co-channel macro/femto networks
Diego L. Cardoso, Adamo L. de Santana, Marcelino S. da Silva, Carlos R. L. Francês, João C. W. A. Costa
Laboratory of High Performance Networks Planning, Federal University of Para, Augusto Correa Street, 01, CO 479 Brazil,{diego,adamo,marcelino,rfrances,jweyl}@ufpa.br
Solon V. de Carvalho, N. L. Vijaykumar
mobile phones per 100 inhabitants [1].
In this respect, femtocell technology obtained much attention from researchers, especially focusing on how it can be used to improve voice services in coverage limited locations [2]. In addition, broadband data services are an increasingly significant source and percentage of the mobile operator’s business. For this purpose, femtocells have a strong potential to improve the capacity of the next generation wireless systems since they offer better link qualities and wider spectrum resources for connected users.
Scheduling in femtocell networks involves more complications due to involvement of multiple (typically co-channel) small-size cells, as well as the macro-cell. Besides, associating users to appropriate frequency bands for achieving high capacity and fairness, intelligent assignment of users to different cells is also required. In co-channel femtocell deployments, femtocells and macrocells are assigned the same spectrum, creating co-channel interference to each other. Moreover, there may be load imbalances in neighboring femtocells, where a certain femtocell may have significantly larger number of users compared to other femtocells in the vicinity. These unique problems in femtocell networks require intelligent scheduling algorithms that can present a good compromise between maximization of the fairness and the sum-rate [3].
This problem becomes more complex when the battery consumption of client nodes and the QoS (Quality of Service) requirements are considered to decide in which cell the client should connect. Traditionally, the decision is based on the signal power (connect to the cell with higher signal power, whether it is a macro cell or femtocell) without considering if the output meets the minimum QoS requirements.
The energy efficiency problem have obtained much attention in the last years, especially because of the rapid growth of energy consumption by user and network devices; for instance, the greenhouse effect has become increasingly severe, which is mainly caused by the excessive emission of Carbon dioxide (CO2) since last century[4].
According to [5], 57% of the energy consumption of the Information and Communication Technology industry (ICT) is attributed to users and network devices in mobile and wireless networks, the scale of which is still growing explosively.
This proposal also targets to achieve the concept of Green Networking, which is the practice of selecting energy-efficient networking technologies and products, and minimizing resource use whenever possible [6]. It should be noted that maximizing the energy efficiency of the nodes is a key factor, however this is not the only one that should be considered; the maximization of user satisfaction should also be pursued.
In such context, planning for the allocation of users by operators in their cells, macro or femto, carries critical importance for minimizing interference, maximizing the system capacity, achieving fairness in femtocell networks and maximizing network utilization [3].
conventional cellular architectures. For example, [7] aims to maximize the sum-rate of all the users within a cellular network; however, fairness issues have not been considered. A maximum fairness technique has been discussed in [8], which essentially tries to maximize the capacity of the user that has the lowest data rate and achieve similar data rates for all users. In [9], a capacity-maximizing power control and scheduling approach has been considered for neighboring femtocell networks; however, fairness perspectives have not been considered.
In terms of capacity overflow, some architectures and schedulers have been proposed. In [10] and [11], models based on Markov-modulated Poisson Process (MMPP) were employed for representing multiservice overflow traffic. However, extensive computations are required by a MMPP method to solve multi-dimensional Markov chains for large-scale systems.
Green communication techniques in mobile networks have been intensively studied across academia and industry. Some examples are [12], where it they propose power-saving scheduling of base stations (BS) considering QoS requirements (delay and jitter) of the real-time communications in WiMAX network. Also in [13] several radio management scheduling algorithms are evaluated for the LTE (Long Term Evolution) BS, and effectively explores multi-user diversity in the time, frequency and space domains for LTE networks. However literature in the area focused mainly on the energy efficiency of macro cells and core network, without much attention devoted to maximizing the use of battery of client nodes, considering aspects of QoS and signal level.
Due to the necessity of investigating the feasibility of providing QoS to guarantee minimum resources in Macro/femto networks, a Markov Decision Process has been developed to calculate the optimal policy for allocation of voice and data calls. Some traditional QoS parameters (throughput and packet losses) are used to compute the optimal policy. Moreover, always seeking the concept of green networking, the energy consumption is included as a parameter to be optimized.
This paper is organized as follows. In Sections II and III, the femtocell and Markovian Models concepts are explained. In Section IV, the analytical model of optimal allocation in macro/femto networks in 4G technology is shown. A validation process is presented in Section V, ensuring the reliability and efficiency of the model. The numerical results are presented in Section VI. Finally, Section VII shows the final remarks of this work.
II. FEMTOCELL
This technology creates a bridge between mobile user and the operator's macro-network using the (personal or enterprise) wired networks, that is a high speed Internet connection. Doing this, it is easier to extend access to mobile network, providing better coverage for the population (especially in areas where there is no signal or there is just a weak signal), and providing high throughput to users.
Femtocells are typically installed by non-expert users that do not consider the network’s performance; simply connecting a Femtocell Acess Point to their personal Internet connection (e.g, using DSL (Digital Subscriber Line) or HFC (Hybrid Fiber-Coaxial) technology) and turning it on. Femtocell Acess point self-organizes its radio and system operational parameters [14][15]. The node client automatically tries to associate the Femtocell Acess Point with strongest signal, however this choice becomes unfair in two aspects:
1. Considering the capacity of the Femtocell Access Point, which can become overcrowded and cannot serve new users, maintaining the quality of service. This can lead to an unbalanced load, overloading a femtocell against each other;
2. Given the choice of allocation by the customer, the network setting only by the signal power level may not meet the quality requirements of the user, which could obtain a better service through another network near, even at a higher cost battery. This fact is aggravated when considering the diversity of existing applications, which have different requirements for quality of service.
III. MARKOV DECISION PROCESS
Markov Decision Process (MDP) is a mathematical tool used to analyze reactive complex systems to define the optimal control policy that minimizes the system’s operational cost (or maximize the rewards).
In this paper, the problem is formulated as a Continuous Time MDP (CTMDP), since it considers that the times (between requests arrival and that a request stays in the system) follow an exponential probability distribution. Also, the problem is formulated as an Infinite Horizon problem, since it can perform for a long, undefined period of time.
Briefly, to model a problem as a CTMDP, it is necessary to define [16]:
•The state space S: the set of all possible conditions (states) of the system (as the number of
requests of each kind of application in each cell);
•Sets of actions {A(s) | s ∈ S}: for each state s∈S, there is a set of possible actions A(s), in
which the operator must choose a single action at every decision time;
•A set of costs {c(s, a) | s∈S, a∈A(s)}: where c(s, a) is the cost entailed to the system when it
is in state s∈S and a action a∈A(s) is chosen;
•A set of transitions probabilities {psz(a)| s,z∈S, a∈A(s)}: where psz(a) is the probability that, in
it is in the state s∈S;
•{τ(s,a)| s∈S, a∈A(s)}: expected time until the next decision time if the action a∈A(s) is
chosen in state s∈S.
Using these five elements, the stationary optimal policy R* that minimizes the long-run average cost per time unit can be calculated. For this purpose, there are some classical techniques that can be used, e.g. Value Iteration Algorithm, Policy Iteration Algorithm and Linear Programming [17].
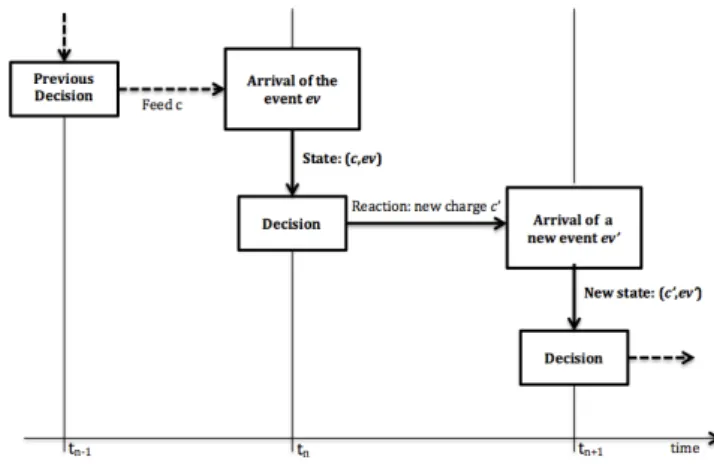
Figure 1 shows a diagram representing the transition of states as a time dependent function. An event occurs in a given time tn; after this event, the system’s state then changes and, simultaneously, a
decision is made. Between the instants tn and tn+1, system behavior will depend on the state and the
decision taken in tn. In tn+1 a new event that changes the system’s state occurs and the process restarts.
The optimal policy calculated indicates which decision (action to be chosen) should be taken at each instant of time (tn-1, tn, tn+1, and so on); this decision will be stationary and depend only on the state of
system.
Fig. 1. Diagram representation of the state transition over time
IV. MODEL DEVELOPED
A. Network Architectures and Traffic Assumptions
A typical femto-macro mobile network, with cells providing wireless access for mobile users through macrocell or femtocell access points, is assumed. The architecture used is shown in Figure 2.
The arrivals of calls can be answered by both networks, which have different distances for the mobile nodes, different throughput, different losses and different number of maximum users that can be connected.
When a new call arrives to the system, parameters such as the energy consumption when connected, the available throughput and packet loss probability of each networks, are used to decide which network should be chosen to serve the call. If new calls are blocked due to capacity limitation, they overflow to the other network for possible service.
with parameters vn and dn, for voice and data respectively; where n indicates if the request is to
connect to macrocell (n=m) or femtocell (n=f) or if it is a request that have to be decided to which cell it should connect (n=u).
The service times of voice calls and data packets follow exponential distributions with parameters 1/ vn and 1/ dn, respectively. Also, there is no differentiation between voice and data channels.
It is important to clarify that the system is modeled as observed by the user. So, when the user needs to connect to make a voice or a data call, the mobile phone has to decide to which network to connect, using the information of number of connections, the quality of service parameters and the signal power level of each network. The signal power level can be obtained directly, but the other variables need to be inquired to the system.
Fig. 2. Typical macro-femto scenario that is being taken into consideration
B. Problem Formulation
The objective of the Markov model proposed is to obtain, based on the system’s state s∈S, a control policy that determines, whenever two separate networks (one femto and another macro) are eligible for connecting, to which network the mobile user must connect. This must take into consideration minimizing the medium and long term cost incurred in the system due to the energy consumed, losses in transmission and low throughput.
events are:
•the voice calls arrival rates in macrocell and femtocell - vm and vf, respectively;
•the data calls arrival rates in macrocell and femtocell - dm and df, respectively;
•the user arrival rates for voice and data – vu and du respectively;
•the service rates of voice calls in macrocell, femtocell and that was allocated by the user –
vm, vf, vu, respectively;
•the service rates of data requests in macrocell, femtocell and that was allocated by the user –
d1, d2, du, respectively.
In order to describe the state space S of the system, seven parameters of the system have to be observed:
•vm: the number of voice connections on macrocell;
•dm: the number of data connections on macrocell;
•vf: the number of voice connections on femtocell;
•df: the number of data connections on femtocell;
•c: if the user is disconnected (disc) or connected to a macrocell (cm) or femtocell (cf);
•k: the type of applications, voice or data or disc (disconnected); •ev: the last event waiting for a decision.
Using theses parameters, each state s∈S is defined as 7-tuple:
s=(vm,dm,vf,df,c,k,ev)
subjectto
vm, dm∈{0, 1, 2, ..., MaxCRm}
vf, df∈{0, 1, 2, ..., MaxCRf}
c∈ {disc, cm, cf}
k∈ {disc, VOICE, DATA}
ev∈ {λvm, λdm, λvf, λdf, λvu, λdu, μvm, μdm, μvf, μdf, μvu, μdu}
vm+dm≤MaxCRm
vf+df≤MaxCRf
if c=disc then k=disc
if c≠disc then k=voiceORdata
if ev=μvmthen (vm=1 AND (c=discORc=cf ORk=data)) ORvm>1
if ev=μdmthen (dm=1 AND (c=discORc=cf ORk=voice)) ORdm>1
if ev=μvf then (vf=1 AND (c=discORc=cmORk=data)) ORvf>1
if ev=μdf then (df=1 AND (c=discORc=cmORk=voice)) ORdf>1
if c≠disc thenev∈{λvu, λdu}
if c=cmANDk=voicethenvm>0
if c=cmANDk=datathendm>0
if c=cf ANDk=voicethenvf>0
if c=cf ANDk=datathendf>0
if ev=μvuthenk=voice
if ev=μduthenk=data
MaxCRm and MaxCRf are the maximum number of connections in the macrocell and femtocell,
respectively.
The optimal policy to be calculated has to decide to which network the mobile phone has to connect when a voice or data call is requested (events vu and du). Observe that the optimal policy will be in
the mobile phone, so an action (reject or connect in femto or connect in macro) can be chosen for each call requested from the same mobile phone (events vu and du), but it cannot choose an action for
other mobile phones (events vm, vf, dm and df). Also, for the events vm, vf, vu, and du the only
possible choice is accept the event, since they denote the end of the services. So, The set of possible
actions A(s) for each state s∈S is defined as: A(vm,dm,vf,df,c,k,ev)=
{accept} if ev∉{λvu, λdu}
{connectonmacro,
connecton femto} if ev∈{λvu, λdu} AND (vm+dm<MaxCRm) AND (vf+df<MaxCRf)
{connectonmacro} if ev∈{λvu, λdu} AND (vm+dm<MaxCRm) AND (vf+df=MaxCRf)
{connecton femto} if ev∈{λvu, λdu} AND (vm+dm=MaxCRm) AND (vf+df<MaxCRf)
{reject} if ev∈{λvu, λdu} AND (vm+dm=MaxCRm) AND (vf+df=MaxCRf)
⎧ ⎨ ⎪ ⎪ ⎪ ⎪⎪ ⎩ ⎪ ⎪ ⎪ ⎪ ⎪ (2)
From the definition of the state space and possible actions for each state, we can define all possible
transitions that take the system from a given state sf∈S to a state st∈S, when an action a is chosen. For
this purpose, the information contained in Tables I and II are used.
First, the system’s current state (sf) is verified; from the element ev of sf, an action a∈A(sf) is
selected, according to the definition in equation (2); with these two pieces of information, the characteristic that indicates which states can be reached from sf, when action a is selected, are
determined. This procedure is summarized in Table I.
TABLE I.CURRENT STATE, ACTION SELECTED AND CHARACTERISTIC OF SUCCESSOR STATES.
State (st) Action (a)
Characteristic of the Successor States (sf)
vm, dm, vf, df, c, k, ev= vm accept vm+1, dm, vf, df, c, k, ev=?
vm, dm, vf, df, c, k, ev= dm accept vm, dm+1, vf, df, c, k, ev=?
vm, dm, vf, df, c, k, ev= vf accept vm, dm, vf+1, df, c, k, ev=?
vm, dm, vf, df, c, k, ev= df accept vm, dm, vf, df+1, c, k, ev=?
vm, dm, vf, df, c=disc, k=disc, ev= vu
reject vm, dm, vf, df, c=disc, k=disc, ev=? connect on macro vm+1, dm, vf, df, c=cm, k=voice, ev=? connect on femto vm, dm, vf+1, df, c=cf, k=voice, ev=?
vm, dm, vf, df, c=disc, k=disc, ev= du
reject vm, dm, vf, df, c=disc, k=disc, ev=? connect on macro vm, dm+1, vf, df, c=cm, k=data, ev=? connect on femto vm, dm, vf, df+1, c=cf, k=data, ev=?
vm, dm, vf, df, c, k, ev= vm accept vm-1, dm, vf, df, c, k, ev=?
vm, dm, vf, df, c, k, ev= dm accept vm, dm-1, vf, df, c, k, ev=?
vm, dm, vf, df, c, k, ev= vf accept vm, dm, vf-1, df, c, k, ev=?
vm, dm, vf, df, c, k, ev= df accept vm, dm, vf, df-1, c, k, ev=?
vm, dm, vf, df, c=cm, k=voice, ev= vu accept vm-1, dm, vf, df, c, k, ev=?
vm, dm, vf, df, c=cm, k=data, ev= du accept vm, dm-1, vf, df, c, k, ev=?
vm, dm, vf, df, c=cf, k=voice, ev= vu accept vm, dm, vf-1, df, c, k, ev=?
Next, Table II is consulted to identify all possible states that can be reached from sf; Thus, the
successor state st will present the charactceristic shown in Table I, with the element ev corresponding
to the event responsible for taking the system from sf to st,
TABLE II.POSSIBLE EVENTS AND CONDITIONS FOR THESE EVENTS TO OCCUR.
Possible Event
Condition for the Event
vm vm+dm<MAXCm
dm vm+dm<MAXCm
vf vf+df<MAXCf
df Vf+df<MAXCf
vu c=desc
du c=desc
vm (vm=1 AND(c=dis OR c=cf OR k=data)) OR vm>1
vf (vf=1 AND(c=dis OR c=cm OR k=data)) OR vf>1
dm (dm=1 AND(c=dis OR c=cf OR k=voice)) OR dm>1
df (df=1 AND(c=dis OR c=cm OR k=voice)) OR df>1
vu k=voice du k=data
As an example, consider the current state of the system sf=(0, 1, 1,0, disc, disc, vu), then, referring
to equation (2), the set of possible actions is A(sf)={connect on macro, connect on femto}. If action
a=connect on macro is selected, observing Table I, the possible successor states have the characteristic (1, 1, 1, 0, cm, voice, ?). From this point, it can be seen from Table II that the possible
events are:
• vm, which leads the system to state st=(1, 1, 1, 0, cm, voice, vm);
• dm, which leads the system to state st=(1, 1, 1, 0, cm, voice, dm);
• vf, leading to state st=(1, 1, 1, 0, cm, voice, vf);
• df,, leading the system to state st=(1, 1, 1, 0, cm, voice, df);
• dm, which leads the system to state st=(1, 1, 1, 0, cm, voice, dm);
• vf, which leads to state st=(1, 1, 1, 0, cm, voice, vf);
• and v, which leads to state st=(1, 1, 1, 0, cm, voice, vu).
Since all events considered in this work represent Poisson processes, we can calculate the total output rate of each state sf, when action a is selected, as:
Λ
sf
(
a
)
=
Λ
sfst(
a
)
st∈S
st≠sf
∑
(3)where
Λ
sfst
(
a
)
is the transition rate from state sf to state st when action a is selected, given by the corresponding event. And the transition probability is calculated as:p
sfst(
a
)
=
Λ
sfst(
a
)
Λ
sf(
a
)
(4)
τ
sf(
a
)
=
1
Λ
sf(
a
)
(5)
The costs entailed to the system when it is in state sf and the action a is chosen can be computed as
the sum of three parts: (1) the consumption multiplied by the energy cost; (2) the loss multiplied by its cost; and (3) the cost entailed when the system transmits with a low throughput.
c
(
s
f,
a
)
=
energyCons
×
energyCost
×
τ
sf(
a
)
+
loss
×
lossCost
×
τ
sf(
a
)
+
throughputCost
×
τ
sf(
a
)
(6)
where:
•energyCons is the energy consumption and can be energyConsm or energyConsf when
connected to macrocell or femtocell, respectively;
•energyCost is the energy cost and can be energyCostm or energyCostf when connected to
macrocell or femtocell, respectively;
•loss is the probability of a packet loss and can be lossm or lossf when connected to macrocell
or femtocell, respectively;
•lossCost is the energy cost and can be lossCostm or lossCostf when connected to macrocell or
femtocell, respectively;
•throughputCost is the cost to transmit with reduced throughput.
The first two terms of the sum of the cost depends on the application (voice or data) and the network (macro or Femto) to which it is connected. The third element will be computed when the total throughput required by all the network’s applications is greater than the network’s capacity.
To obtain the policy that maximizes the expected return of the proposed system in the long term (optimal policy), the Iteration Values Algorithm [17] was used; and, to obtain the steady-state probabilities, i.e. the proportion of time the system spends in each state under the optimal policy, the Sucessive Overrelaxation (SOR) [17] was used.
V. VALIDATION
The validation process ensures that the model is running the way it was planned and targeted. Therefore, the model was validated to ensure its reliability and efficiency, enabling the analysis and investigation of several scenarios that may occur (changes in entrance arrival and service time for the both traffic classes, number of users, network capacity, defined costs, etc.). In this direction, three scenarios were implemented. In all these scenarios, the network parameters used were maintained, changing only the costs associated with the attribute that is to be minimized.
associated with this parameter is set to value 1 while all others costs are set to value 0. So, three scenarios were analyzed where just one parameter is considered for each scenario. Next, we describe all the three scenarios used in the process of model validation.
TABLE III. PARAMETERS AND NUMERICAL VALUES
Parameter Value
MaxCRm 10 connections
MaxCRf 5 connections
energyConsm 10.8 J
energyConsf 7.6 J
lossm 0.5 %
lossf 2 %
Macrocell data rate 1 Mbits/s
Femtocell data rate 5 Mbits/s
Voice application data rate 12.2 kbytes/s Data application data rate 144 kbytes/s
λv1 2 requests/s
λd1 10 requests/s
λv2 1 request/s
λd2 5 requests/s
λvu 0.5 requests/s
λdu 1 request/s
μv1 = μv2 = μvu 0.25 requests/s
μd1 = μd2 = μdu 2 requests/s
A. Scenarios
(a) First scenario (SCEN1): it aims to minimize energy consumption (search network with higher signal strength, thereby minimizing power consumption in transmission). This scenario is the closest to the traditionally implemented by the telephone operators. (b) Second scenario (SCEN2): The aim is to prioritize the network with the highest available throughput, maximizing its utilization. Only the value of the cost associated with the throughput is set to 1. (c) Third scenario (SCEN3): The network that offers better quality of service was prioritized, which in the model proposed here, is restricted to network with less package loss. This scenario seeks a higher Quality of Service (QoS) offered to the user. This approach is important because of the requirements by interactive applications, for example, the voice application, which has a higher sensitivity to the adversities of the network (end-to-end delay, package loss, throughput, jitter, etc.). Table IV shows all the parameters used in the three scenarios.
TABLE IV. PARAMETERS AND NUMERICAL VALUES
Parameter SCEN1 SCEN2 SCEN3 energyCost 1 0 0 lossCostv 0 0 1
lossCostd 0 0 0
throughputCostv 0 1 0
throughputCostd 0 0 0
B. Results
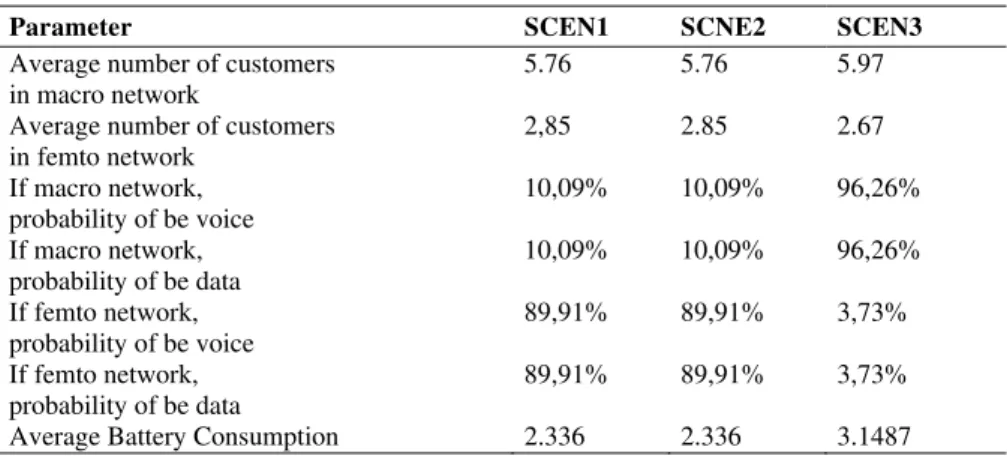
TABLE V. PARAMETERS AND NUMERICAL VALUES
Parameter SCEN1 SCNE2 SCEN3
Average number of customers in macro network
5.76 5.76 5.97
Average number of customers in femto network
2,85 2.85 2.67
If macro network, probability of be voice
10,09% 10,09% 96,26%
If macro network, probability of be data
10,09% 10,09% 96,26%
If femto network, probability of be voice
89,91% 89,91% 3,73%
If femto network, probability of be data
89,91% 89,91% 3,73%
Average Battery Consumption 2.336 2.336 3.1487
It can be seen that the behavior of SCEN1 and SCEN2 are equivalent, which was expected, since in both cases, the femtocell network has the preferred attributes, which are superior signal strength and larger throughput. In these cases, approximately 89.91% of the requests were directed to this network, and after being completely full, the rest of the traffic, accounting for 10% of the total, were directed to macrocell network.
In SCEN3, the behavior was reversed, since most of the connections were directed to the macro network, corresponding to 96.26%. Decision justified by the characteristics attributed to her, that is have a smaller percentage of loss (0.5%) than the femtocell network (2%). The rest of the traffic was directed to femtocell network.
Another point worth highlighting is the cost of energy. The first 2 scenarios yielded the same value of consumption, because both scenarios are pointing toward the same output. In SCEN3, the output was chosen as the macro network, with an increase of 25.79% in power consumption. This is due to the macrocell to be more distant, causing higher energy costs for transmission.
In all scenarios, the model behaved as expected, without generating erroneous cases, showing that in addition to the reliability, the approach proposed here is flexible, allowing different analyzes and case studies.
VI. RESULTS
Table VI shows the costs used to perform the experiments to analyze the structure of the optimal policy.
TABLE VI.COSTS AND NUMERICAL VALUES
Parameter Value energyCost 20 lossCostv 40 – 70
lossCostd 20
throughputCostv 70
Observe that the costs are dimensionless, since for losses and throughput overhead it is not possible to define monetary costs. These costs are used to weigh which parameter is more critical than the others.
In this paper, the energy cost was set to 20, while the cost for voice losses was set for a value between 40 and 70. However, it is important to note that the energy cost will be multiplied by the value of energy consumption and the losses cost will be multiplied by the amount of loss observed. The total weight for energy sums to 216 for the macrocell and 152 for the femtocell, while the total weight for losses on voice connections will be a value between 80 and 140. The same analysis can be performed for other costs, which shows that the energy has been used as the most critical parameter.
Analyzing the optimal policy, it is observed that when the voice loss cost is 40 (lower value) all requests from the user (voice or data) should be serviced by the femtocell; only when the femtocell is full the requests should be serviced by macrocell.
Increasing the loss cost it is observed that the data connections should be serviced by the femtocell and the voice calls should be serviced according to the femtocell congestion. While the congestion is low, the connection to femtocell is preferred, otherwise, connection to macrocell is preferred.
For a loss cost of 70 (the highest value observed) the optimal policy indicates that voice and data should be connected to macrocell. Only for congestion exceeding 80% the data requests should be serviced by femtocel.
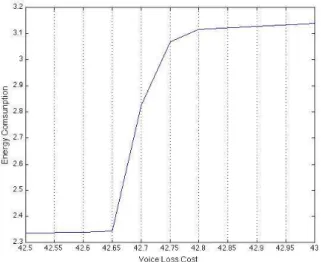
Increasing the loss cost means reducing the battery consumption importance. However, Figure 3 shows that the average battery consumption has a limit, increasing up to 25,82%. Figure 3 displays the behaviour of variable lossCostv in the interval between 42 and 43, when a significant change in the
power consumption is observed.
Fig. 3. Average battery consumption X voice loss cost.
In the scenario presented, with the loss of voice at a cost of 40, their level of importance in the total cost is lower, making voice and data traffic to be served by femto network. However with the growth of lossCostv, the importance of this variable factor in the total cost becomes higher, making the
connections have a higher probability of being destined to the macro network.
This approach allows mobile operators to define optimal cost by analyzing different scenarios and therefore to structure their network and/or performing load balancing of users to meet the requirements stipulated, especially, anticipating the problems as blocking network, for example.
Fig. 4. lossCostv behavior.
Figure 4 shows that it is possible to divide the calls for each network according to the cost given to the voice loss. Moreover, it is observed that when the value of 42.7 is assigned as the cost for voice loss, the call flows for each network are closer. For this reason, a new scenario is made setting the cost of voice loss at 42.7, named as SCEN4, to obtain a more detailed analysis, comparing it with the scenario 1 of validation (SCEN1), which characterizes the typical situation where only the intensity of the received signal is observed; and with the scenario 3 of validation (SCEN3), which characterizes the search for the network with minimum data loss. Table VII presents the results for these three scenarios.
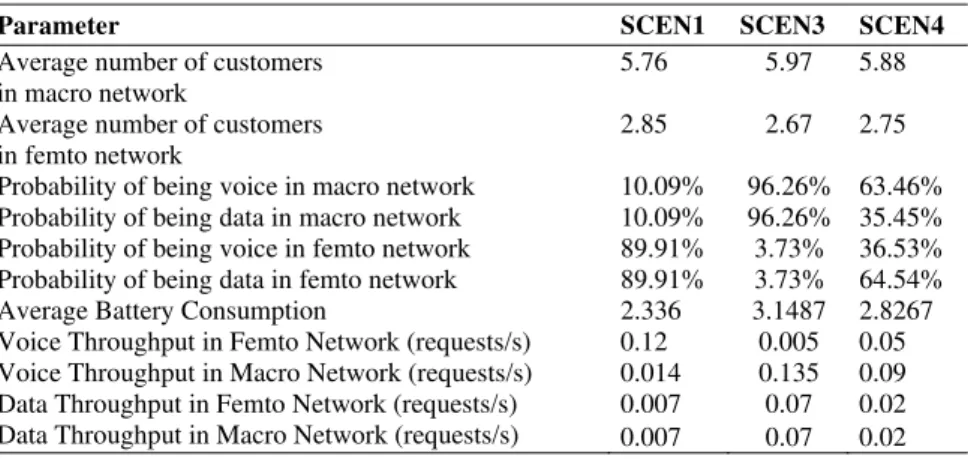
TABLE VII. PARAMETERS AND NUMERICAL VALUES
Parameter SCEN1 SCEN3 SCEN4
Average number of customers in macro network
5.76 5.97 5.88
Average number of customers in femto network
2.85 2.67 2.75
Probability of being voice in macro network 10.09% 96.26% 63.46%
Probability of being data in macro network 10.09% 96.26% 35.45%
Probability of being voice in femto network 89.91% 3.73% 36.53%
Probability of being data in femto network 89.91% 3.73% 64.54%
Average Battery Consumption 2.336 3.1487 2.8267
Voice Throughput in Femto Network (requests/s) 0.12 0.005 0.05 Voice Throughput in Macro Network (requests/s) 0.014 0.135 0.09
Data Throughput in Femto Network (requests/s) 0.007 0.07 0.02
When analyzed in terms of energy efficiency, the scenario SCEN4 achieves an increase of 21% in the consumption when compared with SCEN1, however when compared with SCEN3, it was obtained a reduction of approximately 10.22% in the energy consumption.
Considering the load distribution in SCEN4, it is observed that about 64% of voice calls are serviced by the macro network, which because of its lower rate of loss (of 0.5%), can serve with satisfaction the vast majority of users. Only a small percentage, approximately 35% (SCEN4) will be serviced by the femto network, which due to its 2% packet loss, it can create dissatisfaction among users, since the voice application tolerate losses at most 1% [18]. With respect to data traffic, it is observed an inversion of the result. This type of application use error correction protocols and retransmission of packets, and consequently, can tolerate data loss. Furthermore, the femto network has a higher throughput, allowing better data rates and thereby reducing the time for data transmission.
As emphasized earlier, the optimal police proposed is able to maintain a higher level of quality of service offered to users while it minimizes the energy consumption. This fact shows that the approach proposed here attempts to balance these two concepts, the Green Network and Quality of Service.
VII. CONCLUSIONS
Femtocells enable a coverage increase with a less load on the macrocells, thus relieving the mobile network, which was not initially developed for data traffic and is currently overloaded. However, the optimal allocation of available users between cells (macro or femto) is still an open problem.
The problem becomes even more complex when considering the energy efficiency of the batteries at client nodes, without affecting the quality of service offered.
Through an optimized allocation, this work sought to provide users the minimum levels of service quality, maximizing battery lifetime at client node. However, one must consider that the traffic used (voice and data) have specific characteristics (such as throughput, minimum levels of QoS, transmission cost), which generates different behavior at the time of transmission.
It can be seen, from the results, that voice connections should be designed to macrocells, which, despite having smaller bandwidths, can meet a higher number of voice calls, have a greater coverage area and lower levels of loss (due to congestion and interference). The data traffic should be directed to the femtocells, which have higher bandwidth, and that, even with a loss of data, can meet the minimum QoS of this particular application; mainly due to existing correction protocols in TCP/IP.
ground, between the consumption and the quality of service provided.
Thus, the following contributions can be seen as results of this work: (a) the proposal of a Markov optimization model for optimal allocation of users in macro-femto network, considering the type of traffic to be transmitted, (b) unlike from studies in literature, the model was built considering crosslayer aspects (bandwidth, signal strength) and energy efficiency (battery level) (c) Green Markov Models is developing library that includes studies of energy consumption and QoS in 3G/4G networks, optical networks and wireless sensors. For each network, a particular set of constraints of the network under study is included into the model, which gives reliable results and adapted to a specific technology.
As limitations, it is pointed that the model was implemented in a general way, not conducting specific studies, such as: (a) costs associated with handoffs (between macro and femto cell), (b) cost associated, with each new call, to choose which network to connect.
REFERENCES
[1] Anatel, “Brazil closes 2011 with record mobile telephony”, 2012. Available in: http://www.anatel.gov.br/Portal/exibirPortalNoticias.do?acao=carregaNoticia&codigo=24506 (in portuguese).
[2] Chandrasekhar V., Andrews J. G., and Gatherer A., “Femtocell Networks: A Survey”. In IEEE Commun. Mag., vol. 46, pp. 59–67, 2008.
[3] Ertürk M. C., Güvenc I., Arslan H., “Femtocell gateway scheduling for capacity and fairness improvement in neighboring femtocell networks”. In Proc. IEEE CogCloud Workshop (co-located with IEEE PIMRC 2010), Istanbul, Turkey, 2010.
[4] Wang X., Athanasios V. Vasilakos, Min Chen, Yunhao Liu, Ted "Taekyoung" Kwon, "A Survey of Green Mobile Networks: Opportunities and Challenges", in ACM/Springer Mobile Networks and Applications (MONET), Vol. 17, No. 1, pp.4-20, Feb, 2012. [5] McLaughlin S, “Green radio: the key issues— programme objectives and overview”. Wireless World Research Forum, 2008. [6] SearchNetworking, Green Networking”, 2009. Available in: http://searchnetworking.techtarget.com/definition/green-networking. [7] Zhang Y. J., and Letaief K. B., “Multiuser adaptive subcarrier and bit allocation with adaptive cell selection for OFDM systems. In
IEEE Trans. Wireless Commun., vol. 3, no. 4, pp. 1566–1575, 2004.
[8] Rhee W. and Cioffi J. M., “Increase in capacity of multiuser OFDM system using dynamic subchannel allocation”. In Proc. IEEE Vehic. Technol. Conf. (VTC), Tokyo, Japan, pp. 1085–1089, 2000.
[9] Kim J. Y., and Cho D. H., “A joint power and subchannel allocation scheme maximizing system capacity in dense femtocell downlink systems”. In Proc. IEEE Int. Symp. Personal, Indoor, Mobile Radio Commun. (PIMRC), Tokyo, Japan, 2009.
[10] Chung S. P. and Lee J. C., “Performance analysis and overflowed traffic characterization in multiservice hierarchical wireless networks”. In IEEE Trans. Wireless Commun., vol. 4, no. 3, pp. 904–918, 2005.
[11] Hu L. R. and Rappaport S., Personal communication systems using multiple hierarchical cellular overlays”. In IEEE J. Sel. Areas Commun., vol. 13, no. 2, pp. 406–415, 1995.
[12] Liao W. H., Yen W. M., “Power-saving scheduling with a QoS guarantee in a mobile WiMAX system”. In J NetwComput Appl 32(6):1144–1152, 2009.
[13] Han C., Beh K. C., Nicolau M., Armour S., Doufexi A., “Power efficient dynamic resource scheduling algorithms for LTE”. In Proceedings of IEEE VTC-fall, 2010.
[14] Holger C., Lester T. W. H., and Louis G. S., “An Overview of the Femtocell Concept”. In Bell Labs Technical Journal, Vol. 13(1), pp.221246, 2008.
[15] John D. H. and Holger C., “Deployment Options for Femtocells and Their Impact on Existing Macrocellular Networks”, In Bell Labs Technical Journal, Vol. 13(4), pp.145160, 2009.
[16] Puterman, L. M., “Markov Decision Processes: Discrete Stochastic Dynamic Programming”. John Wiley & Sons, 1994. [17] Tijms, H. C., 1994. Stochastic models: an algorithmic approach. John Wiley & Sons.