DOI: http://dx.doi.org/10.1590/2446-4740.07017 Volume 34, Number 1, p. 65-72, 2018
Introduction
Total hip arthroplasty (THA) is a surgical procedure for hip replacement using a prosthesis to relieve pain and improve function in patients with coxarthrosis. Coxarthrosis is a chronic and progressive degenerative
disease that causes atrophy and degeneration of adjacent muscles to the hip with persistent changes in gait, which are not fully recovered with THA (Castagna et al., 2011).
A characteristic change resulting from hip dysfunction in patients with coxarthrosis is the Trendelenburg sign (TS) that results from a drop in pelvic position on the swing leg side as bodyweight is transferred to the opposite leg during walking. This gait pattern is associated with the weakness of the hip abductor muscles (HA), considered important stabilizers of the pelvis during single leg stance phase of gait (Hardcastle and Nade, 1985). The normal HA muscles would be able to prevent the movement of the pelvis in the frontal plane that is limited by the contraction of such muscles during the gait contralateral leg swing phase (Hardcastle and Nade, 1985).
In the clinical context, the TS is usually evaluated subjectively by means of physical tests (Trendelenburg Test – TT) that even when carefully applied can provide false positive results (Hardcastle and Nade, 1985). The TT has additional limitations. Although largely used in a clinical context to evaluate hip function, recent results
Gait variability and symmetry assessment with inertial sensors for
quantitative discrimination of Trendelenburg sign in total hip arthroplasty
patients: a pilot study based on convenience sampling
Luiz Cláudio Vieira Ferreira
1,2, Amanda Gomes Rabelo
1, Marcus Fraga Vieira
3*,
Adriano Alves Pereira
1, Adriano de Oliveira Andrade
11 Centre for Innovation and Technology Assessment in Health, Faculty of Electrical Engineering, Federal University of Uberlândia,
Uberlândia, MG, Brazil.
2 Department of Orthopeadics, Clinical Hospital, Federal University of Uberlândia, Uberlândia, MG, Brazil. 3 Bioengineering and Biomechanics Laboratory, Federal University of Goiás, Goiânia, GO, Brazil.
Abstract Introduction: The aim of this pilot study based on convenience sampling was to analyze the feasibility to quantitatively discriminate Trendelenburg sign (TS), a characteristic drop in pelvic position during gait in hip disfunctions, in patients with total hip arthroplasty (THA), by assessing gait variability and symmetry using inertial sensors. Methods: Thirteen patients with right THA, divided into two groups with (GTS, n=4) and without TS (GnTS, n=9) assessed by experienced physician, were enrolled in the study. Harris Hip Score was applied for specific evaluation of THA. The protocol consisted in walking on a level treadmill during 3 minutes with two inertial sensors attached at anterior superior iliac spine of both sides. For each left and right step, features were extracted from the Y-axis gyroscope signals: peak value, mean absolute value, standard deviation and range. For each feature, a symmetry ratio was calculated as the ratio between left and right side. Results: No significant differences were
found in Harris Hip Score between groups. The variability assessed by standard deviation for left step, contralateral to the replaced side, was significantly larger for GTS group (p<0.001). Significant differences in the symmetry ratios were found between GTS and GnTS for all features extracted from gyroscopes Y-axis (W=144, p<0.001). The symmetry ratios for GnTS group were approximately equal one (except for range), whereas for the GTS group they exceed the 10% criterion. Conclusion: The variability and symmetry ratios of gait features extracted from inertial sensors were successful to discriminate TS in THA patients.
Keywords Gait symmetry, Gait variability, Harris hip score, Inertial sensors, Trendelenburg sign, Total hip arthroplasty.
This is an Open Access article distributed under the terms of the Creative Commons Attribution License, which permits unrestricted use, distribution, and reproduction in any medium, provided the original work is properly cited.
How to cite this article: Ferreira LCV, Rabelo AG, Vieira MF, Pereira AA, Andrade AO. Gait variability and symmetry assessment with inertial sensors for quantitative discrimination of Trendelenburg sign in total hip arthroplasty patients: a pilot study based on convenience sampling. Res Biomed Eng.2018; 34(1):65-72. DOI: 10.1590/2446-4740.07017.
*Corresponding author: Marcus Fraga Vieira, Bioengineering and Biomechanics Lab, Federal University of Goiás, Av. Esperança, Campus Samambaia, CEP 74690-900, Goiânia, GO, Brazil. E-mail: [email protected]
could not support the HA muscles hypothesis, in which HA muscular weakness would be the cause of the drop in pelvic position (DiMattia et al., 2005; Kendall et al., 2013, 2010). The TT should be reserved for use with populations with marked hip abductor muscle weakness, not being recommended as a screening measure for hip abductor muscle strength in populations with strength greater than 30% of body weight (Kendall et al., 2013). In addition, the TT is not useful in identifying subjects in the early stages of hip joint osteoarthritis, whose sensitivity of pelvis-on-femur adduction measured with a goniometer was 0.55, and specificity was 0.70, and sensitivity of hip abductor manual muscle test strength was 0.35, and specificity was 0.90 (Youdas et al., 2010). When quantitative assessment is necessary, a kinematic analysis should be done in a gait laboratory to properly identify and assess gait changes related to TS. However, such kinematic analysis requires high cost motion analysis laboratories, with limited access to patients, researchers and health professionals (Mayagoitia et al., 2002).
Accelerometers attached to the body have been used as an alternative approach to conventional gait analysis (Kavanagh and Menz, 2008; Yang et al., 2012), such as motion capture systems and force platforms, with some advantages including low cost, protocols not restricted to a laboratory, unrestricted movement by volunteers and direct 3D acceleration measurements. The most robust use of accelerometers in gait analysis is for the determination of related spatiotemporal parameters of foot contact events (Kavanagh and Menz, 2008), by assessing the captured oscillations of the accelerometer time series. From heel strike events, step and stride time can be calculated as the period of successive peaks or valleys, while volunteers are walking either over ground or on a treadmill.
By processing data from accelerometer, information about gait variability and lower limb movement asymmetry can be extracted. Gait variability may be regarded as a sign of adaptability required for a successful locomotion, or a sign of impaired balance control (Moe-Nilssen and Helbostad, 2005). Various measures of gait variability have been suggested such as stride-to-stride variability in stride length (Brach et al., 2005), stride width (Brach et al., 2008, 2005), speed, stance time and swing time (Hausdorff et al., 2003), or acceleration variability of the pelvis, trunk or head (Kavanagh et al., 2005; Moe-Nilssen and Helbostad, 2004).
Lord et al. (Lord et al., 2011) suggested that gait variability has been increasingly used as a marker for gait performance, mobility and fall risk evaluation. As pointed out by the authors, a variety of studies in biomechanics investigate the variability of gait for older adults, and there is lack of studies that focus in
other populations, such as individuals suffering from hip joint involvement.
On the other hand, gait asymmetry can be an indicator of pathology and it has been assessed for a variety of musculoskeletal and neurological conditions. In pathological gait, marked differences have been reported between the affected and unaffected limbs, as observed in amputee gait (Kaufman et al., 2012), in post-stroke patients (Lewek et al., 2014), in hemiplegic subjects, in hemiparetic patients, ageing and Parkinson’s disease (Yogev et al., 2007), in patients with limb length inequality (Kaufman et al., 1996), or osteoarthritis and THA patients (Hodt-Billington et al., 2012). These examples illustrate how gait asymmetry can be a direct consequence of abnormality, and, furthermore, can reduce the performance of everyday tasks and the quality of life (Kaufman et al., 2012). For example, in amputees gait asymmetries may lead to back and/or intact limb pain (Ephraim et al., 2005), osteoarthritis in the intact limb (Burke et al., 1978; Kulkarni et al., 1998), osteoporosis in the residual limb (Kulkarni et al., 1998), and musculoskeletal problems (Ephraim et al., 2005). Therefore, rehabilitation professionals demand great efforts in restoring a more symmetrical gait pattern of their patients, including those with hip osteoarthritis and after total hip replacement (Hodt-Billington et al., 2012).
A certain amount of asymmetry can be observed in able-body subjects, so that there is no common agreement on clinical criteria for when gait asymmetry should be considered pathological (Hodt-Billington et al., 2012). In this sense, several measurements of spatiotemporal gait asymmetry have been proposed (Lauzière et al., 2014), and step length, stance time and swing time are gait features that provide reliable symmetry measurements (Lewek and Randall, 2011). Symmetry ratio, taken as the ratio between paretic and nonparetic step length, is a reliable measure of symmetry, being considered a good discriminator and an indicator of pathological condition if exceed 10% criterion for step length (Hodt-Billington et al., 2012). Although the 10% criterion of gait asymmetry has initially been arbitrarily proposed (Robinson et al., 1987), it is valid, and is also feasible for use on patients in physiotherapy practice and research (Hodt-Billington et al., 2012).
which can be used even by professionals without great experience in hip evaluation.
Methods
Participants and ethics statement
A total of 13 right-footed patients of both sexes were enrolled in the study. Inclusion criteria were: right THA with no more than 36 months of recovery, able to walk without assistance, between 60 and 65 years old. Exclusion criteria were: presence of sign of impairment in other joint, unable to understand the protocol instructions, presence of pain during data collection (self-declared). The patients (average postoperative time of 23.3±5.1 months) were divided into two groups: with TS (GTS, n=4, 2 male, 2 female, 62.7±6.9 years old) and without TS (GnTS, n=9, 4 male, 5 female, 63.0±5.2 years old) assessed by an orthopedic surgeon with large experience in hip arthroplasty and hip evaluation. They voluntarily signed an informed consent form, specifically approved for this study, prior to participation. This study was approved by the university’s Ethics Committee for Human Research under number 49801115.4.0000.5152.
Data collection
Initially, the patients were assessed by Harris Hip Score (HHS) test using a culturally adapted version (Guimarães et al., 2010). Harris Hip Score test is a specific evaluation tool used to assess the results of hip arthroplasty (Harris, 1969). It presents a scale with a maximum of 100 points, including evaluation of pain, function, deformity and mobility. Pain and function have the highest weight (44 and 47 points, respectively). Movement amplitude and deformity receive 5 and 4 points, respectively. Function is subdivided into daily living activities (14 points) and gait (33 points). In the gait section of function domain, the patient is asked about limp. References values for HHS are Poor (<70), Fair (70-79), Good (80-89) and Excellent (90-100), and for Limp score of HHS are None=11, Slight=8, Moderate=5 and Severe or unable to walk=0 (Nilsdotter and Bremander, 2011).
Next, the patients walked on a level treadmill during 3 minutes in a constant speed of 2 km/h, a comfortable speed for all participants. The first two minutes were used to become familiar with treadmill walking, and the last 1 minute was used for data collection.
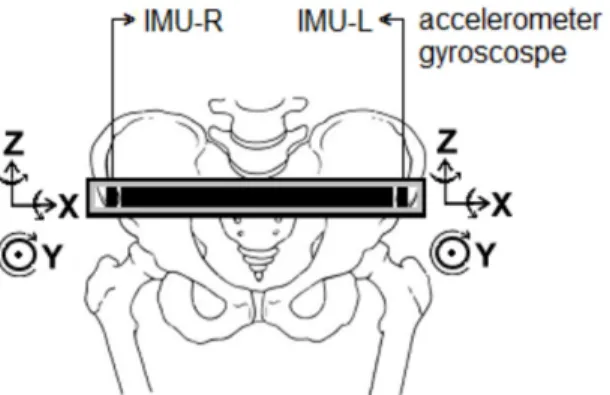
Gait kinematic data were collected using a customized belt coated with Velcro containing two embedded inertial measurement units (IMUs) composed by triaxial accelerometer and gyroscope (LSM303DLM and L3GD4200D, respectively) positioned on the right (IMU-R) and left (IMU-L) ASIS. Their signals were recorded during the last 1 minute of walking on the
treadmill. The IMUs X, Y and Z axes were oriented to the mediolateral, anteroposterior and vertical directions, respectively (Figure 1).
The system for processing the gait kinematic data is composed of three main units (Andrade et al., 2017): (i) a customized hardware and software for movement detection, visualization of data in real time and data storage; (ii) an automatic tool for step and stride time interval detection and outlier removal; (iii) feature extraction, data organization and storage in a spreadsheet. A microcontroller (Atmel SAM3X8E ARM Cortex-M3 CPU) is responsible for the configuration of the IMUs, for reading information from the IMUs, and for transmitting this information to the PC through serial communication (USB). One of the timers of the microcontroller was configured so that data could be sampled from the digital sensors (IMUs) at 50 Hz. All the information (each of the X, Y and Z axis of each sensor) are transmitted to the PC at 115,200 bit/s.
Signal processing
The collected gait kinematic data were filtered using a zero-phase, 20th order digital bandpass Butterworth filter, with lower cutoff frequency of 0.01 Hz and upper cutoff frequency of 5 Hz. The linear trend of the signal was removed by subtracting it from its mean, and the nonlinear trend was removed by subtracting the signal from a high order polynomial (order = 20) fit.
The right and left accelerometer Y-axis signals were used to identify gait cycles so that it was possible to measure the variation of the acceleration in the sagittal plane. The local minima of the Y-axis of the accelerometer represent the beginning of the gait cycle (i.e., the heel strike) (Figure 2). The beginning of the stride was set to the local minimum and its end to the next local minimum on the same side. Thus, the stride consists of two steps, starting with the step of a limb followed by the step of the contralateral limb. The end of a stride coincides with the start of the following stride for consecutive strides.
All the local minima (valleys) were detected (Figure 2), and this set of local minima was clustered by means of the Fuzzy C-means clustering algorithm. Neighbor valleys with a temporal distance inferior to 200 ms were merged. Outlier periods were removed after estimation of 0.25 and 0.75 quantiles.
After identification of the right and left step intervals, the right and left gyroscope Y-axis signals were used to obtain the variation of the pelvis angular velocity on the frontal plane, since some hip impairments, such as TS, are characterized by signs in frontal plane. The following features, related to the signal amplitude, were extracted for each step interval of the Y-axis of gyroscopes time series (Chou and Huaibei, 2015):
• PEAK (peak value);
• MAV (mean absolute value);
• STD (standard deviation);
• RANGE (difference between maximal and minimal value).
These features were chosen to properly characterize the analyzed signal, allowing the comparison between the two groups along the step intervals. They are central tendency and variability measures.
For each feature, the values for the 2.5%, 50% and 97.5% confidence intervals were calculated using
bootstrap analysis with 1,000 samples. Next, the symmetry ratio was calculated as the ratio between left step time (healthy side) value and right step time (replaced side) value, similar to the proposed symmetry ratio for stroke patients (nonparetic/paretic limb) (Lewek et al., 2014). Symmetry ratio equal one indicates perfect symmetry, larger than one indicates that left step time is larger than right step time. As gait speed was the same for all participants, step time is equivalent to step length, a reliable gait feature in symmetry ratio calculation (Lewek and Randall, 2011).
Statistical analysis
The symmetry ratios were grouped in a vector for GTS group and for GnTS group. Since the data did not fit a normal distribution (Shapiro-Wilk test, p<0.05), a nonparametric U-Mann-Whitney design test was applied to assess the differences between GTS and GnTS symmetry ratios. The same test was used to compares HHS between groups. The statistical analysis was performed with R software using a custom-written code, with a significance level set at p < 0.05.
Results
The results for HHS test are presented in Table 1. As shown, there was no significant difference between groups even for HHS Limp score, directly related to claudication, and a good indicator of TS.
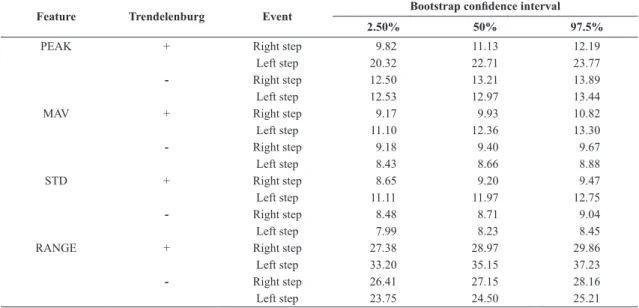
The results for the selected features are presented in Table 2, for right and left steps.
Table 3 presents the symmetry ratios for the corresponding confidence intervals.
Significant differences in the symmetry ratios were found between GTS and GnTS for all features extracted from gyroscopes Y-axis (W=144, p<0.001). The symmetry ratios for GnTS group were approximately equal one (except for RANGE), whereas for GTS group they exceed the 10% criterion. Besides, the variability assessed by STD for left step, contralateral to the replaced side, was significantly larger for GTS group (W=98.5, p<0.001).
Discussion
The aim of this study was to test the feasibility of a tool to quantitatively discriminate TS in patients with THA, and to help follow their recovery progress by registering a progressive reduction in symmetry index during a rehabilitation program. Two IMUs, composed of triaxial accelerometers and gyroscopes, were attached to ASIS of both sides in a protocol that can be easily used in a clinical context. Left and right steps were properly identified by Y-axis accelerometer and gait features were extracted from Y-axis gyroscopes (pelvis angular velocity in frontal plane) to assess gait symmetry and variability.
Although inertial sensors have been used to detect and track gait asymmetries (Williamson et al., 2015), the IMUs configuration proposed in the present study allows for a more intuitive and reliable identification of foot contacts, subsequent calculation of step and
Table 1. HHS results for GnTS and GTS groups.
GnTS GTS p-value
HHS 88.5±13.1 91.1±3.7 0.710* HHS Limp score 7.3±1.5 9.7±1.6 0.076*
*nonparametric U-Mann-Whitney test.
Table 2. Selected features extracted from Y-axis of gyroscopes.
Feature Trendelenburg Event Bootstrap confidence interval
2.50% 50% 97.5%
PEAK + Right step 9.82 11.13 12.19
Left step 20.32 22.71 23.77
- Right step 12.50 13.21 13.89
Left step 12.53 12.97 13.44
MAV + Right step 9.17 9.93 10.82
Left step 11.10 12.36 13.30
- Right step 9.18 9.40 9.67
Left step 8.43 8.66 8.88
STD + Right step 8.65 9.20 9.47
Left step 11.11 11.97 12.75
- Right step 8.48 8.71 9.04
Left step 7.99 8.23 8.45
RANGE + Right step 27.38 28.97 29.86
Left step 33.20 35.15 37.23
- Right step 26.41 27.15 28.16
Left step 23.75 24.50 25.21
+ refers to GTS group; - refers to GnTS group.
Table 3. Symmetry ratios for features extracted from Y-axis of gyroscopes.
Feature Trendelenburg Bootstrap confidence interval
2.50% 50% 97.5%
PEAK + 1.95 2.04 2.07
- 0.97 0.98 1.00
MAV + 1.21 1.22 1.24
- 0.92 0.92 0.92
STD + 1.28 1.31 1.35
- 0.93 0.94 0.94
RANGE + 1.21 1.21 1.25
- 0.90 0.90 0.90
stride time intervals of both sides and extraction of features to assess inter-step variability. The possibility of extracting such additional gait features is an argument that favors the use of an IMU system compared to the TT, in addition to its ease of use, objectivity and the fact that even professionals without great experience in hip evaluation can use it.
Previous studies using gyroscopes or accelerometers to identify gait events have used gyroscopes attached to lower limb segments (Aminian et al., 2002; Tong and Granat, 1999; Williamson et al., 2015) or one accelerometer attached to the lower trunk (Moe-Nilssen and Helbostad, 2004; Zijlstra and Hof, 2003). Although such configuration allows foot contact identification with a good precision, the calculation is not so intuitive, and involves a simplified inverted pendulum based gait modeling as well as a not trivial signal processing, such as wavelet (Aminian et al., 2002), machine learning, neural network (Shimada et al., 2005) or unbiased autocorrelation function (Moe-Nilssen and Helbostad, 2004), besides the preprocessing of the signal.
Using two inertial sensors, we have simultaneous information from both sides during left and right events. This provides the possibility of joint variability analysis (i.e., considering left and right sides simultaneously) as explored in this research. This type of joint analysis has not been reported in the literature.
The functional HHS test was not able to properly discriminate the two groups, even considering the specific item related to limping. Indeed, GTS group presented better results than GnTS group. This was not the case when interpreting the quantitative results.
Regarding gait variability, standard deviation of left step was significantly larger in GTS group. Left step is characterized by right lower limb stance phase and left lower limb swing phase, and a pelvic rotation in frontal plane toward left limb is expected. According to Trendelenburg’s hypothesis (Hardcastle and Nade, 1985), such pelvic rotation is limited by HA muscles activation, which would be, however, not effective in GTS group of the present study, because the patients have undergone THA in right side. This would explain the larger variability observed for GTS group and it can be a good objective assessment of TS. However, the relation between HA activation and TS needs further research (Kendall et al., 2013, 2010).
The use of symmetry ratios was also successful to discriminate TS in THA patients. GTS group presented symmetry ratio larger than one for all gait features extracted from Y-axis gyroscopes, an indicative of a pathological condition. In addition, the symmetry ratios were significantly larger for GTS group than for GnTS group. These gait symmetry measures can be quickly and routinely obtained during rehabilitation.
The methodology is previously advocated because it is easily administrated, of high portability, low cost, and may be used inside and outside clinical situations (Tura et al., 2010).
Caution should be taken, however, when interpreting the results for the RANGE feature. Although symmetry ratio calculated using RANGE was larger than one and significantly larger for GTS group, the values for GnTS group also satisfied the 10% criterion. In GnTS group, RANGE was smaller for left step whereas in GTS group RANGE was smaller for right step.
Finally, this study has some limitations that should be noted. The patients were assessed when walking on a treadmill at a constant speed, and overground walking at preferred walking speed should be further tested. Furthermore, considering that this research is a pilot study based on a convenience sample of reduced size, to properly deal with possible false positives or false negatives and provide reliable and automatic TS identification, a larger sample should be assessed in different gait conditions and by different experimenters.
Acknowledgements
The present work has the support of Brazilian government (CNPq, CAPES, FAPEMIG- APQ-00942-17, and FAPEG). A. A. Pereira and A. O. Andrade are a Fellow of CNPq, Brazil (306718/2014-6 and 305223/2014-3, respectively). The authors thank the volunteers who participated in the study.
References
Aminian K, Najafi B, Büla C, Leyvraz P-F, Robert P. Spatio-temporal parameters of gait measured by an ambulatory system using miniature gyroscopes. J Biomech. 2002; 35(5):689-99. http:// dx.doi.org/10.1016/S0021-9290(02)00008-8. PMid:11955509.
Andrade AO, Ferreira LCV, Rabelo AG, Vieira MF, Campos AR, Gonçalves BF, Pereira AA. Pelvic movement variability of healthy and unilateral hip joint involvement individuals. Biomed Signal Process Control. 2017; 32:10-9. http://dx.doi. org/10.1016/j.bspc.2016.10.008.
Brach JS, Berlin JE, VanSwearingen JM, Newman AB, Studenski SA. Too much or too little step width variability is associated with a fall history in older persons who walk at or near normal gait speed. J Neuroeng Rehabil. 2005; 2(1):21. http://dx.doi.org/10.1186/1743-0003-2-21. PMid:16042812.
Brach JS, Studenski S, Perera S, VanSwearingen JM, Newman AB. Stance time and step width variability have unique contributing impairments in older persons. Gait Posture. 2008; 27(3):431-9. http://dx.doi.org/10.1016/j.gaitpost.2007.05.016. PMid:17632004.
Castagna A, Rinaldi S, Fontani V, Mannu P, Margotti ML. Comparison of two treatments for coxarthrosis: local hyperthermia versus radio electric asymmetrical brain stimulation. Clin Interv Aging. 2011; 6:201-6. http://dx.doi.org/10.2147/CIA. S23130. PMid:21822376.
Chou J, Huaibei Z. Bioinformatics and Biomedical Engineering: New Advances. In: Proceedings of the 9th International Conference on Bioinformatics and Biomedical Engineering – ICBBE; 2015 Sep 18-20; Shanghai, China. Boca Raton: CRC Press; 2015.
DiMattia MA, Livengood AL, Uhl TL, Mattacola CG, Malone TR. What are the validity of the single-leg-squat test and its relationship to hip-abduction strength? J Sport Rehabil. 2005; 14(2):108-23. http://dx.doi.org/10.1123/jsr.14.2.108.
Ephraim PL, Wegener ST, MacKenzie EJ, Dillingham TR, Pezzin LE. Phantom pain, residual limb pain, and back pain in amputees: Results of a national survey. Arch Phys Med Rehabil. 2005; 86(10):1910-9. http://dx.doi.org/10.1016/j. apmr.2005.03.031. PMid:16213230.
Guimarães RP, Alves DPL, Silva GB, Bittar ST, Ono NK, Honda E, Polesello GC, Ricioli W Jr, Carvalho NAA. Translation and cultural adaptation of Harris hip score into portuguese. Acta Ortop Bras. 2010; 18:142-7. http://dx.doi.org/10.1590/ S1413-78522010000300005.
Hardcastle P, Nade S. The significance of the Trendelenburg test. J Bone Joint Surg Br. 1985; 67(5):741-6. http://dx.doi. org/10.1302/0301-620X.67B5.4055873. PMid:4055873.
Harris WH. Traumatic arthritis of the hip after dislocation and acetabular fractures: treatment by mold arthroplasty. An end-result study using a new method of result evaluation. J Bone Joint Surg Am. 1969; 51(4):737-55. http://dx.doi. org/10.2106/00004623-196951040-00012. PMid:5783851.
Hausdorff JM, Schaafsma JD, Balash Y, Bartels AL, Gurevich T, Giladi N. Impaired regulation of stride variability in Parkinson’s disease subjects with freezing of gait. Exp Brain Res. 2003; 149(2):187-94. http://dx.doi.org/10.1007/s00221-002-1354-8. PMid:12610686.
Hodt-Billington C, Helbostad JL, Vervaat W, Rognsvåg T, Moe-Nilssen R. Criteria of gait asymmetry in patients with hip osteoarthritis. Physiother Theory Pract. 2012; 28(2):134-41. http:// dx.doi.org/10.3109/09593985.2011.574783. PMid:21722001.
Kaufman KR, Frittoli S, Frigo CA. Gait asymmetry of transfemoral amputees using mechanical and microprocessor-controlled prosthetic knees. Clin Biomech. 2012; 27(5):460-5. http:// dx.doi.org/10.1016/j.clinbiomech.2011.11.011. PMid:22221344.
Kaufman KR, Miller LS, Sutherland DH. Gait asymmetry in patients with limb-length inequality. J Pediatr Orthop. 1996; 16(2):144-50. http://dx.doi.org/10.1097/01241398-199603000-00002. PMid:8742274.
Kavanagh JJ, Menz HB. Accelerometry: a technique for quantifying movement patterns during walking. Gait Posture. 2008; 28(1):1-15. http://dx.doi.org/10.1016/j.gaitpost.2007.10.010. PMid:18178436.
Kavanagh JJ, Morrison S, Barrett RS. Coordination of head and trunk accelerations during walking. Eur J Appl Physiol. 2005; 94(4):468-75. http://dx.doi.org/10.1007/s00421-005-1328-1. PMid:15827734.
Kendall KD, Patel C, Wiley JP, Pohl MB, Emery CA, Ferber R. Steps toward the validation of the Trendelenburg test: the effect of experimentally reduced hip abductor muscle function on frontal plane mechanics. Clin J Sport Med. 2013; 23(1):45-51. http://dx.doi.org/10.1097/JSM.0b013e31825e66a1. PMid:22797529.
Kendall KD, Schmidt C, Ferber R. The relationship between hip-abductor strength and the magnitude of pelvic drop in patients with low back pain. J Sport Rehabil. 2010; 19(4):422-35. http://dx.doi.org/10.1123/jsr.19.4.422. PMid:21116011.
Kulkarni J, Adams J, Thomas E, Silman A. Association between amputation, arthritis and osteopenia in British male war veterans with major lower limb amputations. Clin Rehabil. 1998; 12(4):348-53. http://dx.doi.org/10.1191/026921598672393611. PMid:9744670.
Lauzière S, Betschart M, Aissaoui R, Nadeau S. Understanding spatial and temporal gait asymmetries in individuals post stroke. Int J Phys Med Rehabil. 2014; 2:201. http://dx.doi. org/10.4172/2329-9096.1000201.
Lewek MD, Bradley CE, Wutzke CJ, Zinder SM. The relationship between spatiotemporai gait asymmetry and balance in individuals with chronic stroke. J Appl Biomech. 2014; 30(1):31-6. http://dx.doi.org/10.1123/jab.2012-0208. PMid:23677889.
Lewek MD, Randall EP. Reliability of spatiotemporal asymmetry during overground walking for individuals following chronic stroke. J Neurol Phys Ther. 2011; 35(3):116-21. http://dx.doi. org/10.1097/NPT.0b013e318227fe70. PMid:21934372.
Lord S, Howe T, Greenland J, Simpson L, Rochester L. Gait variability in older adults: a structured review of testing protocol and clinimetric properties. Gait Posture. 2011; 34(4):443-50. http://dx.doi.org/10.1016/j.gaitpost.2011.07.010. PMid:21920755.
Mayagoitia RE, Nene AV, Veltink PH. Accelerometer and rate gyroscope measurement of kinematics: An inexpensive alternative to optical motion analysis systems. J Biomech. 2002; 35(4):537-42. http://dx.doi.org/10.1016/S0021-9290(01)00231-7. PMid:11934425.
Moe-Nilssen R, Helbostad JL. Estimation of gait cycle characteristics by trunk accelerometry. J Biomech. 2004; 37(1):121-6. http://dx.doi.org/10.1016/S0021-9290(03)00233-1. PMid:14672575.
Moe-Nilssen R, Helbostad JL. Interstride trunk acceleration variability but not step width variability can differentiate between fit and frail older adults. Gait Posture. 2005; 21(2):164-70. http:// dx.doi.org/10.1016/j.gaitpost.2004.01.013. PMid:15639395.
Nilsdotter A, Bremander A. Measures of hip function and symptoms: Harris Hip Score (HHS), Hip Disability and Osteoarthritis Outcome Score (HOOS), Oxford Hip Score (OHS), Lequesne Index of Severity for Osteoarthritis of the Hip (LISOH), and American Academy of Orthopedic Surgeons (AAOS) Hip and Knee Questionnaire. Arthritis Care Res. 2011; 63(Suppl 11):S200-7. http://dx.doi.org/10.1002/acr.20549. PMid:22588745.
Shimada Y, Ando S, Matsunaga T, Misawa A, Aizawa T, Shirahata T, Itoi E. Clinical application of acceleration sensor to detect the swing phase of stroke gait in functional electrical stimulation. Tohoku J Exp Med. 2005; 207(3):197-202. http:// dx.doi.org/10.1620/tjem.207.197. PMid:16210830.
Tong K, Granat MH. A practical gait analysis system using gyroscopes. Med Eng Phys. 1999; 21(2):87-94. http://dx.doi. org/10.1016/S1350-4533(99)00030-2. PMid:10426508.
Tura A, Raggi M, Rocchi L, Cutti AG, Chiari L. Gait symmetry and regularity in transfemoral amputees assessed by trunk accelerations. J Neuroeng Rehabil. 2010; 7:4. http://dx.doi. org/10.1186/1743-0003-7-4. PMid:20085653.
Williamson JR, Dumas A, Hess AR, Patel T, Telfer BA, Buller MJ. Detecting and tracking gait asymmetries with wearable accelerometers. In: Institute of Electrical and Electronics Engineers – IEEE. 12th International Conference Wearable Implant Body Sens Networks – BSN; 2015 June 9-12; Cambridge, MA, USA. New Jersey: IEEE; 2015. https://doi. org/10.1109/BSN.2015.7299355.
Yang M, Zheng H, Wang H, McClean S, Newell D. IGAIT: An interactive accelerometer based gait analysis system. Comput Methods Programs Biomed. 2012; 108(2):715-23. http://dx.doi. org/10.1016/j.cmpb.2012.04.004. PMid:22575802.
Yogev G, Plotnik M, Peretz C, Giladi N, Hausdorff JM. Gait asymmetry in patients with Parkinson’s disease and elderly fallers: When does the bilateral coordination of gait require attention? Exp Brain Res. 2007; 177(3):336-46. http://dx.doi. org/10.1007/s00221-006-0676-3. PMid:16972073.
Youdas JW, Madson TJ, Hollman JH. Usefulness of the Trendelenburg test for identification of patients with hip joint osteoarthritis. Physiother Theory Pract. 2010; 26(3):184-94. http://dx.doi.org/10.3109/09593980902750857. PMid:20331375.