47
Assessment Of Patient Problems Encountered
With Total Hip Replacement At Baghdad Teaching
Hospitals
Faris Fauze Ahmed, Dr. Halima Yusuf Al-Rubaie
Abstract: Background: Total hip replacements conduct highly effective in relieving pain dysfunction for patients who suffer from hip inflammation and a variety of reasons, however, after several decades of success in hip replacement there was also an increase in cases of fract ures after you perform a detailed switch and attributed this The increase in the prevalence of a large fraction of the increase in the number of switch detailed and increasing age and poverty operations. Objectives: The study aims toAssess the pre operation physical and psychosocial problems of patients with total hip replacement. To Assess the post operation physical and psychosocial problems of patients with total hip replacement. To find out the relationship between pre _ post physical and psychosocial problems with (age, gender, duration of illness and type of operation) . Design of the study: A descriptive design study was carried out in Nursing Home hospital and Ghazi AL-Hariri for specialized surgical hospitals starting from January, 13th 2015 to September, 1st 2015, The study Sample: A non- probability (purposive) sample of 50 patients undergoing total hip replacement surgery who have several problems before and after surgery. The study Instrument: The study instrument was composed of three parts which as socio demographic information was included; age group, gender, marital status, level of education, occupational, economic, part two consist of medical information was comprised of (7 ) items, and part three contain physical and psychosocial problems through Hamilton anxiety scale consist of 84 items. Validity and Reliability: The content validity of the instrument was established through a panel of (14) experts, the reliability of the items was based on the internal consistency of the questionnaire was assessed by calculating Cronbach s' Coefficient alpha which as= 0.73. Statistical Analysis: The researchers used the appropriate statistical methods for data analysis which include the descriptive data analysis, and inferential data analysis. Result: the findings revealed that the males that 54.0%, High percent of them 28.0% at 48-57 years old, 82.0% were married 38.0% of them at Graduated from primary school, 42.0% house wife, and majority of them 84.0% were high score of socio-economic status.
Keywords: Total hip replacement, physical problems, psychosocial problems.
————————————————————
1
I
NTRODUCTIONTotal hip replacement (THR )is replacement of badly damaged with Artificial joint, Although a large number of implants available, and most consist of metal femoral component, topped with a spherical ball installed in a plastic acetabular socket, which is hold in the bone with methyl methacrylate (bone cement), after Successful operation, and the hip is a free or almost free of pain, has good movement, is more stable, and usually allows normal or near normal curfew (
Abdulkarim
, 2013). Pain is the main indicator for hip replacement, this include pain with movement and pain at rest, much of the pain may be relieved reliable as 1 week after surgery (Okoro, 2012). Function limitation, capsular contractions and joint deformity and cause a decline in the movement of the hip, with subsequent functional limitations (Goyal, 2013). Loss of mobility, there is some subset patient who stiff joints without hip pain, is an indication for surgery, these groups of patients with ankylosing spondylitis include (Gossec, 2010). Radiographic indications of intra-articular disease, although the radiographic changes are considered in making the decision to work, and selected more important is the severity of symptoms (Javed, 2011). The surgery is generally taken for patients over 60 with unremitting pain or irreversibly damage hip joints (Arden, 2011). Total- hip replacement provides significant relief from pain and improve function, it is a badly damaged hip replacement with an artificial joint, the need for this surgery include arthritis, femoral neck fracture, and thrown trauma and problem resulting from congenital -hip disease (Apold, 2011).Methodology:
Objectives of the study:
1- To assess the pre operation physical and psychosocial problems of patients with total hip replacement.
2- To Assess the post operation physical and psychosocial problems of patients with total hip replacement.
3- To find out the relationship between pre _ post physical and psychosocial problems with (age, gender, duration of illness and type of operation).
The study Sample: A non- probability (purposive) sample of 50 patients undergoing total hip replacement surgery who have several problems before and after surgery.
The study Instrument: The study instrument was composed of three parts which as socio demographic information was included; age group, gender, marital status, level of education, occupational, economic, part two consist of medical information was comprised of (7 ) items, and part three contain physical and psychosocial problems through Hamilton anxiety scale consist of 84 items.
Validity and Reliability: The content validity of the instrument was established through a panel of (14) experts, the reliability of the items were based on the internal. consistency of the questionnaire was assessed by calculating Cronbach s' Coefficient alpha which as= 0.73.
Statistical Analysis: The researchers used the appropriate statistical methods for data analysis which include the descriptive data analysis, and inferential data analysis.
Results:
Table1: Distribution of the Study Sample by Socio- Demographic Characteristics (NO. =50)
No. Variable Frequency Percent%
1 Gender
1.1 Male 27 54.0
1.2 Female 23 46.0
2.1 18-27 8 16.0
2.2 28-37 8 16.0
2.3 38-47 9 18.0
2.4 48-57 14 28.0
2.5 58 and over 11 22.0
Mean ± SD 3.14 ± 1.396
3 Marital status Frequency Percent%
3.1 Single 9 18.0
3.2 Married 41 82.0
4. Level of education Frequency Percent% 4.1 Not read and not writes 11 22.0
4.2 Read and writes 1 2.0
4.3 Primary school Graduate 19 38.0 4.4 Intermediate school Graduate 6 12.0 4.5 Secondary school of Graduate 9 18.0
4.6 Graduate Institute 2 4.0
4.7 School graduate and above 2 4.0 5 Employments Frequency Percent%
5.1 Government employee 13 26.0
5.2 Private sector employees 13 26.0
5.3 Retired not works 3 6.0
5.4 Housewife 21 42.0
6 Socio-economic status Frequency Percent%
6.1 High score 42 84.0
6.2 Middle score 6 12.0
6.3 Low score 2 4.0
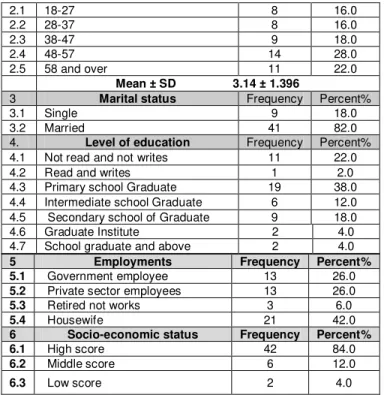
Table 1: Shows the males that 54.0%, High percent of them 28.0% at 48-57 years old, 82.0% were married 38.0% of them at Graduated from primary school, 42.0% house wife, and majority of them 84.0% were high score of socio-economic status.
Table 2.Medical History of the Study Sample
No. Variable Frequency Percent%
1 Causes of disease
1.1 Trauma 21 42.0
1.2 Osteoporosis from medication 26 52.0 1.3 Osteoporosis from genetic 1 2.0
1.4 Arthritis 2 4.0
2. Duration of disease Frequency Percent% 2.1 From 6 month to one year 32 64.0 2.1. From 1 year and more 18 36.0
3. Smoking Frequency Percent%
3.1 Yes 33 66.0
3.2 No 17 34.0
4. Drinking Alcohol Frequency Percent%
4.1 Yes 3 6.0
4.2 No 47 94.0
5. History of disease Frequency Percent%
5.1 Not have 15 30.0
5.2 Diabetes 9 18.0
5.3 Hypertension 4 8.0
5.4 Chronic allergy 9 18.0
5.5 Diabetes, and hypertension 20 40.0
5.6 Diabetes, hypertension, hypothyroidisms 2 4.0
6. History of Drugs Frequency Percent%
6.1 Analgesic drug 18 36.0
6.2 Allergic drug 6 12.0
6.3 Analgesic drug, and hypertensive
drugs 7 14.0
6.4 Analgesic drug , and diabetes
drug 9 18.0
6.5 Analgesic, hypertensive and
diabetes drug 6 12.0
6.6 Thyroxin 4 8.0
7 Number of Operation Frequency Percent%
7.1 First Operation 45 90.0
7.2 Second Operation 5 10.0
Total 50 100.0
Table 2: Presented that the high percent of them 52.0% osteoporosis , 54.0% were problem from 6 month to one year, 66.0% of them were smoker, 40.0% of them have diabetes & hypertension, 36.0% of them received analgesic drug, and 90% of them at a first hip replacement operation.
Table 3: Comparison between Pre and Post-Operative Physical Patients Symptoms
Domains Pre Operative
Symptoms
Post Operative Symptoms
1 Physical
Problems Not Present Moderate sever Not Present moderate sever
1.1 Sensory
Symptoms F. % F. % F. % F. % F. % F. %
1.1.1 Tinnitus 3 6.0 26 52.0 21 42.0 45 90.0 5 10.9 0 0.0
1.1.2 Blurring of vision 7 14.0 26 52.0 17 34.0 32 64.0 18 36.0 0 0.0
1.1.3 Hot and cold
flushes 8 14.0 26 52.0 16 32.0 45 90.0 5 10.0 0 0.0
1.1.4 Feelings of
weakness 26 52.0 20 40.0 4 8.0 43 86.0 7 14.0 0 0.0
1.1.5 Pricking sensation 0 0.0 0.0 0.0 50 100.0 46 92.0 4 8.0 0 0.0
1.2 Muscular
Symptoms F. % F. % F. % F. % F. % F. %
1.2.1 Pains and aches 19 38.0 25 50.0 6 12.0 50 100.0 0 0.0 0 0.0
1.2.2. Twitching,
stiffness 12 24.0 29 48.0 9 18.0 50 100.0 0 0.0 0 0.0
49
1.2.4. Grinding of teeth 2 4.0 12 24.0 36 72.0 42 84.0 7 14.0 1 2.0
1.2.5 Unsteady voice 4 8.0 23 46.0 23 46.0 36 72.0 14 28.0 0 0.0
1.2.6. Increased muscular tone 12 24.0 31 62.0 7 14.0 50 100.0 0 0.0 0 0.0
1.3. Vascular
Symptoms F. % F. % F. % F. % F. % F. %
1.3.1 Tachycardia 0 0.0 17 34.0 33 66.0 38 76.0 12 24.0 0 0.0
1.3.2 Pain in chest 4 8.0 21 42.0 25 50.0 34 68.0 14 28.0 2 4.0
1.3.3 Palpitations 8 16.0 25 50.0 17 34.0 25 50.0 18 36.0 7 14.0
1.3.4 Throbbing of vessels 10 20.0 19 38.0 21 42.0 32 64.0 15 30.0 3 6.0
1.3.5 Fainting feelings 13 26.0 27 54.0 10 20.0 23 46.0 24 48.0 3 6.0
1.4 Respiratory
Symptoms F. % F. % F. % F. % F. % F. %
1.4.1 Constriction in
chest 2 4.0 30 60.0 18 36.0 35 70.0 15 30.0 0 0.0
1.4.2 Choking feelings 4 8.0 21 42.0 25 50.0 33 66.0 17 34.0 0 0.0
1.4.3 Sighing 30 60.0 13 26.0 7 14.0 6 12.0 39 78.0 5 10.0
1.4.4 Dyspnea 2 4.0 20 40.0 28 56.0 39 78.0 11 22.0 0 0.0
4 Continuous table 3
Domains
Pre-Operative Symptoms Post-Operative Symptoms
Physical
Problems Not Present moderate sever Not Present moderate sever
1.8 skin symptoms F. % F. % F. % F. % F. % F. %
1.8.1 Redness of the skin 1 2.0 21 42.0 28 56.0 45 90.0 5 10.0 0 0.0
1.8.2 Bedsore 1 2.0 9 18.0 40 80.0 42 84.0 5 10.0 3 6.0
1.8.3 Dry skin 0 0.0 20 40.0 30 60.2 34 68.0 15 30.0 1 2.0
1.8.4 Itchy skin 4 8.0 17 34.0 29 58.6 43 86.0 5 10.0 2 4.0
Cannot do it assistance Do with I can do it Cannot do it assistance Do with I can do it
1.9 Hip symptoms joint F. % F. % F. % F. % F. % F. %
1.9.1
Powerful do activities such as running, lifting heavy objects
44 88.0 4 8.0 2 4.0 1 2.0 41 82.0 8 16.0
1.9.2
Walking more than a kilometer or climb stairs
38 76.0 8 16.0 4 8.0 1 2.0 31 62.0 18 36.0
1.9.3
Bending or standing up straight
27 54.0 21 42.0 2 4.0 0 0.0 18 36.0 32 64.0
1.9.4 Bathing 10 20.0 29 58.0 11 22.0 0 0.0 4 8.0 46 92.0
1.9.5 Getting dressed 11 22.0 29 58.0 10 20.0 0 0.0 5 10.0 45 90.0
1.9.6 Go to use the
toilet 11 22.0 27 54.0 12 24.0 0 0.0 4 8.0 46 92.0
1.9.7 The rise of the
bed or get off of it 7 14.0 30 60.0 13 26.0 0 0.0 4 8.0 46 92.0
5 Table 3 :Shows the comparison between pre-and post operative physical symptoms which as high percent of them have moderate symptoms for sensory problems at pre-operative and this symptoms was little at post operative, majority of symptoms for muscles was sever at pre-operative, but disappeared at post operative, vascular symptoms was sever at pre-operative but reduced at post operative, most of respiratory symptoms items was sever and little at post operative , high percent of gastrointestinal was sever, but at post operative was disappeared,
6 Table 4: Comparison between Pre and Post-Operative Psychosocial Patients Symptoms
Domains
Pre-Operative Symptoms Post-Operative Symptoms
2 Psychosocial Symptoms Not Present Moderate sever Not Present moderate sever
2.1 Anxious mood F. % F. % F. % F. % F. % F. %
2.1.1 Worries 2 4.0 22 44.0 26 52.0 46 92.0 4 8.0 0 0.0
2.1.2 Anticipation of the worst 4 8.0 21 42.0 25 50.0 40 80.0 10 20.0 0 0.0
2.1.3 Fearful anticipation 5 10.0 13 26.0 32 64.0 40 80.0 10 20.0 0 0.0
2.1.4 Irritability 26 52.0 18 36.0 6 12.0 40 80.0 10 20.0 0 0.0
2.2 Tension F. % F. % F. % F. % F. % F. %
2.2.1 Feelings of tension 30 60.0 15 30.0 5 10.0 49 98.0 1 2.0 0 0.0
2.2.2. Fatigability 39 78.0 11 22.0 0 0.0 39 78.0 11 22.0 0 0.0
2.2.3. Startle response 4 8.0 9 18.0 37 74.0 43 86.0 7 14.0 0 0.0
2.2.4. Moved to tears easily 25 50.0 15 30.0 10 20.0 41 82.0 9 18.0 0 0.0
2.2.5 Trembling 11 22.0 9 18.0 30 60.0 35 70.0 10 20.0 5 10.0
2.2.6. Inability to relax 7 14.0 41 82.0 2 4.0 44 88.0 6 12.0 0 0.0
2.3. Fears F. % F. % F. % F. % F. % F. %
2.3.1 Of dark 3 6.0 4 8.0 43 86.0 43 86.0 4 8.0 3 6.0
2.3.2 Of strangers 0 0.0 11 22.0 39 78.0 40 80.0 10 20.0 0 0.0
2.3.3 Of being left alone 5 10.0 16 32.0 29 58.0 32 64.0 13 26.0 5 10.0
2.3.4 Of animals 1 2.0 12 24.0 37 74.0 36 72.0 13 26.0 1 2.0
2.3.5 Of traffic, of crowds 8 16.0 18 36.0 24 48.0 28 56.0 15 30.0 7 14.0
2.4 Insomnia F. % F. % F. % F. % F. % F. %
2.4.1 Difficulty in falling asleep 14 28.0 27 54.0 9 18.0 50 100.0 0 0.0 0 0.0
2.4.2 Broken sleep 11 22.0 29 58.0 10 20.0 49 98.0 1 2.0 0 0.0
2.4.3 Unsatisfying sleep 22 44.0 19 38.0 9 18.0 49 98.0 1 2.0 0 0.0
2.4.4 Fatigue on waking 37 74.0 9 18.0 4 8.0 46 92.0 4 8.0 0 0.0
2.4.5 Dreams, nightmares, night
terrors 8 16.0 12 24.0 30 60.0 49 98.0 1 2.0 0 0.0
Continuous table 4:
Domains
Pre-Operative Symptoms Post-Operative Symptoms
2 Psychosocial Symptoms Not Present Moderate sever Not Present moderate sever
2.5 memory F. % F. % F. % F. % F. % F. %
2.5.1 Difficulty remembering 39 78.0 9 18.0 2 4.0 39 78.0 11 22.0 0 0.0
2.5.2 Poor memory 37 74.0 11 22.0 2 4.0 37 74.0 11 22.0 2 4.0
2.6 Depressed mood F. % F. % F. % F. % F. % F. %
2.6.1 Loss of interest 5 10.0 10 20.0 35 70.0 39 78.0 9 18.0 2 4.0
2.6.2. Lack of pleasure in hobbies 5 10.0 17 34.0 28 56.0 32 64.0 13 26.0 5 8.0
2.6.3. Early waking 11 22.0 31 62.0 8 16.0 23 46.0 26 52.0 1 2.0
2.6.4. Transmission case from bad to fare worse 32 64.0 16 32.0 2 4.0 50 100.0 0 0.0 0 0.0
2.7. Behavior at interview F. % F. % F. % F. % F. % F. %
2.7.1 Fidgeting 2 4.0 28 56.0 20 40.0 48 96.0 2 4.0 0 0.0
2.7.2 Tremor of hands 2 4.0 13 26.0 35 70.0 36 76.0 12 24.0 2 4.0
2.7.3 Furrowed brow 6 12.0 31 62.0 13 26.0 45 90.0 3 6.0 2 4.0
2.7.4 Strained face 4 8.0 24 48.0 22 44.0 46 92.0 4 8.0 0 0.0
2.7.5 Sighing or rapid respiration 1 2.0 13 26.0 36 72.0 41 82.0 9 18.0 0 0.0
2.7.6 Facial pallor 4 8.0 37 74.0 9 18.0 48 96.0 2 4.0 0 0.0
2.7.7 Swallowing the saliva 2 4.0 20 40.0 28 56.0 46 92.0 4 8.0 0 0.0
2.7.8 Yawn 3 6.0 10 20.0 37 74.0 48 96.0 2 4.0 0 0.0
2.7.9 Sudden movements of the joints 1 2.0 9 18.0 40 80.0 42 84.0 8 16.0 0 0.0
2.7.10 Dilated pupils 0 0.0 34 68.0 16 32.0 50 100.0 0 0.0 0 0.0
2.7.11 Bulging eyes 11 22.0 35 70.0 4 8.0 50 100.0 0 0.0 0 0.0
51 was sever at pre-operative, and reduced at post-operative, insomnia was moderate at pre-operative, and little at post-operative, depression was sever at pre-operative, and at post-operative was moderate, abnormal behaviors of patient was clear at pre operative but disappeared at post operative.
Table 5: Statistical Differences between the Gender and Post – Operative Physical Symptoms
Post Physical Symptoms gender Frequency Mean SD df t. test Sig.
P≤0.05
Sensory Symptoms male 27 14.4074 .84395 48 1.400 0.091
female 23 14.0000 1.20605 38.512 1.361
Muscular Symptoms male 27 17.6667 .55470 48 1.608 0.160
female 23 17.3913 .65638 43.339 1.586
Vascular Symptoms male 27 13.7778 1.39596 48 3.538 0.000
female 23 11.5217 2.95219 30.250 3.359 H.S.
Respiratory Symptoms male 27 10.4444 1.39596 48 1.390 0.020
female 23 9.8261 1.74908 41.911 1.365 S.
Gastrointestinal symptoms) male 27 30.3333 1.61722 48 .265 0.043
female 23 30.1739 2.58760 35.729 .256 S.
Genitourinary symptoms male 27 7.7778 1.50214 48 -2.654 0.000
female 23 9.4348 2.80950 32.394 -2.536 H.S
Autonomic symptoms male 27 16.5926 1.18514 48 1.727 0.757
female 23 15.9130 1.59297 40.095 1.687
Skin symptoms male 27 11.6667 .67937 48 2.479 0.000
female 23 10.5652 2.19143 25.604 2.317 H.S
Hip joint symptoms male 27 19.0000 .78446 48 .896 0.000
female 23 18.5217 2.64351 25.304 .837 H.S
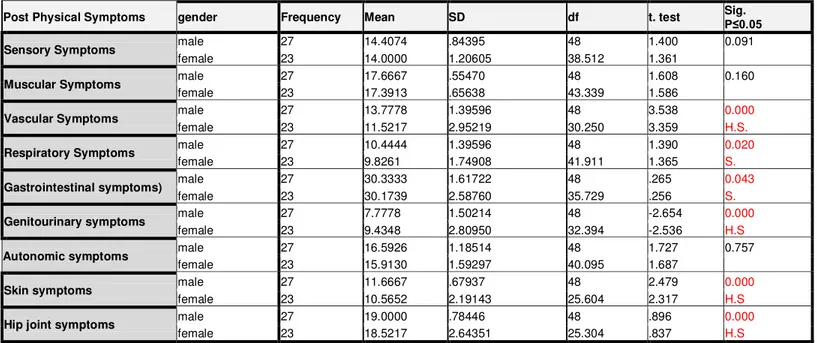
Table 5: demonestrate the differences between physical symptoms at post operative and pt gender was significant at vascular, respiratory, gastrointestinal, genitourinary, skin, and hip joint symptoms, and the remains not significant at P≤0.05 value.
Table 6: Comparative between post Physical Symptoms and Age
Domains Sum of Squares df Mean Square F Sig.
P≤0.05
Sensory Symptoms 8.348 4 2.087 2.123 0.093
44.232 45 .983
52.580 49
Muscular Symptoms 1.738 4 .435 1.172 0.336
16.682 45 .371
18.420 49
Vascular Symptoms 52.643 4 13.161 2.341 0.069
252.977 45 5.622
305.620 49
Respiratory symptoms
28.225 4 7.056 3.360 0.017
94.495 45 2.100 H.S.
122.720 49
Gastrointestinal symptoms 24.842 4 6.211 1.465 0.229
190.778 45 4.240
215.620 49
Genitourinary symptoms
111.223 4 27.806 8.062 0.000
155.197 45 3.449 H.S.
266.420 49
Autonomic symptoms
6.955 4 1.739 .859 0.496
91.125 45 2.025
98.080 49
skin symptoms 39.93592.785 454 9.9842.062 4.842 0.002H.S.
132.720 49
Hip joint symptoms
46.210 4 11.552 4.114 0.006
126.370 45 2.808 H.S.
172.580 49
Table 6: Presented the post physical symptoms and comparison with age which as significantly at Genitourinary, hip joint,
Table7: Comparative between Post Physical Symptoms and Duration of Illness
Sum of Squares df Mean Square F Sig.
P≤0.05
Sensory Symptoms .361 1 .361 .332 0.567
52.219 48 1.088
52.580 49
Muscular Symptoms 1.590 1 1.590 4.535 0.038
16.830 48 .351 S.
18.420 49
Vascular Symptoms 1.620 1 1.620 .256 0.615
304.000 48 6.333
305.620 49
Respiratory symptoms
2.067 1 2.067 .822 0.369
120.653 48 2.514
122.720 49
Gastrointestinal symptoms 2.457 1 2.457 .553 0.461
213.163 48 4.441
215.620 49
Genitourinary symptoms
24.267 1 24.267 4.810 0.033
242.153 48 5.045 S.
266.420 49
Autonomic symptoms
.000 1 .000 .000 0.993
98.080 48 2.043
98.080 49
skin symptoms .720 1 .720 .262 0.611
132.000 48 2.750
132.720 49
Hip joint symptoms
.761 1 .761 .212 0.647
171.819 48 3.580
172.580 49
Table: Shows the comparison between post physical symptoms and duration of illness which as significant with Muscular Symptoms, and significant with Genitourinary symptoms, and they remains not significant, and the remains not significant at
P≤0.05.
Discussion
Throughout the course of the data analysis of present study,
the findings showed that the most of patients’ were males
(54.0%), and female 46.0%.This finding agree with (Mohamed and Mecheser, 2012), revealed in their study that 53.3% of the sample were females, 46.7% were males. The present study revealed that the patients at age 48-57 years old. This finding is agree with (Innmann et.al, 2015), which indicated that mean age 52 years (range, 21-60 years). Eighty two percent of study sample was married. This finding agree with study done by (Mohamed and Mecheser, 2012), which indicated that 80% married from the total sample with total hip replacement patients. Thirty eight percent of study sample was graduated from primary school. This finding is similar to result obtained from the study done by (Mohamed and Mecheser, 2012)they mention in their study from the total of sample 50% with primary level of education. The present study indicated that the high percent of them 52.0% have osteoporosis. This finding is similar to result obtained from the study done by (Balasubramanian et.al, 2014), founded that the percentage of osteoporosis 30% of them in women, 15% of them in men. In addition (Hagiwara et.al, 2015), they concluded in their study that corticosteroid therapy and osteoporosis are independent risk factors for cartilage degeneration at the femoral head. The findings of present study revealed that the 50% have hip problem from 6 month to one year. This finding is similar to result obtained from the study done by (Ban et.al, 2014), they finds in their study That the majority of their sample have hip
problems since 11-74 month. Sixty six percent of study sample was smokers. These result supported by (Anne et.al, 2014), they finds in their study patients with total hip replacement (37%) were ever smokers.
Conclusions and Recommendations:
A high proportion of the study sample had mild symptoms of the problems of sensory before the operation and the symptoms decrease after the operation, and most of the muscle problems before the operation was severe, but after the operation, the symptoms decrease, and for the symptoms of the blood vessels before the operation was severe, but after the operation a few significantly, and respiratory problems was before operation severe and decrease after the operation. The researchers recommend Create a re-qualification in the ward to provide a training program to help the patient instructions apply to them before disposal to prevent the complications of dislocation which is very serious, and the reduction of fear, and thus reduce the psychosocial symptoms.
References:
53 [2] Okoro, T.; Lemmey, AB.; Maddison, P.; and Andrew,
JG.: An appraisal of rehabilitation regimes used for improving functional outcome after total hip replacement surgery, Journal of Sports Medicine, Arthroscopy, Rehabilitation, Therapy & Technology, Vol.4, 2012, PP:2-8.
[3] Goyal, R.; Singh S.; Shukla, RN.; and Singhal, A.: Management of a case of ankylosing spondylitis for total hip replacement surgery with the use of ultrasound-assisted central neuraxial blockade, Indian Journal of Anaesthesia, Vol.57(1), 2013, PP:69-71.
[4] Gossec, L.; Paternotte, S.; Maillefert, JF.; Combescure, C.; Conaghan, PG.; Davis, AM.; Gunther, KP.; Hawker, G.; Hochberg, M.; Katz, JN.; Kloppenburg, M.; Lim, K.; Lohmander, LS.; Mahomed, NN.; March, L.; Pavelka, K.; Punzi, L.; Roos, EM.; Sanchez-Riera, L.; Singh, JA.; Suarez-Almazor, ME.; Dougados, M.: The role of pain and functional impairment in the decision to recommend total joint replacement in hip and knee osteoarthritis: an international cross-sectional study of 1909 patients. Report of the OARSI-OMERACT Task Force on total joint replacement, National Library of Medicine, Vol. 19(2), 2010, pp:147-54.
[5] Javed, A.; O’Donnell, JM.: Arthroscopic femoral osteochondroplasty for cam femoroacetabular impingement in patients over 60 years of age, The Bone & Joint Journal, vol. 93(3), 2011, pp:326-331.
[6] Arden, NK.; Kiran, A.; Judge, A.; Biant, LC.; Javaid, MK.; Murray, DW.; Carr, AJ.; Cooper, C.; Field, RE.: What is a good patient reported outcome after total hip replacement?, National Library of Medicine, Vol. 19(2), 2011, pp: 155-62.
[7] Apold, H.; Meyer, HE.; Espehaug, B.; Nordsletten, L.; Havelin, LI.; Flugsrud, GB.: Weight gain and the risk of total hip replacement a population-based prospective cohort study of 265,725 individuals, Osteoarthritis and Cartilage Journal, Vol.19(7), 2011, pp:809–815.
[8] Mohamed, SJ.; Mecheser, AE.: Assessment of
Patients’ Knowledge Toward Total Hip Replacement Home – Care, Iraqi J Pharm Sci, Vol. 21(1), 2012, PP:30-40.
[9] Innmann, MM.; Weiss, S.; Andreas, F.; Merle, C.; Streit, MR.: Sports and physical activity after cementless total hip arthroplasty with a minimum follow-up of 10 years, National Library of Medicine, 2015.
[10]Balasubramanian, A.; Tosi, LL.; Lane, J.; Douglas, R.; Ho, PR.; O'Malley, CD.: Declining rates of osteoporosis management following fragility fractures in the U.S., 2000 through 2009, Bone and Joint Surgery, vol. 96(7), 2014, p:52.
[11]Hagiwara, S.; Nakamura, J.; Watanabe, A.; Kishida, S.; Ohtori, S.; Omae, T.; Miyamoto, S.; Orita, S.; Takahashi, K.: Corticosteroids and low bone mineral density affect hip cartilage in systemic lupus erythematosus patients: Quantitative T2 mapping, National Library of Medicine, 2015.
[12]Ban, Z.; Huang, F.; Gu, Q.; Xu, B.; Li, Y.; Li, Z.: Methods of offside reconstruction in total hip arthroplasty for severe osteoarthritis, National Library of Medicine, vol. 28(8), 2014, pp:947-50.