A MODELING APPROACH TO ESTABLISH STRATEGIES FOR MAIZE SILAGE PRODUCTION IN THE MICRO-REGION OF PELOTAS, BRAZIL
TALES A. AMARAL1, RICARDO N. F. G. P.BRAGA2, ANA CLÁUDIA RODRIGUES DE LIMA3 and CAMILO DE L. T. DE ANDRADE4
1PhD in Family Farming Systems (SPAF) of the Federal University of Pelotas, Pelotas, Brazil.
e-mail: [email protected]
2Assistant Professor, Department of Science and Biosystems Engineering of the Superior Institute
of Agronomy (ISA), Lisbon, Portugal. e-mail: [email protected]
3Professor, Department of Soils, School of Agronomy Eliseu Maciel, Federal University of Pelotas, Pelotas, Brazil.
e-mail: [email protected]
4 Researcher A, Irrigation Engineering/Modeling, Embrapa Maize and Sorghum, Sete Lagoas, Brazil.
e-mail: [email protected]
Revista Brasileira de Milho e Sorgo, v.16, n.3, p. 536-555, 2017
ABSTRACT - The objective of this study was to evaluate some crop management strategies to improve silage
production by family farmers in the micro-region of Pelotas, southern State of Rio Grande do Sul (RS), Brazil. The seasonal analysis tool of de CSM-CERES-Maize model was used to assess aboveground dry biomass production under rainfed conditions. The simulations comprised scenarios involving four cultivars (Amarelão, AL 30, AG 5011 and AG 122), six nitrogen (N) fertilization strategies, 52 sowing dates, and 21 years of daily weather data. Silage productivity and quality were assessed, and a sowing window was established for each one of the cultivars based on this information. Regardless of the N rate and cultivar, sowings performed between June 26 and December 19 were not at risk of exceeding the deadline for silage harvesting in the region. For sowing occurred on December 19, regardless of the N rate, the average productivity of silage and the average amount of energy per unit area were lower for the creole variety Amarelão. For the same sowing date the average values of energy per unit of biomass weight indicated good silage quality, for all cultivars regardless of the N rate.
Keywords: family farming, DSSAT, aboveground biomass, Zea mays L.
ABORDAGEM DE MODELAGEM PARA ESTABELECER ESTRATÉGIAS DE PRODUÇÃO DE SILAGEM NA MICRORREGIÃO DE PELOTAS, BRASIL
RESUMO - O objetivo deste estudo foi avaliar estratégias de manejo para melhorar a produção de silagem pelos
agricultores familiares na microrregião de Pelotas, sul do Rio Grande do Sul (RS), Brasil. A ferramenta de análise sazonal do modelo CSM-CERES-Maize foi usada para avaliar a produção de fitomassa seca em condições de sequeiro. Foi considerado nas simulações um cenário com quatro cultivares (Amarelão, AL 30, AG 5011 e AG 122); seis estratégias de adubação nitrogenada; 52 épocas de semeadura; e 21 anos de dados meteorológicos diários. A produtividade e a qualidade da silagem foram avaliadas e, com base nessas informações, uma janela de semeadura foi estabelecida para cada uma das cultivares. Independentemente da dose de nitrogênio e cultivar, as semeaduras realizadas entre 26 de junho e 19 de dezembro não correm risco de exceder o prazo para a colheita de silagem na região. Para semeadura realizada em 19 de dezembro, independentemente da taxa de N, a produtividade média de silagem e a quantidade média de energia por unidade de área foram menores para a variedade crioula Amarelão. Para esta mesma época de semeadura, os valores médios de energia por unidade de peso de fitomassa seca indicaram boa qualidade de silagem, para todas as cultivares, independentemente da dose de N.
Maize is one of the most widely used crops for silage production because of its easiness of cultivation, high mass production, easiness of fermentation in the silo, good energy value and high animal consumption. It can provide bulky feed for the herds during the seasonality of the pasture (Fancelli & Dourado Neto, 2000; Cruz et al., 2001).
The occurrence of low temperatures and frosts affects the quantity and quality of pastures. In order to meet animals’ feed needs during these shortages, maize silage has been widely used (Mittelmann et al., 2005). Usually, farmers from southern State of Rio Grande do Sul (RS), Brazil, cultivate maize aiming at silage production. However, there are doubts among producers about the best cultivar, nitrogen rates and sowing dates to be used.
The agronomic characterization of the genetic material available is important to guide the choice of cultivars that provide high biomass yield and high nutritional value (Santos et al., 2010). According to Almeida Filho et al. (1999), the identification of cultivars adapted to the conditions in which they will be grown contributes to higher maize yields. It is also important to note that, in addition to genetics, yield is influenced by seed quality, sowing date, plant population, soil cultivation, correction and fertilization and weeds, pests and diseases control, among others.
The maize response, in terms of biomass production and grain yield, depends on a number of factors that interact one to another. Some are dynamic factors, such as the climatic conditions. Modeling can be a useful tool in this case, since in addition to enabling the simulation of various management scenarios, it allows the understanding of the dynamics of the processes involved in the system and the isolation of the effect of some of these factors
in the crop yield. The crop growth model, DSSAT (Decision Support System for Agrotechnology Transfer) (Jones et al., 2003), outstands because it enables the analysis of water and nutrient dynamics and their effect on crop yields and the profitability of farms. Several studies at national and international levels have shown the efficiency of the DSSAT model in helping to make management decisions. Amaral et al. (2009) used results of simulations with the CSM-CERES-Maize model to develop a methodology to assist in decision making regarding the maize sowing period for the conditions of Sete Lagoas, in the State of Minas Gerais (MG), Brazil. Liu et al. (2011) used the same model to simulate maize yield and nitrogen and water dynamics in the soil over 50 years of maize production, with and without fertilizer application. The model was evaluated by comparing simulated and observed maize yield and soil N for conditions in Woodslee, Ontario, Canada. In Florida, He et al. (2012) used the CERES-Maize model to simulate sweet corn yield and accumulated nitrogen leaching in order to determine an alternative nitrogen and irrigation management strategy. Andrade et al. (2012) used the model to evaluate yield and profitability of a rainfed maize production system for small farmers, using cattle manure as a source of N. In Sete Lagoas (MG), Brazil, Silva et al. (2013) used the CSM-CERES-Maize model to assess the sustainability of long-term use of swine manure in a rainfed maize crop. The effect of different nitrogen management strategies, including swine manure, on nitrate leaching was evaluated. Paixão et al. (2013) used simulated yield obtained with the CSM-CERES-Maize model to establish sowing windows for rainfed maize production in counties of the State of Minas Gerais, Brazil. The results agreed well with those from the Ministry of Agriculture of Brazil, with the advantage
of providing a yield estimate. However, few studies report the use of the model in silage production studies. A successful example was described by Braga et al. (2008), in which the CERES-Maize model was employed in order to implement accurate and quantified lines of decision support for tactical optimization of maize silage production in the agricultural system of Entre Douro and Minho, in Portugal.
Thus, the main objective of this study was to use the CSM-CERES-Maize model to derive management strategies to improve maize silage production in southern Rio Grande do Sul, Brazil. The specific objectives were: a) evaluate the response of four maize cultivars sown in different dates and receiving different nitrogen rates; b) propose a management strategy to obtain high yield associated with better silage quality.
Materials and Methods
The study was carried out in conditions representing a family farm, located at the Canguçu County, micro-region of Pelotas, southern Rio Grande do Sul (RS), Brazil (31o 23’ 57,6’ South 52o 36’ 23,3
West, elevation 314 m). A farmer representing the family farming system of the region was chosen. He has been growing maize for silage production in his property for several years.
Four cultivars were selected for this work: the triple-cross hybrid AG 5011; the double-cross hybrid AG 122; the open pollinated variety (OPV) AL 30; and the creole OPV Amarelão, which is widely used by family farmers in southern Rio Grande do Sul. All cultivars can be used for both grain and whole-plant silage (Cruz et al., 2011).
Soil characterization
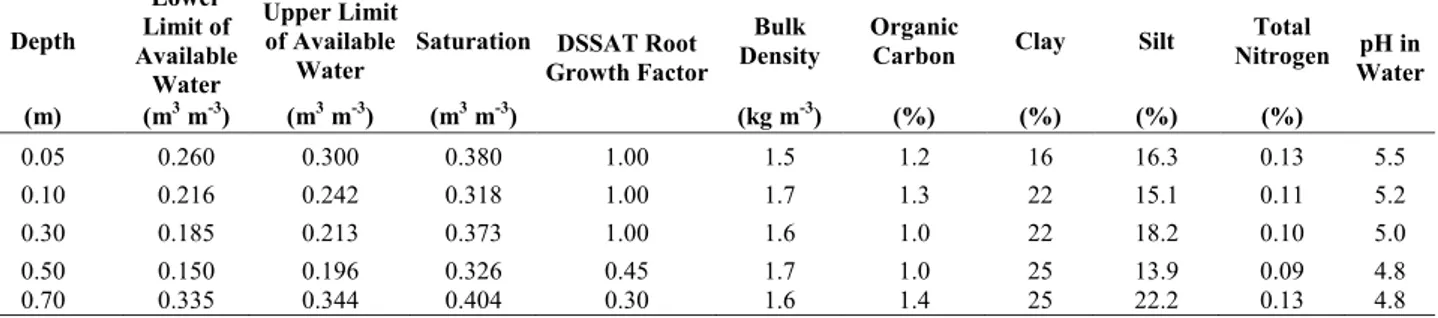
The representative soil of the region is an Argisol (Santos et al., 2013). Soil samples collected at 0-0.05; 0.05-0.10; 0.10-0.30; 0.30-0.50; 0.50-0.70 m were taken to the laboratory for physical and chemical analysis (Table 1). A detailed description of the soil profile can be found in Amaral (2015). Later on, the data was formatted as a DSSAT soil file.
Weather data
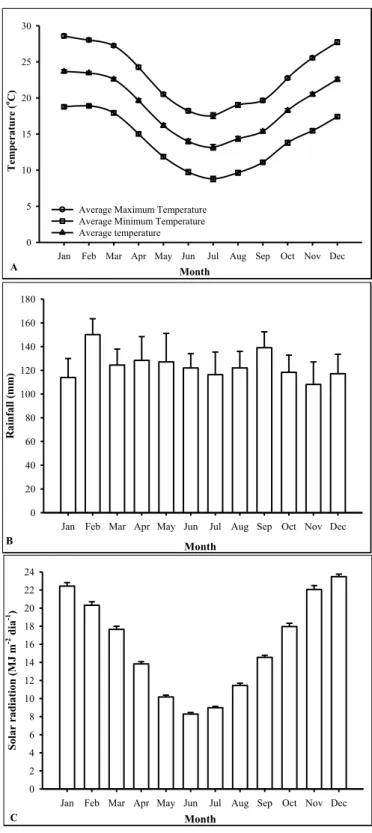
Daily data on rainfall, maximum and minimum air temperature and hours of sunlight for a period of 21 years (1992-2013) were obtained from a weather station located at the experimental farm of Embrapa Clima Temperado, Pelotas, Brazil (31° 42 ‘South, 52° 24’ W, altitude 57 m) (Figure 1A, 1B and 1C), which is approximately 50 km far from the family Table 1. Soil profile attributes of the family farm, Pelotas micro-region, Brazil. Pelotas-RS, 2017.
Depth Lower Limit of Available Water Upper Limit of Available
Water Saturation DSSAT Root Growth Factor Bulk
Density Organic Carbon Clay Silt Nitrogen pH in Total Water (m) (m3 m-3) (m3 m-3) (m3 m-3) (kg m-3) (%) (%) (%) (%) 0.05 0.260 0.300 0.380 1.00 1.5 1.2 16 16.3 0.13 5.5 0.10 0.216 0.242 0.318 1.00 1.7 1.3 22 15.1 0.11 5.2 0.30 0.185 0.213 0.373 1.00 1.6 1.0 22 18.2 0.10 5.0 0.50 0.150 0.196 0.326 0.45 1.7 1.0 25 13.9 0.09 4.8 0.70 0.335 0.344 0.404 0.30 1.6 1.4 25 22.2 0.13 4.8
Revista Brasileira de Milho e Sorgo, v.16, n.3, p. 536-555, 2017
Versão impressa ISSN 1676-689X / Versão on line ISSN 1980-6477 - http://www.abms.org.br farm in Canguçu-RS, Brazil. According to the
Köppen classification, the climate of the study site is humid subtropical (Cfa). The daily solar radiation was estimated from sunlight-hour data using the Angström-Prescott equation (Angström, 1924; Prescott, 1940). The maximum average temperature ranges from 28.6 °C in January to 17.6 °C in July; the minimum average temperature ranges from 18.9 °C in February to 8.8 °C in July, and the average daily temperature ranges from 23.7 °C in January to 13.2 °C in July (Figure 1A). Rainfall occurs in every month of the year. February is the wettest month, with an average rainfall of 150 mm, and November is the driest month, with an average rainfall of 108 mm. The average annual rainfall is 1,487 mm (Figure 1B). Maximum average values of solar radiation varying from 23.5 to 20.3 MJ m-2day-1
were observed from November to February; lower average radiation values of 8.3 and 9.03 MJ m-2
day-1, were observed in June and July, respectively
(Figure 1C).
Parameterization and evaluation of the CSM-CERES-Maize
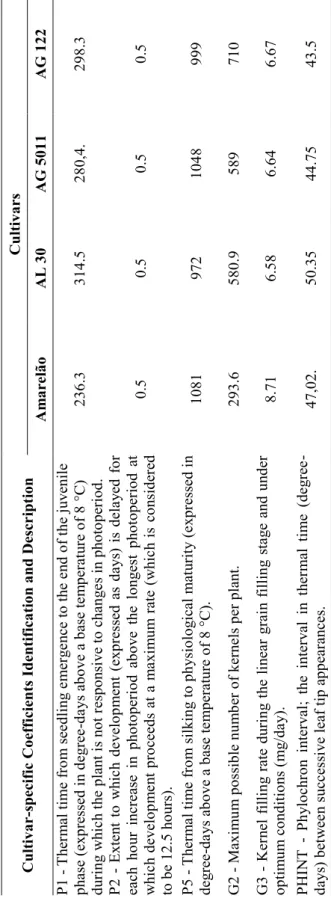
The CSM-CERES-Maize, version 4.5.1.023 (Hoogenboom et al., 2013) was used in the study. Field trials were carried out at Embrapa Clima Temperado experimental farm, in Pelotas, Brazil, to collect data for model parameterization (Table 2) of the four cultivars (Amarelão, AL 30, AG 5011 and AG 122). Crop management was such to avoid water and nutrient stresses. Additional data was collected at the family farm in Canguçu, State of Rio Grande do Sul, Brazil to evaluate the model. Details of the model parameterization and evaluation can be found at Amaral (2015).
Figure 1. Average monthly air temperature (A),
precipitation (B) and solar radiation (C) from 1992 to 2013, micro-region of Pelotas-RS, Brazil.
Month
Jan Feb Mar Apr May Jun Jul Aug Sep Oct Nov Dec
T em per atur e ( oC) 0 5 10 15 20 25 30
Average Maximum Temperature Average Minimum Temperature Average temperature A
Month
Jan Feb Mar Apr May Jun Jul Aug Sep Oct Nov Dec
R ain fa ll (m m ) 0 20 40 60 80 100 120 140 160 180 B Month
Jan Feb Mar Apr May Jun Jul Aug Sep Oct Nov Dec
So la r r adia tio n (M J m -2 di a -1) 0 2 4 6 8 10 12 14 16 18 20 22 24 C
Figure 1. Average monthly air temperature (A), precipitation (B) and solar radiation (C) from 1992 to 2013, micro-region of Pelotas-RS, Brazil.
T
ab
le
2.
DSS
AT c
ult
ivar
-spec
ific
coe
ffic
ients of t
he
ge
not
ype
s ev
aluate
d.
Pel
ot
as
-R
S, 2017.
Cultiv ar -s pecif ic Co ef ficient s I dentif ica tio n and Descr ipt io n Cultiv ars A m are lã o A L 3 0 A G 5011 A G 122 P1 - T her m al tim e fr om s ee dli ng e m er ge nce to th e en d o f th e ju ven ile ph ase ( ex pr ess ed in d eg ree -d ay s ab ov e a base te m per at ur e of 8 ° C) du rin g w hic h t he plan t i s n ot resp on si ve to ch an ge s in p ho to per io d. 236. 3 314. 5 280, 4. 298. 3 P2 - Ex ten t to w hic h d ev elo pm en t ( ex pr ess ed as day s) is d ela yed f or ea ch h ou r in cr ea se in p ho to per io d ab ov e th e lo ng es t ph ot op er io d at w hic h d ev elo pm en t p ro ce ed s at a m ax im um rate ( w hic h i s co ns id er ed to be 1 2. 5 h ou rs ). 0.5 0.5 0.5 0.5 P5 - T her m al tim e fr om s ilk in g to p hy sio lo gical m at ur ity (e xp ress ed in deg ree -d ay s ab ov e a base te m per atu re of 8 ° C) . 1081 972 1048 999 G2 - Ma xi m um p os sib le nu m ber o f k er nels per p lan t. 293. 6 580. 9 589 710 G3 - Ker nel filli ng r ate du rin g t he lin ea r g rai n fill in g stag e an d u nd er op tim um co nd itio ns (m g/d ay ). 8. 71 6. 58 6. 64 6. 67 PH INT P hy lo ch ro n in ter val ; th e in ter val i n th er m al tim e (d eg ree - day s) b et w ee n s ucc es si ve leaf tip ap pea ran ce s. 47, 02 . 50. 35 44. 75 43. 5Figu
re
1.
Ave
ra
ge
mont
hl
y a
ir tempe
ra
ture
(A
),
pr
ec
ipi
tation (B
) a
nd
solar
ra
diation (C)
fr
om 1992
to 2013, m
icr
o-re
gion of
Pe
lot
as
-RS
, B
ra
zil
.
Table 2. DSSA T cultivar-specific coefficients of the genotypes evaluated. Pelotas-RS, 2017.
Simulated scenarios
The seasonal analysis tool of DSSAT (Thornton & Hoogenboom, 1994) was used to evaluate the effect of inter-annual and seasonal variability of climate elements in the growth and development of maize for silage (dry mass of shoots) under rainfed conditions. Sowing was scheduled to occur weekly, beginning on August 1 and extending for 52 weeks to July 24. A row spacing of 0.8 m for all cultivars and sowing dates was assumed in the simulations. Plant population was five plants m-2, for OPV Amarelão
and AL 30, and six plants m-2, for the two hybrids,
AG 5011 and AG 122.
For all cultivars, six different nitrogen fertilizer management strategies were simulated: T1 - treatment without fertilization; T2 - 200 kg ha-1 of 8-28-16
(NPK), applied at sowing; T3 - 200 kg ha-1 of 8-28-16
(NPK), at sowing, plus 50 kg ha-1 of nitrogen (N) as
urea, side-dressed at 30 days after sowing (DAS); T4 - 200 kg ha-1 of 8-28-16 (NPK) at sowing, plus 100
kg ha-1 of N as urea side-dressed at 30 DAS; T5 - 200
kg ha-1 of 8-28-16 (NPK) at sowing, plus 150 kg ha-1
of N as urea, side-dressed at 30 DAS; T6 - 200 kg ha-1
of 8-28-16 (NPK) at sowing, plus 200 kg ha-1 of N as
urea, side-dressed at 30 DAS.
The model output data was statistically analyzed considering a factorial design with four cultivars, six mineral nitrogen rates, 52 sowing dates and 21 years of daily weather data, resulting in 26,208 (4x6x52x21) simulated values of silage, grain and cob yields.
Defining the sowing period
In order to determine the maize sowing window for silage production, the facts that winter
is a limiting factor for pastures development in the State of Rio Grande do Sul and that silage is required to supplement animal feed during this period were taken into consideration. Therefore, a deadline was adopted for harvesting silage: June 21, the beginning of winter season in Brazil. Sowing dates that could provide the silage harvest after this deadline were considered unfit.
Establishing maize harvest point for silage production
According to Braga et al. (2008), the CSM-CERES-Maize model simulates seven phenological stages of maize, which are germination, emergence, end of the juvenile stage, floral initiation, 75% flowering, beginning grain filling and physiological maturity. However, the model does not simulate the date for maize silage harvest. The maize silage harvest point is usually determined by evaluating the plant moisture content or the milk line position in the grain (Wiersma et al., 1993; Havilah et al., 1995). According to these authors, the general relationship between the milk line and the moisture of the maize plant for silage is as follows: plants with 66% humidity, when the milk line is located at 50% of the distance between the crown and the base of grain; plants with 63% moisture when the milk line is located at ¾ of the distance between the crown and the base of the grain; and plants with 60% moisture when the milk line is at the base of the grain and is not visible. This is the final stage regarded as the minimum moisture content for which good quality silage can be produced. In this work, it was assumed that the milk line is at ½ of the distance between the crown and the base grain, corresponding to 13 days before the physiological maturity. Therefore, this was
considered as the maize point of harvest for silage (Wiersma et al., 1993; Braga et al., 2008).
Silage quality
In addition to the aboveground dry mass productivity simulated by the model, the quality of the silage was also assessed, according to the methodology described in Braga et al. (2008). The maize aboveground dry mass yield was converted into MFU (Milk Forage Units). One MFU corresponds to the amount of energy that can be supplied by one kilogram of barley fed to a lactating cow above its maintenance energy requirements (Vermorel, 1988). Therefore, it was possible to calculate the energy values per unit weight of biomass (EPUWHB) (Eq. 1) and the energy per unit area (EPUA) (Eq. 2): EPUWHB = ETBR * EPUWE + (1-ETBR) * EPUWSL Equation 1 EPUA = CWAH * EPUWHB Equation 2
In which:
EPUWHB - Energy per unit weight of biomass (MFU kg-1)
ETBR - The ratio between maize ear and total biomass weights EPUWE - Energy per unit weight of maize ear (MFU kg-1)
EPUWSL - Energy per unit weight of stalks and leaves (MFU kg-1)
EPUA - Energy per unit area (MFU ha-1)
CWAH - Aboveground biomass (kg ha-1)
The conversion of simulated dry aboveground biomass yield into energy was based on the relationship between the quality of the silage and the proportion of grain in the total aboveground biomass (harvest index) (Cox et al., 1994). The experiment used 0.61 MFU kg-1 for energy concentrations of
stem + leaves (EPUWSL) and 1.08 MFU kg-1 for ears
(EPUWHB) was multiplied by the total aboveground biomass to determine the energy yield (EPUA) (Eq. 2).
Statistical analysis
Statistical evaluations were performed for sowing on December 19, which is the latest sowing date after which harvesting is likely to exceed June 21, which is considered the deadline for silage harvest in the region. Thus, an ANOVA was performed to the dry mass of shoots, energy per unit weight of biomass (EPUWHB) and energy per unit area (EPUA). Means were compared by the Scott and Knott test (Scott & Knott, 1974) at 5% probability.
Results and Discussion
Sowing dates
Considering the deadline of 21 June for harvesting the maize for silage in that region, it was observed that for all cultivars, and regardless of the nitrogen (N) dose, the sowing dates from June 26 to December 19 were not at risk of exceeding that deadline. For sowings performed between December 26 and June 19 the chance of exceeding the deadline, for the four cultivars and all N rates, ranged from 4.76% to 100% (Figures 2A, 2B, 2C and 2D). The four cultivars showed a similar performance pattern indicating that the latest sowing date throughout the growing season, without the risk of breaking the silage harvesting deadline, is December 19.
As expected, the simulated N rates (T1, T2, T3, T4, T5 and T6) did not influence the risk of breaking the harvesting deadline, since the crop anthesis and physiological maturity are controlled in the model by weather conditions such as photoperiod, air
temperature (Costa, 1994), and is not influenced by the N rate. This information is important to farmers since they may have a forecast of the yield and quality of the silage throughout the year, thus allowing some planning. According to Cruz et al. (2014), the best time for sowing maize for silage should be the same recommended for grain production. The Brazilian Agricultural Zoning of the Ministry of Agriculture (Brasil, 2017) recommends that for the cultivars AL 30, AG 5011 and AG 122 in the Canguçu County, the sowing dates should take place from October 1 to January 20. However, our results indicated a sowing window for maize silage production more restrictive as compared to that recommended for grain production. Other factors should also be considered, such as rain at harvest time, which can affect the silage quality and may compact the soil. In the State of Rio Grande do Sul, Brazil, the risk of frost should also be considered, because it can directly affect silage yield and quality.
Average yield and quality of silage
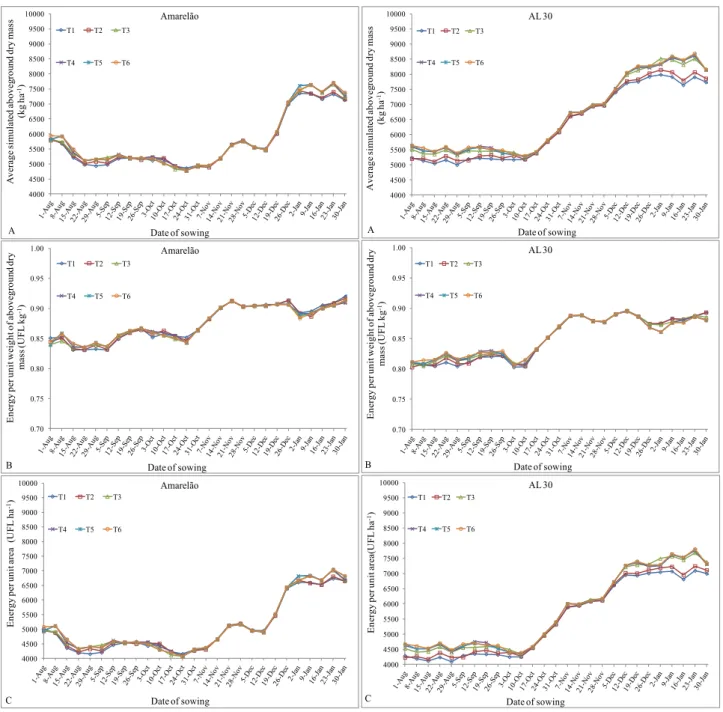
For all cultivars and sowing dates, variation was observed on the average silage yield. The average aboveground dry biomass for the open pollinated variety (OPV) Amarelão ranged from 4,779 to 7,710 kg ha-1, while for the OPV AL 30 it ranged from 4,995
to 8,976 kg ha-1. For the hybrids AG 5011 and AG
122 the aboveground dry biomass varied from 5,654 to 9,522 kg ha-1 and from 5,879 to 10,428 kg ha-1,
respectively(Figures 3A, 4A, 5A and 6A).
Nitrogen rates (treatments T1, T2, T3, T4, T5 and T6) did not significantly affect the silage yield of the creole OPV Amarelão for any sowing dates. For this cultivar, the silage yield rise for the treatment with the highest N rate (T6), as compared to the
Figure 2. Percent chance of overcoming the deadline (June 21) for silage harvest for the cultivars
Amarelão (A), AL 30 (B), AG 5011 (C) and AG 122 (D), for different nitrogen (N) rates and
sowing dates. T1 - 0 N; T2 - 200 kg ha
-1of 8-28-16 (N-P-K) at sowing; T3 - 200 kg ha
-1of 8-28-16
at sowing + 50 kg ha
-1of N side-dressed at 30 days after sowing (DAS); T4 - 200 kg ha
-1of 8-28-16
at sowing + 100 kg ha
-1of N side-dressed at 30 DAS; T5 -200 kg ha
-1of 8-28-16 at sowing + 150
kg ha
-1of N side-dressed at 30 DAS; T6 - 200 kg ha
-1of 8-28-16 at sowing + 200 kg ha
-1of N
side-dressed at 30 DAS.
0 10 20 30 40 50 60 70 80 90 100 Percen t ch an ce o f o verco mi ng th e d ead lin e (% ) Date of sowing Amarelão T1 T2 T3 T4 T5 T6 A 0 10 20 30 40 50 60 70 80 90 100 Percen t ch an ce of ov erco mi ng th e d ead lin e (% ) Date of sowing AL 30 T1 T2 T3 T4 T5 T6 B 0 10 20 30 40 50 60 70 80 90 100 Percen t ch an ce of ov erco mi ng th e d ead lin e (% ) Date of sowing AG 5011 T1 T2 T3 T4 T5 T6 C 0 10 20 30 40 50 60 70 80 90 100 Date of sowing AG 122 T1 T2 T3 T4 T5 T6 D Percen t ch an ce o f o verco mi ng th e d ead lin e (% )Figure 2. Percent chance of overcoming the deadline (June 21) for silage harvest for the cultivars Amarelão (A), AL 30 (B), AG 5011 (C) and AG 122 (D), for different nitrogen (N) rates and sowing dates. T1 - 0 N; T2 - 200 kg ha-1 of 8-28-16 (N-P-K) at sowing; T3 - 200 kg ha-1 of 8-28-16 at sowing + 50 kg ha-1 of N
side-dressed at 30 days after sowing (DAS); T4 - 200 kg ha-1 of 8-28-16 at sowing + 100 kg ha-1 of N side-dressed
at 30 DAS; T5 -200 kg ha-1 of 8-28-16 at sowing + 150 kg ha-1 of N side-dressed at 30 DAS; T6 - 200 kg ha-1
of 8-28-16 at sowing + 200 kg ha-1 of N side-dressed at 30 DAS.
treatment without N (T1), ranged from 0.12% to 10.1%, considering all sowing dates (Figure 3A). On the other hand, AL 30, AG 5011 and AG 122 cultivars, which present a higher genetic potential for biomass and grain production, responded to the different N rates. Aboveground dry biomass productivity increased from 0.6% to 23.7% for AL 30; from 0.06 to 21% for AG 5011 and from 0.7 to 23.7% for AG 122, respectively (Figures 4A, 5A and 6A). Sowing
on December 19, the deadline for maize silage sowing in the region did not produce significant variations in the silage yield considering all cultivars and N rates (Figures 3A, 4A, 5A and 6A). For the creole OPV Amarelão, the response to the use of N was very weak; when N was not used (T1) the average silage productivity was 6,005 kg ha-1 and with the maximum
N rate (T6), the dry biomass productivity was 6,079 kg ha-1, a rise of only 1.68% (Figure 3A). For the same
Figure 3. Average simulated aboveground dry
mass (A), energy per unit weight of
aboveground dry mass - EPUWHB (B) and
energy per unit area - EPUA (C), for different
nitrogen rates (T1, T2, T3, T4, T5 and T6) and
different sowing dates of the creole OPV
Amarelão.
Figure 4. Average simulated aboveground dry
mass (A), energy per unit weight of
aboveground dry mass - EPUWHB (B) and
energy per unit area - EPUA (C), for different
nitrogen rates (T1, T2, T3, T4, T5 and T6) and
different sowing dates of the OPV AL 30.
4000 4500 5000 5500 6000 6500 7000 7500 8000 8500 9000 9500 10000 A ve ra ge sim ula te d a bove gr ou nd dr y m ass (kg ha -1) Date of sowing Amarelão T1 T2 T3 T4 T5 T6 A 4000 4500 5000 5500 6000 6500 7000 7500 8000 8500 9000 9500 10000 Date of sowing AL 30 T1 T2 T3 T4 T5 T6 A Ave ra ge sim ula te d a bove gr ou nd dr y m as s (kg ha -1) 0.70 0.75 0.80 0.85 0.90 0.95 1.00 Ene rgy pe r unit w eight of above gr oun d dr y mas s (U FL k g -1) Date of sowing Amarelão T1 T2 T3 T4 T5 T6 B 0.70 0.75 0.80 0.85 0.90 0.95 1.00 Ene rgy pe r unit we ight of ab ove gr oun d dr y mas s(U FL k g -1) Date of sowing AL 30 T1 T2 T3 T4 T5 T6 B 4000 4500 5000 5500 6000 6500 7000 7500 8000 8500 9000 9500 10000 E nerg y p er u ni t area (U FL h a -1) Date of sowing Amarelão T1 T2 T3 T4 T5 T6 C 4000 4500 5000 5500 6000 6500 7000 7500 8000 8500 9000 9500 10000 Ene rgy pe r uni t a re a(U FL h a -1) Date of sowing AL 30 T1 T2 T3 T4 T5 T6 C
Figure 3. Average simulated aboveground dry mass (A), energy per unit weight of aboveground dry mass - EPUWHB (B) and energy per unit area - EPUA (C), for different nitrogen rates (T1, T2, T3, T4, T5 and T6) and different sowing dates of the creole OPV Amarelão.
Figure 4. Average simulated aboveground dry mass (A), energy per unit weight of aboveground dry mass - EPUWHB (B) and energy per unit area - EPUA (C), for different nitrogen rates (T1, T2, T3, T4, T5 and T6) and different sowing dates of the OPV AL 30.
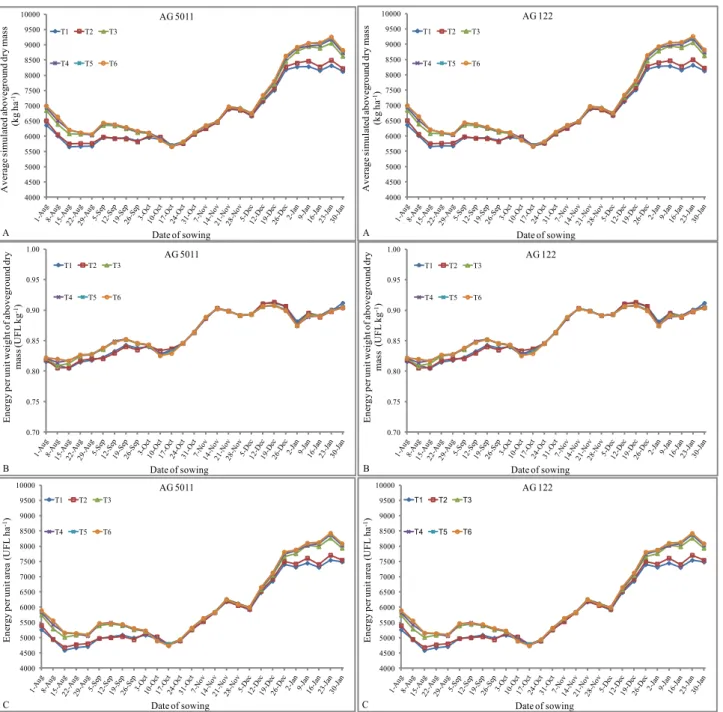
Figure 5. Average simulated aboveground dry mass (A), energy per unit weight of aboveground dry mass - EPUWHB (B) and energy per unit area - EPUA (C), for different nitrogen rates (T1, T2, T3, T4, T5 and T6) and different sowing dates of the hybrid AG 5011.
Figure 5. Average simulated aboveground dry
mass (A), energy per unit weight of
aboveground dry mass - EPUWHB (B) and
energy per unit area - EPUA (C), for different
nitrogen rates (T1, T2, T3, T4, T5 and T6) and
different sowing dates of the hybrid AG 5011.
Figure 6. Average simulated aboveground dry
mass (A), energy per unit weight of
aboveground dry mass - EPUWHB (B) and
energy per unit area - EPUA (C), for different
nitrogen rates (T1, T2, T3, T4, T5 and T6) and
different sowing dates of the hybrid AG 122.
4000 4500 5000 5500 6000 6500 7000 7500 8000 8500 9000 9500 10000 Date of sowing AG 5011 T1 T2 T3 T4 T5 T6 A A vera ge si mu lat ed ab ov eg ro un d d ry mas s (k g ha -1) 4000 4500 5000 5500 6000 6500 7000 7500 8000 8500 9000 9500 10000 Date of sowing AG 122 T1 T2 T3 T4 T5 T6 A A verag e s imu lat ed ab ov eg ro un d dry mas s (kg ha -1) 0.70 0.75 0.80 0.85 0.90 0.95 1.00 Ene rgy pe r uni t we ight of a bove gr oun d dr y mas s(U FL k g -1) Date of sowing AG 5011 T1 T2 T3 T4 T5 T6 B 0.70 0.75 0.80 0.85 0.90 0.95 1.00 Ene rgy pe r uni t we ight of a bove gr oun d dr y mas s (U FL k g -1) Date of sowing AG 122 T1 T2 T3 T4 T5 T6 B 4000 4500 5000 5500 6000 6500 7000 7500 8000 8500 9000 9500 10000 E nerg y p er un it area (U FL h a -1) Date of sowing AG 5011 T1 T2 T3 T4 T5 T6 C 4000 4500 5000 5500 6000 6500 7000 7500 8000 8500 9000 9500 10000 En erg y p er u ni t area (U FL h a -1) Date of sowing AG 122 T1 T2 T3 T4 T5 T6 C
Figure 6. Average simulated aboveground dry mass (A), energy per unit weight of aboveground dry mass - EPUWHB (B) and energy per unit area - EPUA (C), for different nitrogen rates (T1, T2, T3, T4, T5 and T6) and different sowing dates of the hybrid AG 122.
sowing date, the OPV AL 30 presented the highest yield response to N. When comparing the treatments T1 and T6, silage productivity increased 6.7%, from 7,752 to 8,271 kg ha-1, respectively (Figure
6A). To sum up, regarding sowing on December 19, the response of the cultivars to N rates was limited. According to França et al. (1994), the maize response to nitrogen fertilization is associated with the history of the field, soil fertility and management, cultural practices, rainfall intensity and distribution and solar radiation incidence.
The major differences in the silage quality were due to the sowing date and not the N rate (Figures 3B, 4B, 5B and 6B). There was a rise in the energy quality of the silage for sowings performed on the dates recommended by the Brazilian Agricultural Zoning (Brasil, 2017), which goes from October 1 to January 20, as compared to sowings undertaken outside this window. EPUWHB values in this period varied from 0.84 to 0.91; 0.80 to 0.90; 0.83 to 0.9; and from 0.82 to 0.91 MFU kg-1 for the
cultivars Amarelão, AL 30, AG 5011 and AG 122, respectively (Figures 3B, 4B, 5B and 6B). Regardless of the N rate used, for the sowing held on December 19, the EPUWHB was around 0.91 MFU kg-1 for the cultivars Amarelão, AG 5011
and AG 122. On the same date, the variety AL 30 provided an EPUWHB of 0.89 MFU kg-1.
Similarly, when evaluating the energy per unit area (EPUA), the major differences were due to the sowing date and not due to the N rate. From mid-October, the EPUA tended to increase until January 23, regardless of the N rate and cultivar (Figures 3C, 4C, 5C and 6C). For sowing on December 19 and without N application (T1), the highest average EPUA, of 6,933, 6,851 and 6,955 MFU kg-1, were
recorded for the cultivars AL 30, AG 5011 and AG 122, respectively. For the highest N rate (T6) the EPUA were 7,404; 7,126; 7,364 MFU kg-1 (Figures
4C, 5C and 6C). Lower values were observed for the OPV Amarelão with EPUA of 5,455 and 5,519 MFU kg-1 for T1 and T6, respectively (Figure 3C).
Sowing of any of the cultivars in January showed a great chance of breaking the deadline for harvesting silage (June 21) (Figures 2A, B, C and D). However, sowing in January showed the highest average values of both dry aboveground biomass and EPUA. Thus, a sowing strategy can be developed, in which part of the area would be planted until December 19, aiming at having silage in early winter, and another part sown when weather conditions favored greater quantity and quality of silage.
Evaluation of sowing dates
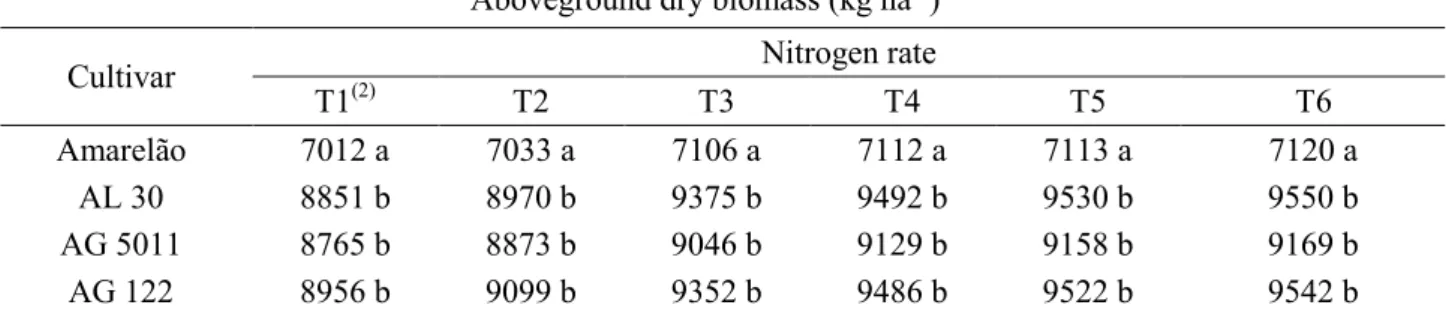
Analyzing the results for December 19 sowing date, it was observed that, regardless of the N rate, the silage productivity and the amount of energy per unit area (EPUA) were statistically lower for the variety Amarelão, when compared to the other cultivars (Tables 3 and 4). For these variables, no statistical differences were observed among the cultivars AL 30, AG 5011 and AG 122. When we analyzed the energy per unit weight of aboveground dry matter (EPUWHB), there was no significant difference among cultivars and N rates (Table 5). Regardless of cultivar and N rate, the silage presented good quality with EPUWHB values equal or higher than 0.91 MFU kg-1. According to Braga et al. (2008), EPUWHB
above 0.75 MFU kg-1 is an indicative of good
Table 3. Simulated aboveground dry biomass for the different nitrogen rates and cultivars sown on December 19. Pelotas-RS, 2017.
1Means followed by the same letter in the column did not differ from each other statistically by the Scott-Knott test at a probability
level < 0.05.
2T1 - treatment without fertilization; T2 - 200 kg ha-1 of 8-28-16 (NPK), applied at sowing; T3 - 200 kg ha-1 of 8-28-16 (NPK), at
sowing, plus 50 kg ha-1 of nitrogen (N) as urea, side-dressed at 30 days after sowing (DAS); T4 - 200 kg ha-1 of 8-28-16 (NPK) at
sowing, plus 100 kg ha-1 of N as urea side-dressed at 30 DAS; T5 - 200 kg ha-1 of 8-28-16 (NPK) at sowing, plus 150 kg ha-1 of N as
urea, side-dressed at 30 DAS; T6 - 200 kg ha-1 of 8-28-16 (NPK) at sowing, plus 200 kg ha-1 of N as urea, side-dressed at 30 DAS.
Aboveground dry biomass (kg ha-1)(1)
Cultivar Nitrogen rate
T1(2) T2 T3 T4 T5 T6 Amarelão 7012 a 7033 a 7106 a 7112 a 7113 a 7120 a AL 30 8851 b 8970 b 9375 b 9492 b 9530 b 9550 b AG 5011 8765 b 8873 b 9046 b 9129 b 9158 b 9169 b AG 122 8956 b 9099 b 9352 b 9486 b 9522 b 9542 b EPUWHB (UFL kg-1)(1)
Cultivar Nitrogen rate
T1(2) T2 T3 T4 T5 T6
Amarelão 0.92 a 0.92 a 0.92 a 0.92 a 0.92 a 0.92 a AL 30 0.91 a 0.91 a 0.91 a 0.91 a 0.91 a 0.91 a AG 5011 0.93 a 0.93 a 0.93 a 0.93 a 0.93 a 0.93 a AG 122 0.93 a 0.93 a 0.93 a 0.93 a 0.93 a 0.93 a
Table 4. Simulated energy per unit weight of aboveground dry biomass (EPUWHB) for different nitrogen rates and cultivars sowed on December 19. Pelotas-RS, 2017.
1Means followed by the same letter in the column did not differ from each other statistically by the Scott-Knott test at a probability
level < 0.05.
2T1 - treatment without fertilization; T2 - 200 kg ha-1 of 8-28-16 (NPK), applied at sowing; T3 - 200 kg ha-1 of 8-28-16 (NPK), at
sowing, plus 50 kg ha-1 of nitrogen (N) as urea, side-dressed at 30 days after sowing (DAS); T4 - 200 kg ha-1 of 8-28-16 (NPK) at
sowing, plus 100 kg ha-1 of N as urea side-dressed at 30 DAS; T5 - 200 kg ha-1 of 8-28-16 (NPK) at sowing, plus 150 kg ha-1 of N as
urea, side-dressed at 30 DAS; T6 - 200 kg ha-1 of 8-28-16 (NPK) at sowing, plus 200 kg ha-1 of N as urea, side-dressed at 30 DAS.
Silage yield and quality related to seasonal weather conditions
When assessing the silage yield, for different sowing dates and nitrogen fertilizer rates, there was a large inter-annual variation in the simulated values, for all cultivars (Figures 7A, B, C, D, E and F; 8A, B,
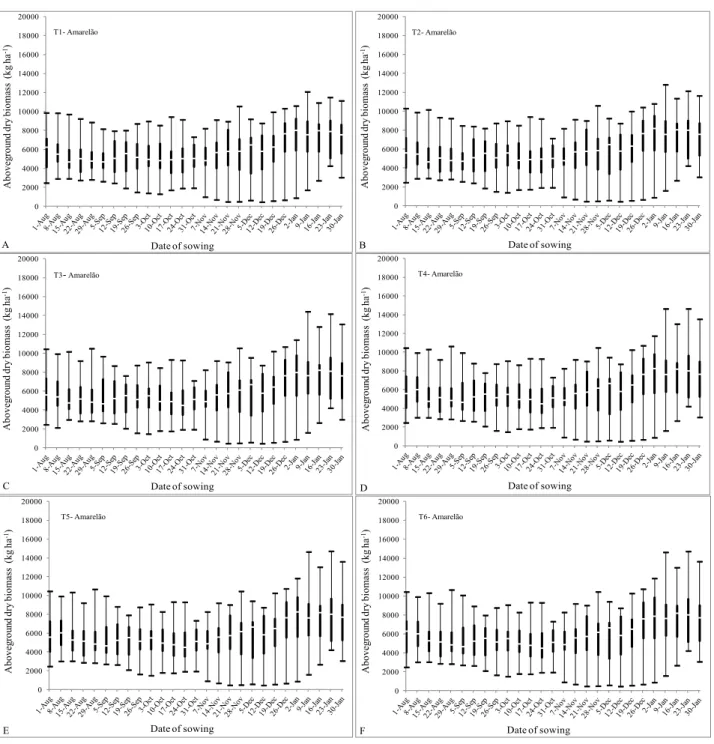
C, D, E and F; 9 A, B, C, D, E and F; 10A, B, C, D, E and F). For sowings held on December 19, in 25% of the years, due to unfavorable weather conditions, the silage yield of the creole cultivar Amarelão, grown without N fertilization (T1), varied from 551 to 4,687 kg ha-1. On the other hand, in 25% of the years due to
Table 5. Simulated energy per unit area (EPUA) for different nitrogen rates and cultivars sown on December 19. Pelotas-RS, 2017.
1Means followed by the same letter in the column did not differ from each other statistically by the Scott-Knott test at a probability
level < 0.05.
2T1 - treatment without fertilization; T2 - 200 kg ha-1 of 8-28-16 (NPK), applied at sowing; T3 - 200 kg ha-1 of 8-28-16 (NPK), at
sowing, plus 50 kg ha-1 of nitrogen (N) as urea, side-dressed at 30 days after sowing (DAS); T4 - 200 kg ha-1 of 8-28-16 (NPK) at
sowing, plus 100 kg ha-1 of N as urea side-dressed at 30 DAS; T5 - 200 kg ha-1 of 8-28-16 (NPK) at sowing, plus 150 kg ha-1 of N as
urea, side-dressed at 30 DAS; T6 - 200 kg ha-1 of 8-28-16 (NPK) at sowing, plus 200 kg ha-1 of N as urea, side-dressed at 30 DAS.
EPUA (UFL kg-1)(1)
Cultivar Nitrogen rate
T1(2) T2 T3 T4 T5 T6
Amarelão 6367 a(1) 6389 a 6456 a 6457 a 6453 a 6460 a
AL 30 8004 b 8115 b 8495 b 8596 b 8624 b 8639 b AG 5011 8013 b 8129 b 8335 b 8402 b 8426 b 8436 b AG 122 8154 b 8305 b 8613 b 8728 b 8752 b 8766 b
from 7,426 to 9,928 kg ha-1. In 50% of the years, the
silage yield varied from 4,687 to 7,426 kg ha-1 (Figure
7A). There was no significant increase in the silage yield in response to higher N rates. The frequency distribution of yields for the highest N rate treatment (T6) was quite similar to that from T1 (Figure 7F).
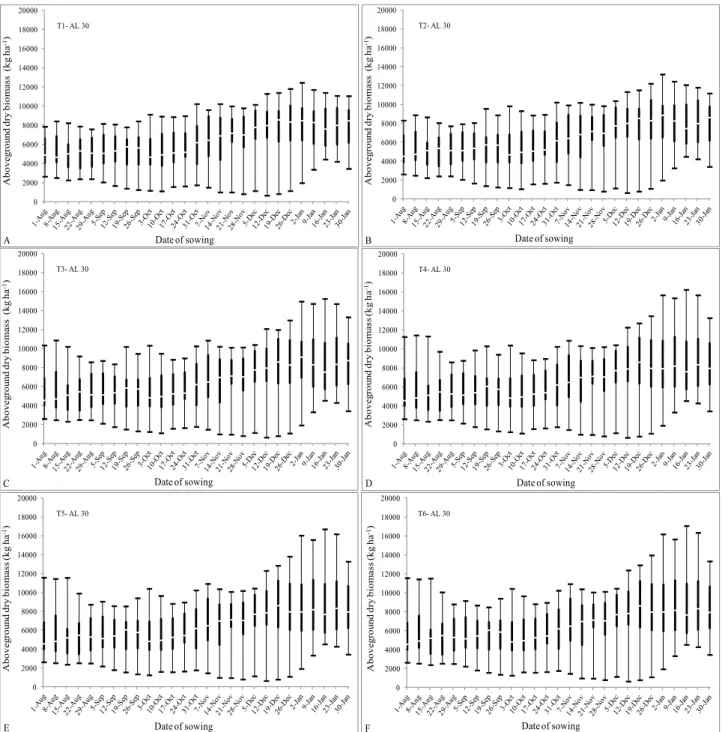
The single-cross hybrid AG 122 presented the best response to N fertilization for sowing on December 19, with yields ranging from 718 to 12,403; 724 to 12,616; 721 to 13,286; 721 to 13,726; 721 to 13,847 and 721 to 13,861, for treatments T1, T2, T3, T4, T5 and T6, respectively (Figures 10A, B, C, D, E and F). It was observed that, given its greater genetic potential, the cultivar response to increasing N rates, in terms of silage yield, occurred in 25% of years with more favorable weather conditions. The cultivars AG 5011 and AL 30 presented a similar inter-annual variation pattern and a similar response to N rates, providing simulated silage yields between Amarelão and AG 122 (Figures 8A, B, C, D, E and F; 9A, B, C, D, E and F).
It may be noted that for the sowing in December 19, higher N rates did not result in significant increase silage yield for all cultivars. However, sowings performed in January presented higher silage yield, due to more favorable weather conditions for maize crop growth and development, but at the risk of not having silage ready for the wintertime. Weather conditions can seriously affect the nitrogen fertilization strategies. A combination of low rainfall indices or dry spells in stages considered critical for the maize crop, with low solar radiation and high temperatures during the day and night, is unfavorable to the growth and development of the crop, leading to low N absorption and hence low biomass productivity. On the other hand, a combination of appropriate rainfall, sunny days and mild temperatures is favorable to the growth and development of maize, and tends to provide higher yield, especially when the N is not a limiting factor (Amaral et al., 2014). In all cases, variability in simulated silage yield was observed because of interactions between cultivars, the nitrogen rates and climate conditions.
Figure 7. Frequency distribution of the aboveground dry biomass for different nitrogen (N) rates
and sowing dates of the creole OPV Amarelão. T1 - 0 N (A); T2 - 200 kg ha-1 of 8-28-16 (N-P-K) at sowing (B); T3 - 200 kg ha-1 of 8-28-16 at sowing + 50 kg ha-1 of N side-dressed at 30 days after sowing (DAS) (C); T4 - 200 kg ha-1 of 8-28-16 at sowing + 100 kg ha-1 of N side-dressed at 30 DAS (D); T5 -200 kg ha-1 of 8-28-16 at sowing + 150 kg ha-1 of N side-dressed at 30 DAS (E); T6 - 200 kg ha-1 of 8-28-16 at sowing + 200 kg ha-1 of N side-dressed at 30 DAS (F). The lower part of the box indicates the 25th percentile, the line within the box indicates the median and the upper part of the box indicates the 75th percentile.
0 2000 4000 6000 8000 10000 12000 14000 16000 18000 20000 D T1- Amarelão A A bove gr ou nd dr y biom ass (kg ha -1) Date of sowing 0 2000 4000 6000 8000 10000 12000 14000 16000 18000 20000 Date of sowing T2- Amarelão B Above gr ou nd dr y bi om as s (kg ha -1) 0 2000 4000 6000 8000 10000 12000 14000 16000 18000 20000 Date of sowing T3-Amarelão Above gr ou nd dr y bi om as s (kg ha -1) C 0 2000 4000 6000 8000 10000 12000 14000 16000 18000 20000 Date of sowing T4- Amarelão D Above gr ou nd dr y biom as s (kg ha -1) 0 2000 4000 6000 8000 10000 12000 14000 16000 18000 20000 Date of sowing T5- Amarelão Above gr ou nd dr y biom ass (kg ha -1) E 0 2000 4000 6000 8000 10000 12000 14000 16000 18000 20000 Date of sowing T6- Amarelão F Above gr ou nd dr y biom ass (kg ha -1)
Figure 7. Frequency distribution of the aboveground dry biomass for different nitrogen (N) rates and sowing dates of the creole OPV Amarelão. T1 - 0 N (A); T2 - 200 kg ha-1 of 8-28-16 (N-P-K) at sowing (B); T3 - 200
kg ha-1 of 8-28-16 at sowing + 50 kg ha-1 of N side-dressed at 30 days after sowing (DAS) (C); T4 - 200 kg
ha-1 of 8-28-16 at sowing + 100 kg ha-1 of N side-dressed at 30 DAS (D); T5 -200 kg ha-1 of 8-28-16 at sowing
+ 150 kg ha-1 of N side-dressed at 30 DAS (E); T6 - 200 kg ha-1 of 8-28-16 at sowing + 200 kg ha-1 of N
side-dressed at 30 DAS (F). The lower part of the box indicates the 25th percentile, the line within the box indicates
Figure 8. Frequency distribution of the aboveground dry biomass for different nitrogen (N) rates
and sowing dates of the OPV AL 30. T1 - 0 N (A); T2 - 200 kg ha-1 of 8-28-16 (N-P-K) at sowing
(B); T3 - 200 kg ha-1 of 8-28-16 at sowing + 50 kg ha-1 of N side-dressed at 30 days after sowing (DAS) (C); T4 - 200 kg ha-1 of 8-28-16 at sowing + 100 kg ha-1 of N side-dressed at 30 DAS (D); T5 -200 kg ha-1 of 8-28-16 at sowing + 150 kg ha-1 of N side-dressed at 30 DAS (E); T6 - 200 kg ha-1 of 8-28-16 at sowing + 200 kg ha-1 of N side-dressed at 30 DAS (F). The lower part of the box indicates the 25th percentile, the line within the box indicates the median and the upper part of the box indicates the 75th percentile.
0 2000 4000 6000 8000 10000 12000 14000 16000 18000 20000 Date of sowing T1- AL 30 A Above gr ou nd dr y biom as s (k g ha -1) 0 2000 4000 6000 8000 10000 12000 14000 16000 18000 20000 Date of sowing T2- AL 30 B Above gr ou nd dr y biom as s (k g ha -1) 0 2000 4000 6000 8000 10000 12000 14000 16000 18000 20000 Date of sowing T3- AL 30 C Above gr ou nd dr y biom as s (k g ha -1) 0 2000 4000 6000 8000 10000 12000 14000 16000 18000 20000 Date of sowing T4- AL 30 D Above gr ou nd dr y biom as s ( kg ha -1) 0 2000 4000 6000 8000 10000 12000 14000 16000 18000 20000 Date of sowing T5- AL 30 E Above gr ou nd dr y biom as s ( kg ha -1) 0 2000 4000 6000 8000 10000 12000 14000 16000 18000 20000 Date of sowing T6- AL 30 F Above gr ou nd dr y biom as s ( kg ha -1)
Figure 8. Frequency distribution of the aboveground dry biomass for different nitrogen (N) rates and sowing dates of the OPV AL 30. T1 - 0 N (A); T2 - 200 kg ha-1 of 8-28-16 (N-P-K) at sowing (B); T3 - 200 kg ha-1 of
8-28-16 at sowing + 50 kg ha-1 of N side-dressed at 30 days after sowing (DAS) (C); T4 - 200 kg ha-1 of 8-28-16
at sowing + 100 kg ha-1 of N side-dressed at 30 DAS (D); T5 -200 kg ha-1 of 8-28-16 at sowing + 150 kg ha-1
of N side-dressed at 30 DAS (E); T6 - 200 kg ha-1 of 8-28-16 at sowing + 200 kg ha-1 of N side-dressed at 30
DAS (F). The lower part of the box indicates the 25th percentile, the line within the box indicates the median
Figure 9. Frequency distribution of the aboveground dry biomass for different nitrogen (N) rates
and sowing dates of the single-cross hybrid AG 5011. T1 - 0 N (A); T2 - 200 kg ha-1 of 8-28-16 (N-P-K) at sowing (B); T3 - 200 kg ha-1 of 8-28-16 at sowing + 50 kg ha-1 of N side-dressed at 30 days after sowing (DAS) (C); T4 - 200 kg ha-1 of 8-28-16 at sowing + 100 kg ha-1 of N side-dressed at 30 DAS (D); T5 -200 kg ha-1 of 8-28-16 at sowing + 150 kg ha-1 of N side-dressed at 30 DAS (E); T6 - 200 kg ha-1 of 8-28-16 at sowing + 200 kg ha-1 of N side-dressed at 30 DAS (F). The lower part of the box indicates the 25th percentile, the line within the box indicates the median and the upper part of the box indicates the 75th percentile.
0 2000 4000 6000 8000 10000 12000 14000 16000 18000 20000 Date of sowing T1- AG 5011 A Above gr ou nd dr y biom as s ( kg ha -1) 0 2000 4000 6000 8000 10000 12000 14000 16000 18000 20000 Date of sowing T2- AG 5011 B Above gr ou nd dr y biom as s (k g ha -1) 0 2000 4000 6000 8000 10000 12000 14000 16000 18000 20000 Date of sowing T3- AG 5011 C Above gr ou nd dr y biom as s (k g ha -1) 0 2000 4000 6000 8000 10000 12000 14000 16000 18000 20000 Date of sowing T4- AG 5011 D Above gr ou nd dr y biom as s ( kg ha -1) 0 2000 4000 6000 8000 10000 12000 14000 16000 18000 20000 Date of sowing T5- AG 5011 E Above gr ou nd dr y biom as s ( kg ha -1) 0 2000 4000 6000 8000 10000 12000 14000 16000 18000 20000 Date of sowing T6- AG 5011 F Above gr ou nd dr y biom as s ( kg ha -1)
Figure 9. Frequency distribution of the aboveground dry biomass for different nitrogen (N) rates and sowing dates of the single-cross hybrid AG 5011. T1 - 0 N (A); T2 - 200 kg ha-1 of 8-28-16 (N-P-K) at sowing (B);
T3 - 200 kg ha-1 of 8-28-16 at sowing + 50 kg ha-1 of N side-dressed at 30 days after sowing (DAS) (C); T4 -
200 kg ha-1 of 8-28-16 at sowing + 100 kg ha-1 of N side-dressed at 30 DAS (D); T5 -200 kg ha-1 of 8-28-16 at
sowing + 150 kg ha-1 of N side-dressed at 30 DAS (E); T6 - 200 kg ha-1 of 8-28-16 at sowing + 200 kg ha-1 of
N side-dressed at 30 DAS (F). The lower part of the box indicates the 25th percentile, the line within the box
Revista Brasileira de Milho e Sorgo, v.16, n.3, p. 536-555, 2017
Versão impressa ISSN 1676-689X / Versão on line ISSN 1980-6477 - http://www.abms.org.br
Figure 10. Frequency distribution of the aboveground dry biomass for different nitrogen (N) rates and sowing dates of the triple-cross hybrid AG 122. T1 - 0 N (A); T2 - 200 kg ha-1 of 8-28-16 (N-P-K) at sowing (B); T3 -
200 kg ha-1 of 8-28-16 at sowing + 50 kg ha-1 of N side-dressed at 30 days after sowing (DAS) (C); T4 - 200 kg
ha-1 of 8-28-16 at sowing + 100 kg ha-1 of N side-dressed at 30 DAS (D); T5 -200 kg ha-1 of 8-28-16 at sowing
+ 150 kg ha-1 of N side-dressed at 30 DAS (E); T6 - 200 kg ha-1 of 8-28-16 at sowing + 200 kg ha-1 of N
side-dressed at 30 DAS (F). The lower part of the box indicates the 25th percentile, the line within the box indicates
the median and the upper part of the box indicates the 75th percentile.
Conclusions
Figure 10. Frequency distribution of the aboveground dry biomass for different nitrogen (N) rates
and sowing dates of the triple-cross hybrid AG 122. T1 - 0 N (A); T2 - 200 kg ha-1 of 8-28-16 (N-P-K) at sowing (B); T3 - 200 kg ha-1 of 8-28-16 at sowing + 50 kg ha-1 of N side-dressed at 30 days after sowing (DAS) (C); T4 - 200 kg ha-1 of 8-28-16 at sowing + 100 kg ha-1 of N side-dressed at 30 DAS (D); T5 -200 kg ha-1 of 8-28-16 at sowing + 150 kg ha-1 of N side-dressed at 30 DAS (E); T6 - 200 kg ha-1 of 8-28-16 at sowing + 200 kg ha-1 of N side-dressed at 30 DAS (F). The lower part of the box indicates the 25th percentile, the line within the box indicates the median and the upper part of the box indicates the 75th percentile.
0 2000 4000 6000 8000 10000 12000 14000 16000 18000 20000 Date of sowing T1- AG 122 A Above gr ou nd dr y biom as s ( kg ha -1) 0 2000 4000 6000 8000 10000 12000 14000 16000 18000 20000 Date of sowing T2- AG 122 B Above gr ou nd dr y biom as s ( kg ha -1) 0 2000 4000 6000 8000 10000 12000 14000 16000 18000 20000 Date of sowing T3- AG 122 C Above gr ou nd dr y biom as s ( kg ha -1) 0 2000 4000 6000 8000 10000 12000 14000 16000 18000 20000 Date of sowing T4- AG 122 D Above gr ou nd dr y biom as s ( kg ha -1) 0 2000 4000 6000 8000 10000 12000 14000 16000 18000 20000 Date of sowing T5- AG 122 E Above gr ou nd dr y biom as s (kg ha -1) 0 2000 4000 6000 8000 10000 12000 14000 16000 18000 20000 Date of sowing T6- AG 122 F Above gr ou nd dr y biom as s ( kg ha -1)
Conclusions
The maize sowing period for silage production in the micro-region of Pelotas, Brazil, runs from June 26 to December 19, for all cultivars and nitrogen fertilizer rates; sowings outside this window have over 10% chance of resulting in harvests after June 21, which is considered the deadline for silage harvest in the region.
For sowings on December 19 the creole variety Amarelão had the lowest average values of silage yield and silage energy per unit area.
For the sowing window from June 26 to December 19, high nitrogen rates are not recommended due to the high risk of not getting response in terms of silage yield and silage quality.
Acknowledgements
The authors are thankful to the employees and trainees of Embrapa Milho e Sorgo and of Embrapa Clima Temperado for helping in the data collection for model parameterization. Thanks also to the family farmer who allowed additional data collection in his property, and to Capes, for the financial support of the first author, including the visiting period in Portugal.
References
ALMEIDA FILHO, S. L. de; FONSECA, D. M. da; GARCIA, R.; OBEID, J. A.; OLIVEIRA, J. S. e. Características agronômicas de cultivares de milho (Zea
mays L.) e qualidade dos componentes e da silagem.
Revista Brasileira de Zootecnia, Viçosa, MG, v. 28, n. 1, p. 7-13, 1999.
DOI: 10.1590/S1516-35981999000100002.
AMARAL, T. A. Desempenho de diferentes cultivares de milho produzidas por agricultores familiares na região sul do Estado do Rio Grande do Sul: utilização do modelo CERES-Maize no auxílio à tomada de decisões. 2015. 110 f. Tese (Doutorado) -Universidade Federal de Pelotas, Pelotas, 2015.
AMARAL, T. A.; ANDRADE, C. de L. T. de; LIMA, A. C. R. de; SILVA, S. D. dos A. e. Períodos de semeadura do milho para a microrregião de Pelotas-RS. Sete Lagoas: Embrapa Milho e Sorgo, 2014. 26 p. (Embrapa Milho e Sorgo. Documentos, 171).
AMARAL, T. A.; ANDRADE, C. L. T.; OLIVEIRA, A. C.; SILVA, D. F.; SANTANA, C. B.; MOURA, B. F.; CASTRO, L. A. Metodologia para o estabelecimento do período de semeadura de milho. Sete Lagoas: Embrapa Milho e Sorgo, 2009. 13 p. (Embrapa Milho e Sorgo. Documentos, 88).
ANDRADE, C. L. T.; AMARAL, T. A.; DUARTE, J. O.; GARCIA, J. C.; SILVA, D. F.; MARTINS, P. C. Simulated yield and net return of a maize crop fertilized with different sources and rates of nitrogen. Revista Brasileira de Milho e Sorgo, Sete Lagoas, v. 11, n. 3, p. 254-267, 2012. DOI: 10.18512/1980-6477/rbms.v11n3p254-267.
ANGSTRÖM, A. Solar and terrestrial radiation. Quarterly Journal of the Royal Meteorological Society, Berks, v. 50, p. 121-125, 1924.
BRAGA, R. P.; CARDOSO, M. J.; COELHO, J. P. Crop model based decision support for maize (Zea mays L.) silage production in Portugal. European Journal of Agronomy, v. 28, n. 3, p. 224-233, 2008.
BRASIL. Ministério da Agricultura, Pecuária e Abastecimentos. Zoneamento agrícola de risco climático. Available at: <http://www.agricultura.gov.br/>. Access in: 30 May 2017. COSTA, A. F. S. da. Influência das condições climáticas no crescimento e desenvolvimento de plantas de milho (Zea mays L.), avaliadas em diferentes épocas de plantio. 1994. 109 f. Tese (Doutorado) - Universidade Federal de Viçosa, Viçosa, MG, 1994.
COX, W. J.; CHERNEY, J. H.; CHERNEY, D. J. R.; PARDEE, W. D. Forage quality and harvest index of corn hybrids under different growing conditions. Agronomy Journal, Madison, v. 86, n. 2, p. 277-282, 1994. DOI: 10.2134/agronj1994.00021962008600020013x. http:// dx.doi.org/10.2134/agronj1994.00021962008600020013x CRUZ, J. C.; PEREIRA FILHO, I. A.; RODRIGUES, J. A. S.; FERREIRA, J. J. Produção e utilização de silagem de milho e sorgo. Sete Lagoas: Embrapa Milho e Sorgo, 2001. 544 p.
CRUZ, J. C.; PEREIRA FILHO, I. A.; SILVA, G. H. da. Mais de 170 cultivares transgênicas são disponibilizadas no mercado de sementes do Brasil para a safra 2011/12. APPS - Associação Paulista dos Produtores de Sementes e Mudas, São José Rio Preto, 4 nov. 2011. Available at: <http://www. apps.agr.br/upload/ax10_2702201264448700_cultivares demilhoparaasafra201112revisadoecorrigido.pdf>. Access in: 13 dez. 2017.
CRUZ, J. C.; PEREIRA FILHO, I. A.; SIMÃO, E. de P. 478 cultivares de milho estão disponíveis no mercado de sementes do Brasil para a safra 2014/2015. Sete Lagoas: Embrapa Milho e Sorgo, 2014. 35 p. (Embrapa Milho e Sorgo. Documentos, 167).
IBGE. Censo agropecuário. Rio de Janeiro, 2006. Available at: <http://www.ibge.gov.br>. Access in: 23 Aug 2013. FANCELLI, A. L.; DOURADO NETO, D. Produção de milho. Guaíba: Agropecuária, 2000. 360 p.
FRANÇA, G. E.; COELHO, A. M.; BAHIA FILHO, A. F. C. Parcelamento da adubação nitrogenada em cobertura na cultura do milho irrigado. In: CONGRESSO NACIONAL DE MILHO E SORGO, 20., 1994, Goiânia. Centro-Oeste: cinturão do milho e sorgo no Brasil: resumos. Goiânia: EMGOPA; Sete Lagoas: Associação Brasileira de Milho e Sorgo, 1994. p. 101.
HAVILAH, E. J.; KAISER, A. G.; NICOL, H. Use of a kernel milkline score to determine stage of maturity in maize crops harvested for silage. Australian Journal of Experimental Agriculture, Melbourne, v. 35, p. 739-743, 1995.
HE, J.; DUKESB, M. D.; HOCHMUTHC, G. J.; JONESB, J. W.; GRAHAMD, W. D. Identifying irrigation and nitrogen best management practices for sweet corn production on sandy soils using CERES-Maize model. Agricultural Water Management, Amsterdam, v. 109, p. 61-70, 2012.
HOOGENBOOM, G.; JONES, J. W.; WILKENS, P. W.; PORTE, C. H.; BOOTE, K. J.; HUNT, L. A.; SINGH, U.; LIZASO, J. L.; WHITE, J. W.; URYASEV, O.; ROYCE, F. S.; OGOSHI, R.; GIJSMAN, A. J.; TSUJI, G. Y. Decision Support System for Agrotechnology Transfer: version 4.5.1.013. Honolulu: University of Hawaii, 2013. 1 CD-ROM.
JONES, J. W.; HOOGENBOOM, G.; PORTER, C. H.; BOOTE, K. J.; BATCHELOR, W. D.; HUNT, L. A.; WILKENS, P. W.; SINGH, U.; GIJSMAN, A. J.; RITCHIE, J. T. DSSAT cropping system model. European Journal of Agronomy, v. 18, n. 3/4, p. 235-265, 2003.
LIU, H. L.; YANG, J. Y.; DRURY, C. A.; REYNOLDS, W. D.; TAN, C. S.; BAI, Y. L.; HOOGENBOOM, G. Using the DSSAT-CERES-Maize model to simulate crop yield and nitrogen cycling in fields under long-term continuous maize production. Nutrient Cycling in Agroecosystems, Dordrecht, v. 89, n. 3, p. 313-328, 2011.
DOI: 10.1007/s10705-010-9396-y.
MITTELMANN, A.; SOBRINHO, F. S.; OLIVEIRA, J. S.; FERNANDES, S. B. V.; LAJÚS, C. A.; MIRANDA, M.; ZANATTA, J. C.; MOLETTA, J. L. Avaliação de híbridos comerciais de milho para utilização como silagem na Região Sul do Brasil. Ciência Rural, Santa Maria, v. 35, n. 3, p. 684-690, 2005.
DOI: 10.1590/S0103-84782005000300032.
OLIVEIRA, J. S. Avaliação de cultivares de milho para silagem: resultados do ano agrícola 2002/2003. Juiz de Fora: Embrapa Gado de Leite, 2004. 12 p. (Embrapa Gado de Leite. Documentos, 78).
PAIXÃO, J. de S.; ANDRADE, C. de L. T. de; GARCIA, A. G. Y.; AMARAL, T. A.; STEIDLE NETO, A. J.; MARIN, F. R.; ALVES, M. E. B.; SILVA, D. F.; RODRIGUES, C.
C. F.; TEIXEIRA, T. C. An alternative approach to the actual brazilian maize crop zoning. In: ASABE ANNUAL INTERNATIONAL MEETING, 2013, Kansas City. [Proceedings]. Kansas City: ASABE, 2013.
PICKERING, N.; HANSEN, J.; JONES, J.; WELLS, C.; CHAN, V.; GODWIN, D. Weatherman: a utility for managing and generating weather data. Agronomy Journal, Madison, v. 86, p. 332-337, 1994.
PRESCOTT, J. A. Evaporation from a water surface in relation to solar radiation. Transactions of the Royal Society of South Australia, Adelaide, v. 64, p. 114-118, 1940.
SANTOS, H. G. dos; JACOMINE, P. K. T.; ANJOS, L. H. C. dos; OLIVEIRA, V. A. de; LUMBRERAS, J. F.; COELHO, M. R.; ALMEIDA, J. A. de; CUNHA, T. J. F.; OLIVEIRA, J. B. de. Sistema brasileiro de classificação de solos. 3. ed. rev. e ampl. Brasília, DF: Embrapa, 2013. 353 p.
SANTOS, R. D.; PEREIRA, L. G. R.; NEVES, A. L. A.; AZEVÊDO, J. A. G.; MORAES, S. A.; COSTA, C. T. F. Características agronômicas de variedades de milho para produção de silagem. Acta Scientiarum. Animal Sciences. Maringá, v. 32, n. 4, p. 367-373, 2010.
SCOTT, A. J.; KNOTT, M. A cluster analysis method for grouping means in the analysis of variance. Biometrics, Washington, v. 30, n. 3, p. 507-512, 1974. DOI: 10.2307/2529204. http://dx.doi.org/10.2307/2529204.
SILVA, D. F. da; ANDRADE, C. de L. T. de; RESENDE, A. V. de; GARCIA, A. G. Y.; RODRIGUES, C. C. F.; TEIXEIRA, T. C.; AMARAL, T. A.; PAIXÃO, J. S.; GARCIA, A. G. Y. Yield and nitrate leaching in a rainfed maize crop using swine manure and mineral fertilizer as nitrogen sources. In: ASABE ANNUAL INTERNATIONAL MEETING, 2013, Kansas City. [Proceedings]. Kansas City: ASABE, 2013.
SPOHR, R. B.; MAGGI, M. F.; CARLESSO, R.; KUNZ, J. H.; FIORIN, T. T. Irrigação na produção de silagem de milho e sorgo, em sucessão ao arroz de terras altas. Revista Brasileira de Engenharia Agrícola e Ambiental, Campina Grande, v. 9, n. 4, p. 469-474, 2005.
DOI: 10.1590/S1415-43662005000400005.
THORNTON, P. K.; HOOGENBOOM, G. A computer program to analyze single season crop model outputs. Agronomy Journal, Madison, v. 86, p. 860-868, 1994. DOI: 10.2134/agronj1994.00021962008600050020x.
VERMOREL, M. Nutrition energetique (energetic nutrition). In: JARRIGE, R. (Ed.). Alimentation des bovins, ovins et caprins. Paris: INRA, 1988. p. 57-71. WIERSMA, D. W.; CARTER, P.; ALBRECHT, K. A.; COORS, J. G. Kernel milkline stage and corn forage yield, quality, and dry matter content. Journal of Production Agriculture, Madison, v. 6, p. 23-24, 1993.