PLANT DENSITY AND NITROGEN FERTILIZATION ON COMMON BEAN
NUTRITION AND YIELD
1ROGÉRIO PERES SORATTO2*, TIAGO ARANDA CATUCHI3, EMERSON DE FREITAS CORDOVA DE SOUZA4, JADER LUIS NANTES GARCIA5
ABSTRACT- The objective of this work was to evaluate the effect of plant densities and sidedressed nitrogen (N) rates on nutrition and productive performance of the common bean cultivars IPR 139 and Pérola. For each cultivar, a randomized complete block experimental design was used in a split-plot arrangement, with three replicates. Plots consisted of three plant densities (5, 7, and 9 plants ha-1) and subplots of five N rates (0, 30, 60,
120, and 180 kg ha-1). Aboveground dry matter, leaf macro
- and micronutrient concentrations, yield
components, grain yield, and protein concentration in grains were evaluated. Lower plant densities (5 and 7 plants m-1) increased aboveground dry matter production and the number of pods per plant and did not
reduce grain yield. In the absence of N fertilization, reduction of plant density decreased N concentration in common bean leaves. Nitrogen fertilization linearly increased dry matter and leaf N concentration, mainly at lower plant densities. Regardless of plant density, the N supply linearly increased grain yield of cultivars IPR 139 and Pérola by 17.3 and 52.2%, respectively.
Keywords: Phaseolus vulgaris. Nitrogen. Plant population. Mineral nutrition. Grain yield.
DENSIDADE DE PLANTAS E ADUBAÇÃO NITROGENADA NA NUTRIÇÃO E PRODUTIVIDADE DE CULTIVARES DE FEIJÃO
RESUMO - O objetivo do trabalho foi avaliar o efeito da densidade de plantas na fileira e de doses de nitrogênio (N) em cobertura na nutrição e desempenho produtivo das cultivares de feijão comum IPR 139 e Pérola. Para cada cultivar, o delineamento experimental utilizado foi em blocos ao acaso, em parcelas subdivididas e três repetições. As parcelas consistiram de três densidades de plantas (5, 7 e 9 plantas m-1 de
fileira) e as subparcelas de cinco doses de N (0, 30, 60, 120 e 180 kg ha-1). Foram avaliadas: matéria seca da
parte aérea, teores de macro e micronutrientes na folha diagnose, componentes da produção, produtividade de grãos e teor de proteína nos grãos. Menores densidades de plantas (5 e 7 plantas m-1) proporcionaram maior
produção de MS e número de vagens por planta e não reduziram a produtividade de grãos. Na ausência da adubação nitrogenada, a redução da densidade de plantas diminuiu o teor de N nas folhas do feijoeiro. A adubação nitrogenada aumentou linearmente a produção de matéria seca e o teor de N nas folhas do feijoeiro, principalmente sob as menores densidades de plantas. Independentemente da densidade de plantas, o fornecimento de N aumentou linearmente a produtividade de grãos das cultivares IPR 139 e Pérola em 17,3 e 52,2%, respectivamente.
Palavras-chave: Phaseolus vulgaris. Nitrogênio. População de plantas. Nutrição mineral. Produtividade de
grãos.
_____________________ *Corresponding author
1Received for publication in 05/19/2016; accepted in 11/28/2016.
2Department of Crop Science, College of Agricultural Sciences, Universidade Estadual Paulista, Botucatu, SP, Brazil;
Rev. Caatinga
INTRODUCTION
The common bean (Phaseolus vulgaris L.) is traditionally grown with a sowing density ranging from 10 to 15 plants m-1 row (SILVA; SILVA, 2005;
BARBOSA; GONZAGA, 2012). However, there is a tendency to reduce the number of plants within the row (PES, 2011), since a lower plant population results in a late canopy closure, which in turn can decrease plant diseases such as white mold
[Sclerotinia sclerotiorum (Lib.) de Bary] (VIEIRA et
al., 2012). Plant diseases can be more efficiently controlled with greater incidence of sunlight and the resulting higher air flux within the plant canopy. In addition, lower plant populations enable the applied fungicides to reach the bottom of the plants (VIEIRA et al., 2012).
Adequate plant population depends on the cultivar growth habit, soil fertility, water, and nutrient availability, and disease intensity in common bean crops. Hereby, pods and grains per pod are the yield components most affected by plant density (DIDONET; COSTA, 2004). In São Paulo State, Brazil, for common bean growth habit type III, the density of 10 plants m-1 row is commonly used,
whereas densities of 12 and 15 plants m-1 are used
for common bean cultivar with growth habit type I and II, respectively (BARBOSA; GONZAGA, 2012).
According to Pes (2011), there is an improvement in the spatial distribution of plants
when the sowing density is reduced from 10 to 5 plants m-1 within the row, resulting in more
vigorous plants with a greater number of branches, which allows each plant to produce more pods and hence a higher grain yield. However, when plant populations are low, there is a greater demand for nutrients, of which nitrogen (N) is the most required for leaf production and increased grain yields.
According to Ambrosano et al. (1997), the rate of sidedressed N fertilization recommended in São Paulo State ranges from 20 to 90 kg N ha-1,
depending on expected grain yield and N response class of the soil. Alvarez et al. (2005) reported an increase of irrigated common bean grain yield with N rates exceeding 100 kg N ha-1. Also, Soratto,
Carvalho, and Arf (2006), Soratto, Perez, and Fernandes (2014), and Moreira et al. (2013) reported an increase in common bean grain yield with the addition of 120-140 kg N ha-1 and attributed this
effect to the increase of pods per plant. These findings also support the hypothesis that higher plant-available N is needed when the plant population is reduced.
The N demand of the common bean crop and the response to N fertilization may depend on plant population and growth habit (PES, 2011). Common
bean cultivars with a compact and lower canopy may demand higher N rates to produce higher grain yields when grown with a low plant density. This effect may be related to the need to increase the branches and the number of pots per plant, compensating plant population reduction.
The objective of this study was to evaluate the effect of plant density within the row with different sidedressed N rates on plant nutrition and grain yield of the common bean cultivars IPR 139 and Pérola.
MATERIAL AND METHODS
Two experiments were conducted in
Botucatu, SP (22º51’S, 48º26’W, elevation of 740 m), during the 2012 growing season: one with
the common bean cultivar IPR 139 and another with cultivar Pérola. According to the Köppen classification system, the region has a Cwa climate (tropical, with dry winters and hot and rainy summers). During the experimental period, rainfall and minimum and maximum temperatures were measured daily at a weather station near the experimental location (Figure 1).
The experimental area had an established no-tillage system (NT) for more than 10 years. Before the 2012 growing season, the forage grass
Urochloa ruziziensis (Syn. Brachiaria ruziziensis)
cv. Comum was grown, intercropped with corn (2010/2011 growing season). The soil was classified as a Typic Rhodudalf (distrophic Red Nitosol,
SANTOS et al., 2013), with 650 g kg-1 clay,
110 g kg-1 silt, and 240 g kg-1 sand. Soil
characteristics at a depth of 0-0.2 m before implementation of the experiments were as follows:
pH(CaCl2), 4.5; organic matter, 28.3 g dm-3;
Presin-extractable, 19.3 mg dm-3; exchangeable K, Ca, and
Mg 3.1, 32.3, and 11.8, respectively; cation exchange capacity, 87.6 mmolc dm-3; base saturation,
54%.
Each experiment was arranged in a randomized complete block design with split-plots and three replications. Plots comprised three plant densities (5, 7, and 9 plants m-1 row) and subplots
comprised five sidedressed N rates (0, 30, 60, 120,
and 180 kg N ha-1). Each plot contained six
15-m-long rows and was subdivided into five 3-m-long subplots. The 2 m of the central four rows
were considered for evaluations.
Two weeks before sowing, the experimental
area was desiccated by applying glyphosate (1,800 g a.i. ha-1). Both cultivars were sown at a
depth of 0.03 m using a tractor-driven multiple NT
seeder on 29 February 2012, at a density of 14 seeds m-1, with 0.45 m spacing between rows.
Phosphorus and K fertilization were performed simultaneously at sowing and in the same seed furrow, but 0.05 m deeper. Fertilization consisted of 60 kg ha-1 of P2O5 and 60 kg ha-1 K2O by use of
single superphosphate and potassium chloride, respectively. The plants emerged on 7 March 2012. Plots were thinned to the treatment density when the common bean plants were in the phenological stage V3 (first trifoliate leaf totally expanded).
Sidedressed N fertilization with ammonium nitrate (34% of N) was split-applied at the phenological stage V4, with the first application at 14 days after emergence (DAE), when the third trifoliate leaf was totally expanded, and another at 28 DAE, when the sixth trifoliate leaf was totally expanded.
The plants were irrigated by a conventional sprinkler system with a water level of 7.0 mm in each irrigation, according to the crop requirements (Figure 1).
At the flowering stage (31 DAE for IPR 139 and 35 DAE for Pérola), the third trifoliate leaves with petiole were taken from 10 random plants per subplot (AMBROSANO et al., 1997). The samples were dried in a forced-air oven at 65 ºC for 72 h and ground for determination of nutrient concentrations (N, P, K, Ca, Mg, S, Cu, Fe, Mn, and Zn) (MALAVOLTA; VITTI; OLIVEIRA, 1997). In addition, 10 plants per subplot were taken at the flowering stage, dried in a forced-air oven at 65 °C for 72 h, and weighed for the determination of dry matter (DM) production.
The common bean cultivar IPR 139 was
Pérola on 6 June 2012 (91 DAE). At this time, the yield components (final plant population, number of
pods per plant, number of grains per pod, and 100-grain weight) and grain yield were determined in
each subplot. The plants in the two 2-m-long central rows were manually harvested. After mechanical threshing and cleaning, the grains were weighed and the yield (kg ha-1) was calculated at a moisture of
130 g kg-1. A grain sample from each subplot was
dried in an oven at 65 °C for 48 h, ground, and then subjected to the determination of N concentration (MALAVOLTA; VITTI; OLIVEIRA, 1997). To calculate crude protein concentration, the following formula was used: crude protein = N (g kg-1) × 6.25.
Data from each cultivar were separately subjected to analysis of variance. Means of plant density factor were compared using Tukey´s test at the 0.05 probability level. The effects of sidedressed N rates on common bean crop were evaluated by polynomial regression analysis. The SISVAR statistical software package (FERREIRA, 2011) was used.
RESULTS AND DISCUSSION
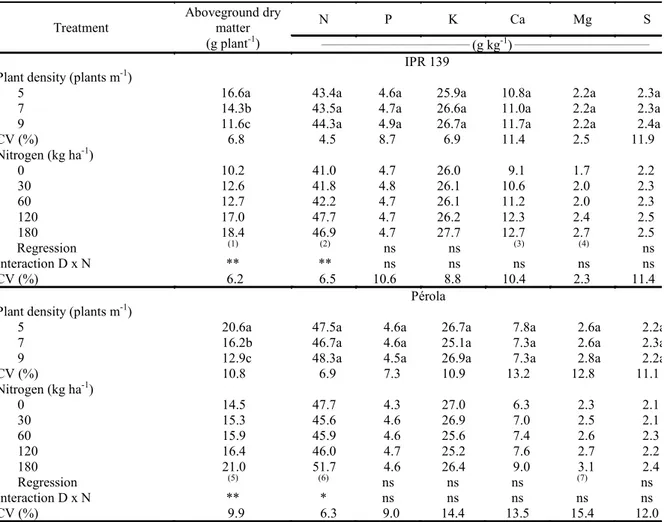
Aboveground DM production of both cultivars was affected by plant density, N rate, and by their interaction (Table 1). Regardless of the
applied N rate, lower plant densities (5 and 7 plants m-1) resulted in greater aboveground
DM production at the common bean flowering compared to the density of 9 plants m-1, irrespective
of the N application (Table 2). However, pronounced differences were reported without sidedressed N application and at 120 and 180 kg N ha-1 rates in the
cultivar IPR 139 and 180 kg N ha-1 rate in the
cultivar Pérola. Additionally, sidedressed N
Figure 1. Daily rainfall ( ), irrigation ( ), and maximum ( ) and minimum ( ) temperatures recorded at the experimental area from February to June 2012.
0 30 60 90 120
Feb. Mar. Apr. May Jun.
R
ai
nf
al
l/
Ir
ri
ga
ti
on (
m
m
da
y
a
-1 )
0 10 20 30 40
T
em
pe
ra
tur
e (
Rev. Caatinga
at almost all of densities, except at the density of 9 plants m-1.
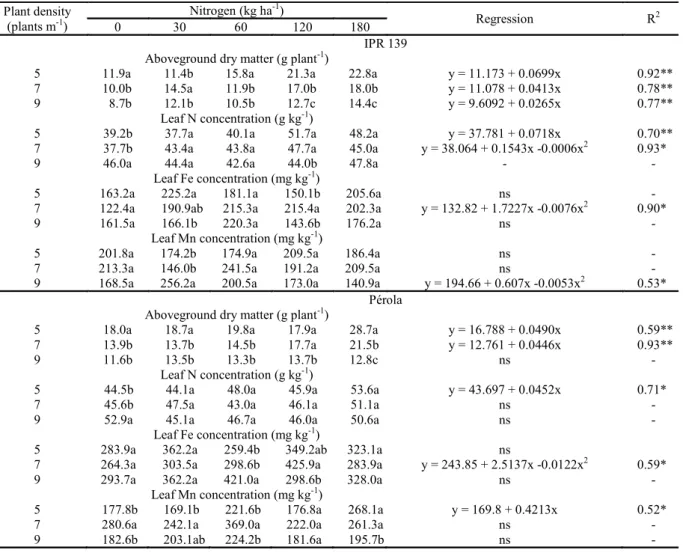
Under lower population densities, aboveground DM production of both cultivars was increased more expressively by sidedressed N fertilization (Table 2). Considering that high plant population increases competition between plants, the lower aboveground DM biomass with the greater plant population may be attributed to competition, which could have limited plants to achieve their
optimal growth, even when the highest N rate (180 kg N ha-1) was applied. According to Pes
(2011), reduction of common bean plant density promotes larger plants with more branches, since the species has an ability to compensate the spaces at low plant densities. Also, the increase of plant DM biomass with increasing rates of N fertilization is most likely due to increased N availability, since
then is the key nutrient for increasing leaf area index and hence photosynthesis rates, thereby promoting plant DM accumulation (TAIZ; ZEIGER, 2009; MARSCHNER, 2012). Soratto, Carvalho and Arf (2006) and Crusciol et al. (2007) also reported a linear increase in the common bean DM biomass with increasing sidedressed N rates.
Leaf N concentration was influenced by the interaction between plant density x N rate (Table 1).
For both cultivars, the lower plant densities (5 and 7 plants m-1) resulted in lower leaf N
concentration compared to the higher plant density studied (9 plants m-1), under the absence of
sidedressed N application (Table 2). This result can be attributed to the dilution effect, as for lower plant densities greater aboveground DM biomass was reported.
Table 1. Aboveground dry matter production and macronutrient concentrations in leaves of common bean cultivars as affected by plant densities and nitrogen rates.
Means followed by different letters in the column, within factor density, are significantly different according to Tukey’s
test at 5% probability level. (1)y = 10.62 + 0.0459x (R² = 0.95*); (2)y = 40.018 + 0.0402x (R² = 0.82**); (3)y = 9.783 + 0.0182x (R² = 0.86**); (4)y = 1.842 + 0.0046x (R² = 0.96**); (5)y = 47.672 -0.0734x + 0.0005x2 (R² = 0.97*);
(6)y = 14.055 + 0.0327x (R² = 0.85**); (7)y = 2.359 + 0.0042x (R² = 0.94**). ns: not significant. * and **significant
according to the F test at 5 and 1% probability level, respectively.
Treatment
Aboveground dry matter (g plant-1)
N P K Ca Mg S
_________________________________
(g kg-1) ______________________________ IPR 139
Plant density (plants m-1)
5 16.6a 43.4a 4.6a 25.9a 10.8a 2.2a 2.3a
7 14.3b 43.5a 4.7a 26.6a 11.0a 2.2a 2.3a
9 11.6c 44.3a 4.9a 26.7a 11.7a 2.2a 2.4a
CV (%) 6.8 4.5 8.7 6.9 11.4 2.5 11.9
Nitrogen (kg ha-1)
0 10.2 41.0 4.7 26.0 9.1 1.7 2.2
30 12.6 41.8 4.8 26.1 10.6 2.0 2.3
60 12.7 42.2 4.7 26.1 11.2 2.0 2.3
120 17.0 47.7 4.7 26.2 12.3 2.4 2.5
180 18.4 46.9 4.7 27.7 12.7 2.7 2.5
Regression (1) (2) ns ns (3) (4) ns
Interaction D x N ** ** ns ns ns ns ns
CV (%) 6.2 6.5 10.6 8.8 10.4 2.3 11.4
Pérola
Plant density (plants m-1)
5 20.6a 47.5a 4.6a 26.7a 7.8a 2.6a 2.2a
7 16.2b 46.7a 4.6a 25.1a 7.3a 2.6a 2.3a
9 12.9c 48.3a 4.5a 26.9a 7.3a 2.8a 2.2a
CV (%) 10.8 6.9 7.3 10.9 13.2 12.8 11.1
Nitrogen (kg ha-1)
0 14.5 47.7 4.3 27.0 6.3 2.3 2.1
30 15.3 45.6 4.6 26.9 7.0 2.5 2.1
60 15.9 45.9 4.6 25.6 7.4 2.6 2.3
120 16.4 46.0 4.7 25.2 7.6 2.7 2.2
180 21.0 51.7 4.6 26.4 9.0 3.1 2.4
Regression (5) (6) ns ns ns (7) ns
Interaction D x N ** * ns ns ns ns ns
Table 2. Plant density × nitrogen rate interaction for aboveground dry matter and concentrations of N, Cu, Fe, and Mn in leaves of the common bean cultivar IPR 139 and for the aboveground dry matter and concentrations of N, Fe, and Mn in leaves of the cultivar Pérola.
Means followed by different letters, in the column, are significantly different according to Tukey’s test at 5% probability level. ns: not significant. * and **significant according to the F test at 5 and 1% probability level, respectively.
The sidedressed N rates increased N concentration in common bean leaves when the cultivar IPR 139 was grown at densities of 5 and 7 plants m-1 and when the cultivar Pérola was grown
at a density of 5 plants m-1 (Table 2). These results
suggest that common bean cultivated at low plant densities can accumulate more aboveground DM biomass and therefore take up more N. Previous studies have shown increased N concentrations in common bean leaves with increasing N fertilizer rates (CRUSCIOL et al., 2007; SORATTO; CARVALHO; ARF, 2006; SOUZA; SORATTO; PAGANI, 2011; SORATTO; PEREZ; FERNANDES, 2014). Despite the effect of the studied factors, leaf N concentrations in this study were within the range considered adequate for common bean crops (30-50 g kg-1), according to the guidelines of Ambrosano et al. (1997). The available N even without N application (control) can be attributed to the soil organic matter found in the NT
results have previously been reported (SOUZA; SORATTO; PAGANI, 2011; MAIA et al., 2012; SORATTO; PEREZ; FERNANDES, 2014).
Plant densities slightly affected leaf concentrations of P, K, Ca, Mg, S, Cu, Fe, Mn, and Zn (Tables 1 and 3). The N application increased leaf concentrations of Ca, Mg, and Zn in both cultivars regardless of plant densities and increased leaf Cu concentration in the cultivar IPR 139. According to Kirkby and Knight (1977), increasing soil NO3-N availability increases plant uptake of NO3-, which in
turn increases the uptake of cationic nutrients, such as Ca, Mg, Cu, and Zn. Additionally, the greater N availability could have stimulated the root growth and favored soil exploration and nutrient uptake. Soratto, Perez and Fernandes (2014) also found increasing Mg and Zn concentrations in common bean leaves with increasing N fertilizer rates.
The Fe and Mn concentrations in leaves were affected by the interaction between plant density x N
Plant density (plants m-1)
Nitrogen (kg ha-1)
Regression R2
0 30 60 120 180
IPR 139
Aboveground dry matter (g plant-1)
5 11.9a 11.4b 15.8a 21.3a 22.8a y = 11.173 + 0.0699x 0.92**
7 10.0b 14.5a 11.9b 17.0b 18.0b y = 11.078 + 0.0413x 0.78**
9 8.7b 12.1b 10.5b 12.7c 14.4c y = 9.6092 + 0.0265x 0.77**
Leaf N concentration (g kg-1)
5 39.2b 37.7a 40.1a 51.7a 48.2a y = 37.781 + 0.0718x 0.70**
7 37.7b 43.4a 43.8a 47.7a 45.0a y = 38.064 + 0.1543x -0.0006x2 0.93*
9 46.0a 44.4a 42.6a 44.0b 47.8a - -
Leaf Fe concentration (mg kg-1)
5 163.2a 225.2a 181.1a 150.1b 205.6a ns -
7 122.4a 190.9ab 215.3a 215.4a 202.3a y = 132.82 + 1.7227x -0.0076x2 0.90*
9 161.5a 166.1b 220.3a 143.6b 176.2a ns -
Leaf Mn concentration (mg kg-1)
5 201.8a 174.2b 174.9a 209.5a 186.4a ns -
7 213.3a 146.0b 241.5a 191.2a 209.5a ns -
9 168.5a 256.2a 200.5a 173.0a 140.9a y = 194.66 + 0.607x -0.0053x2 0.53*
Pérola
Aboveground dry matter (g plant-1)
5 18.0a 18.7a 19.8a 17.9a 28.7a y = 16.788 + 0.0490x 0.59**
7 13.9b 13.7b 14.5b 17.7a 21.5b y = 12.761 + 0.0446x 0.93**
9 11.6b 13.5b 13.3b 13.7b 12.8c ns -
Leaf N concentration (g kg-1)
5 44.5b 44.1a 48.0a 45.9a 53.6a y = 43.697 + 0.0452x 0.71*
7 45.6b 47.5a 43.0a 46.1a 51.1a ns -
9 52.9a 45.1a 46.7a 46.0a 50.6a ns -
Leaf Fe concentration (mg kg-1)
5 283.9a 362.2a 259.4b 349.2ab 323.1a ns
7 264.3a 303.5a 298.6b 425.9a 283.9a y = 243.85 + 2.5137x -0.0122x2 0.59*
9 293.7a 362.2a 421.0a 298.6b 328.0a ns -
Leaf Mn concentration (mg kg-1)
5 177.8b 169.1b 221.6b 176.8a 268.1a y = 169.8 + 0.4213x 0.52*
7 280.6a 242.1a 369.0a 222.0a 261.3a ns -
Rev. Caatinga
resulted in higher concentrations of Fe and Mn (Table 2). Almost all leaf nutrient concentrations were within the range considered adequate for common bean crops, according to the guidelines of Ambrosano et al. (1997). Exceptions are the Ca level in the cultivar Pérola and the Mg level in the treatments with lower N rates.
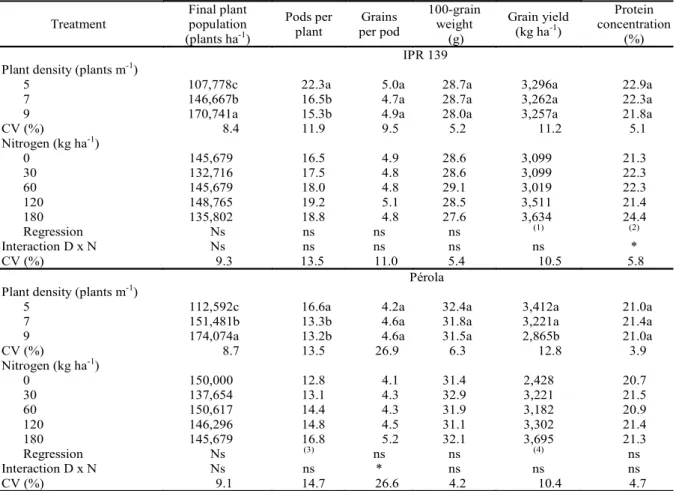
The final plant population was affected by
plant density in both common bean cultivars (Table 4). The cultivar IPR 139 had a final plant
population of 107,778, 146,667, and
170,741 plants ha-1, whereas the cultivar Pérola
resulted in 112,592, 151,481, and 174,074 plants ha-1
at densities of 5, 7, and 9 plants m-1, respectively.
Additionally, with higher initial plant densities (mostly 9 plants m-1), there was a greater difference
when compared to the final plant population, which
was around 14% less than expected (200,000 plants ha-1). Conversely, the lower initial
plant density (5 plants m-1) resulted in a final plant
population similar to what was expected (111,111 plants h-1).
Table 3. Micronutrient concentrations in leaves of common bean cultivars as affected by plant densities and nitrogen rates.
Means followed by different letters in the column, within factor density, are significantly different according to Tukey’s test at 5% probability level. (1)y = 9.3885 + 0.1141x -0.0005x2 (R² = 0.63**); (2)y = 38.67 + 0.0448x (R² =
0.60**); (3)y = 287.51 + 1.3522x -0.0067x2 (R² = 0.76**); (4)y = 40.681 + 0.0581x (R² = 0.96**). ns: not significant.
* and **significant according to the F test at 5 and 1% of probability level, respectively.
Both common bean cultivars had a greater number of pods per plant when cultivated at the lower plant density of 5 plants m-1 (Table 4). These
results can be attributed to more vigorous aboveground growth in this treatment (Tables 1 and 2), which, in turn, results in the production of more branches and inflorescences (SHIMADA; ARF; SÁ, 2000). In addition, the number of pods per plants in the cultivar Pérola increased linearly with increasing N rates (Table 4). According to Silva et al. (2009), this response can be related due to the greater production of reproductive branches promoted by N fertilization. The pronounced effect of N application in the cultivar Pérola compared to that in the cultivar
IPR 139 can be attributed to the growth habit type II/III, since this type of growth habit has a
greater stimulation of branching with greater soil N availability. However, no interaction between plant density and N rate for number of pods per plants was found. Previous studies also reported an increase in number of pods per plant with increasing N rates up to 100 and 120 kg N ha-1 in the cultivar Pérola
(CRUSCIOL et al., 2007; SORATTO; PEREZ; FERNANDES, 2014; MOREIRA et al., 2013). Nevertheless, the results of this work provide an evidence that depending on the growth condition, application of N rates up to 180 kg N ha-1 can
increase the number of pods per plant. Treatment ___________________________________________Cu Fe Mn Zn
(mg kg-1) _________________________________ IPR 139
Plant density (plants m-1)
5 13.0a 173.5a 189.4a 41.4a
7 13.6a 185.1a 200.3a 43.5a
9 13.9a 189.2a 187.9a 41.6a
CV (%) 17.9 12.8 14.9 10.2
Nitrogen (kg ha-1)
0 7.8 149.0 194.6 36.0
30 13.0 194.0 192.5 43.6
60 15.2 205.5 205.6 39.5
120 15.7 169.7 191.3 45.7
180 15.9 194.8 179.0 45.6
Regression (1) ns ns (2)
Interaction D x N ns ** * ns
CV (%) 17.4 14.1 18.9 9.8
Pérola Plant density (plants m-1)
5 13.2a 340.7a 202.7b 45.6a
7 13.4a 315.2a 275.0a 46.2a
9 12.0a 340.7a 197.4b 43.8a
CV (%) 21.6 12.4 14.9 8.9
Nitrogen (kg ha-1)
0 14.4 280.6 213.6 41.3
30 10.2 342.6 204.8 41.5
60 14.2 326.3 271.6 44.4
120 12.8 352.9 193.4 47.4
180 12.8 311.6 241.7 51.4
Regression ns (3) ns (4)
Interaction D x N ns * * ns
The number of grains per pod was only influenced by the interaction between plant density and N rate in the cultivar Pérola (Table 4), where N application increased with increasing N rates when
common bean was cultivated at a density of 7 plants m-1 (Table 5). At 180 kg N ha-1, intermediate
plant density resulted in a greater number of grains per pod. However, Shimada, Arf and Sá (2000) did not report a plant density effect on number of grains per pod of common bean. Changes in this characteristic as a response to N application have not been frequently reported in previous studies (CRUSCIOL et al., 2007; MAIA et al., 2012; SORATTO; PEREZ; FERNANDES, 2014).
The 100-grain weight was not influenced by treatments, which agrees with results found by Crusciol et al. (2007), Moreira et al. (2013), and Soratto et al. (2013). According to Crusciol et al. (2007), grain weight of the common bean has a low variation when the grow conditions are changed, due to its high heritability characteristic, which means that this characteristic more heavily depends on the cultivar than on the crop practices adopted.
Grain yield of the cultivar Pérola was influenced by plant density, and the density of 5 and
7 plants m-1 resulted in greater grain yields (Table 4).
Nitrogen application linearly increased grain yield in both common bean cultivars. In IPR 139, the highest N rate (180 kg ha-1) resulted in 17.3% higher grain
yield compared to the control (without N application). However, in the cultivar Pérola, grain yield increased by52.2% with the application of 180 kg N ha-1. These results demonstrate that even
with a reasonable soil nutrient availability, areas as found in areas with 10 years of an established NT system, the common bean crop could be influenced by N application. Soratto, Perez and Fernandes (2014) also reported an effect of N application on grain yields of common bean cultivated on an established NT system. Moreira et al. (2013) reported an increase in grain yield of common bean up to the highest applied N rate (120 kg N ha-1). The
greater grain yield response to N application in the cultivar Pérola, compared to that of IPR 139, can be related to the effect of N application on the number of pods per plant (Table 4). These results indicate that number of pods per plant and grain yield of the cultivar Pérola are more limited by low soil N availability compared to the cultivar IPR 139.
Table 4. Final plant population, number of pods per plant, number of grains per pod, 100-grain weight, grain yield, and
crude protein concentration in grains of common bean cultivars as affected by plant densities and nitrogen rates.
Means followed by different letters in the column, within factor density, are significantly different according to Tukey’s test Treatment
Final plant population (plants ha-1)
Pods per plant
Grains per pod
100-grain weight
(g)
Grain yield (kg ha-1)
Protein concentration
(%) IPR 139
Plant density (plants m-1)
5 107,778c 22.3a 5.0a 28.7a 3,296a 22.9a
7 146,667b 16.5b 4.7a 28.7a 3,262a 22.3a
9 170,741a 15.3b 4.9a 28.0a 3,257a 21.8a
CV (%) 8.4 11.9 9.5 5.2 11.2 5.1
Nitrogen (kg ha-1)
0 145,679 16.5 4.9 28.6 3,099 21.3
30 132,716 17.5 4.8 28.6 3,099 22.3
60 145,679 18.0 4.8 29.1 3,019 22.3
120 148,765 19.2 5.1 28.5 3,511 21.4
180 135,802 18.8 4.8 27.6 3,634 24.4
Regression Ns ns ns ns (1) (2)
Interaction D x N Ns ns ns ns ns *
CV (%) 9.3 13.5 11.0 5.4 10.5 5.8
Pérola Plant density (plants m-1)
5 112,592c 16.6a 4.2a 32.4a 3,412a 21.0a
7 151,481b 13.3b 4.6a 31.8a 3,221a 21.4a
9 174,074a 13.2b 4.6a 31.5a 2,865b 21.0a
CV (%) 8.7 13.5 26.9 6.3 12.8 3.9
Nitrogen (kg ha-1)
0 150,000 12.8 4.1 31.4 2,428 20.7
30 137,654 13.1 4.3 32.9 3,221 21.5
60 150,617 14.4 4.3 31.9 3,182 20.9
120 146,296 14.8 4.5 31.1 3,302 21.4
180 145,679 16.8 5.2 32.1 3,695 21.3
Regression Ns (3) ns ns (4) ns
Interaction D x N Ns ns * ns ns ns
Rev. Caatinga
Crude protein concentration in the grains was only affected by N rate and interaction between plant density and N rate in the cultivar IPR 139 (Table 4). Protein concentration in grains increased linearly in response to increasing N rates when common bean was cultivated at a density of 7 and 9 plants m-1. The
highest protein concentration in grains was reported for 180 kg N ha-1 at a plant density of 9 plants m-1.
Soratto, Perez and Fernandes (2014) also reported an increase of protein concentration in common bean grains with sidedressed N. These results are most likely due to the increased N availability, since N is the basis for the formation of proteins found in plant tissues (TAIZ; ZEIGER, 2009; MARSCHNER, 2012).
Table 5. Plant density × nitrogen rate interaction for crude protein concentration in grains of the common bean cultivar IPR 139 and number of grains per pod of the cultivar Pérola.
Means followed by different letters, in the column, are significantly different according to Tukey’s test at 5% probability level. ns: not significant. * and **significant according to the F test at 5 and 1% probability level, respectively.
The reduction of plant density from 9 to 5 plants m-1 did not decrease grain yield of both
cultivars (Table 4). These findings may be useful for a practical recommendation, since adequate crop management can suppress plant diseases such as while mold and improve disease control (VIEIRA et al., 2012); it can also decrease seed costs. Additionally, in the cultivar Pérola, the density of 5 or 7 plants m-1 resulted in greater grain yield
compared to the density of 9 plants m-1. Moreover,
the grain yield of both common bean cultivars increased in response to N application, irrespective of the plant density, suggesting that the addition of N can be used to reach the potential maximum grain yield of common bean crops.
CONCLUSION
Lower plant densities of 5 and 7 plants m-1
resulted in a greater aboveground DM biomass and number of pods per plant of the common bean; grain yield was not decreased.
The addition of N linearly increased aboveground DM production and leaf N concentration of the common bean, which was more pronounced at lower plant densities.
Increased N rates linearly increased grain yields in both common bean cultivars up to a rate of 180 kg N ha-1, regardless of the plant density.
ACKNOWLEDGMENTS
We would like to thank the National Council for Scientific and Technological Development (CNPq) for providing an award for excellence in research to the first author.
REFERENCES
ALVAREZ, A. C. C. et al. Resposta do feijoeiro à aplicação de doses e fontes de nitrogênio em cobertura no sistema de plantio direto. Acta Scientiarum. Agronomy, Maringá, v. 27, n. 1, p. 69-75, 2005.
AMBROSANO, E. J. et al. Leguminosas e oleaginosas. In: RAIJ, B. van. et al. (Eds.). Recomendações de adubação e calagem para o Estado de São Paulo. 2. ed. Campinas: Instituto Agronômico e Fundação IAC, 1997, cap. 19, p. 189-203. (Boletim técnico, 100).
BARBOSA, F. R.; GONZAGA, A. C. O. Informações técnicas para o cultivo do feijoeiro-comum na Região Central-Brasileira:
2012-2014. Santo Antônio de Goiás: Embrapa Arroz e Feijão, 2012. 247 p. (Documentos / Embrapa Arroz e Feijão, 272).
Plant density (plants m-1)
Nitrogen (kg ha-1)
Regression R2
0 30 60 120 180
IPR 139 Protein concentration (%)
5 21.5a 22.6a 21.6a 20.9a 22.4b ns -
7 21.2a 21.4a 22.7a 22.4a 23.9b y = 21.256 + 0.0137x 0.83**
9 21.2a 22.8a 22.5a 20.9a 26.9a y = 21.108 + 0.0225x 0.46*
Pérola Grains per pod
5 4.7a 3.8a 5.0a 3.4a 4.0b ns -
7 4.3a 3.4a 3.9a 4.9a 6.4a y = 3.49 + 0.0141x 0.74*
CRUSCIOL, C. A. C. et al. Fontes e doses de nitrogênio para o feijoeiro em sucessão a gramíneas no sistema plantio direto. Revista Brasileira de Ciências do Solo, Viçosa, v. 31, n. 6, p. 1545-1552, 2007.
DIDONET, A. D.; COSTA, J. G. C. População de plantas e rendimento de grãos em feijoeiro comum de ciclo precoce. Pesquisa Agropecuária Tropical, Goiânia, v. 34, n. 2, p. 105-109, 2004.
FERREIRA, D. F. Sisvar: A computer statistical analysis system. Ciência e Agrotecnologia, Lavras, v. 35, n. 6, p. 1039-1042, 2011.
KIRKBY, E. A.; KNIGHT, A. H. Influence of the level of nitrate nutrition on ion uptake and assimilation, organic acid accumulation, and cation-anion balance in whole tomato plants. Plant Physiology, Rockville, v. 60, n. 3, p. 349-353, 1977.
MAIA, S. C. M. et al. The nitrogen sufficiency index underlying estimates of nitrogen fertilization requirements of common bean. Revista Brasileira de Ciência do Solo, Viçosa, v. 36, n. 1, p. 183-191, 2012.
MALAVOLTA, E.; VITTI, G. C.; OLIVEIRA, S. A. Avaliação do estado nutricional de plantas: princípios e aplicações. 2. ed. Piracicaba, SP: Potafos, 1997. 308 p.
MARSCHNER, P. Marschner’s mineral nutrition of higher plants. 3. ed. San Diego: Academic Press, 2012. 672 p.
MOREIRA, G. B. L. et al. Desempenho agronômico do feijoeiro com doses de nitrogênio em semeadura e cobertura. Revista Brasileira de Engenharia Agrícola e Ambiental, Campina Grande, v. 17, n. 8, p. 818-823, 2013.
PES, J. A. Principais problemas da cultura do feijão irrigado (Ênfase à etapa de semeadura). In: FANCELLI, A. L. (Ed.). Feijão: tecnologia da produção. Piracicaba: ESALQ/USP/LPV, 2011. cap. 2, p.13-22.
SANTOS, H. G. et al. Sistema brasileiro de classificação de solos. 3. ed. Rio de Janeiro, RJ: EMBRAPA-SPI, 2013. 306 p.
SHIMADA, M. M.; ARF, O.; SÁ, M. E. Componentes do rendimento e desenvolvimento do feijoeiro de porte ereto sob diferentes densidades populacionais. Bragantia, Campinas, v. 59, n. 2, p. 181-187, 2000.
flocculosa com diferentes doses de nitrogênio.
Bragantia, Campinas, v. 68, n. 2, p. 443-451, 2009.
SILVA, J. G.; SILVA, C. C. Plantio e tratos culturais. In: COBUCCI, T.; BIAVA, M. (Eds.). Cultivo do feijão irrigado na Região Noroeste de Minas Gerais. Santo Antônio de Goiás: Embrapa Arroz e Feijão; Campinas: Embrapa Informática Agropecuária, 2005, cap. 7. Disponível em: <http:// sistemasdeproducao.cnptia.embrapa.br/Font sHTML/ Feijao/FeijaoIrrigadoNoroesteMG>. Acesso em: 20 jan. 2016.
SORATTO, R. P.; CARVALHO, M. A. C.; ARF, O. Nitrogênio em cobertura no feijoeiro cultivado em plantio direto. Revista Brasileira de Ciência do Solo, Viçosa, v. 30, n. 2, p. 259-265, 2006.
SORATTO, R. P. et al. Épocas de aplicação de nitrogênio em feijoeiro cultivado após milho solteiro ou consorciado com braquiária. Pesquisa Agropecuária Brasileira, Brasília, v. 48, n. 10, p. 1351-1359, 2013.
SORATTO, R. P.; PEREZ, A. A. G.; FERNANDES, A. M. Age of no-till system and nitrogen management on common bean nutrition and yield. Agronomy Journal, Madison, v. 106, n. 3, p. 809-820, 2014.
SOUZA, E. F. C.; SORATTO, R. P., PAGANI, F. A. Aplicação de nitrogênio e inoculação com rizóbio em feijoeiro cultivado após milho consorciado com braquiária. Pesquisa Agropecuária Brasileira, Brasília, v. 46, n. 4, p. 370-377, 2011.
TAIZ, L.; ZEIGER, E. Fisiologia vegetal. 4. ed. Porto Alegre, RS: Artmed, 2009. 848p.