F
ACULDADE DEE
NGENHARIA DAU
NIVERSIDADE DOP
ORTODebugging Microservices
João Pedro Gomes Silva
Mestrado Integrado em Engenharia Informática e Computação Supervisor: Pedro F. Souto
Co-supervisor: Filipe F. Correia
Debugging Microservices
João Pedro Gomes Silva
Mestrado Integrado em Engenharia Informática e Computação
Approved in oral examination by the committee:
Chair: Nuno Honório Rodrigues Flores, PhD
External Examiner: Isabel de Fátima Silva Azevedo, PhD
Supervisor: Pedro Alexandre Guimarães Lobo Ferreira Souto, PhD
Abstract
The microservice architecture is a method of developing software that structures a system as a collection of distributed single-purpose, loosely-coupled services. This style enables the continu-ous delivery and testing of large and complex software applications. The services are often owned by different teams, which may be in different geographical locations. This trend has become in-creasingly popular in recent years, as enterprises inin-creasingly adopt agile methods and DevOps. Unfortunately the tooling, specifically when it comes to debugging microservice-based systems, is still lacking.
Due to its distributed nature, systems based on a microservice architecture are harder to debug compared to monolithic systems. To some extent, this is often due to their heterogeneity (both software and hardware-wise) concurrent execution and for being subject to partial failure. Many approaches have been proposed to better solve this problem. The most popular ones are tracing, log analysis, visualization and record, and replay. Each has its own merits, but also their own drawbacks.
This document describes a solution for debugging individual microservices, by trying to iso-late its interactions with other services, recording them, and allowing to replay them in future executions. The approach proposed in this dissertation focuses on the instrumentation of network communication, independently of the protocol used, and random number generation in programs executing in the Java Virtual Machine in order to deterministically replay a previous execution of any of the services.
A prototype following the proposed approach was developed and used to conduct a case study, which showed that deterministic replay of executions can be obtained without introducing large execution time overhead in the original program, and with a high level of accuracy.
Resumo
A arquitetura de microserviços é um método de desenvolvimento de software que estrutura o sis-tema como uma coleção de serviços idependentes, cada um com um único propósito bem definido. Este estilo facilita a integração contínua e o teste de aplicações complexas. Frequentemente, os serviços são desenvolvidos por equipas diferentes, que podem até encontrar-se em localizações geográficas distintas. Esta tendência tem vindo a tornar-se cada vez mais popular recentemente, à medida que as empresas adoptam cada vez mais métodos ágeis de desenvolvimento e DevOps. Infelizmente, as ferramentas para fazer a depuração de sistemas baseados em microserviços não acompanharam este desenvolvimento.
Devido à sua natureza distribuída, sistemas baseados em microserviços são mais complicados de depurar quando comparados com sistemas monolíticos. De certa forma, isto é devido à sua heterogeneidade (quer a nível de software como de hardware), execução altamente concorrente, e o facto de que estão sujeitos a falhas parciais. Muitas abordagens foram propostas para resolver este problema. As mais populares são tracing, análise de logs, visualização, e record & replay. Cada uma tem as suas vantagens, mas também as suas desvantagens.
Este documento descreve uma solução para depurar microserviços, produrando isolar as suas interações com outros serviços, registando-as e permitindo a sua reprodução em execuções futuras. A abordagem proposta nesta dissertação foca-se na instrumentação de comunicação através da rede, idependentemente do protocolo utilizado, assim como na geração de números aleatórios em programs executando na Java Virtual Machine, com o objectivo de replicar deterministicamente uma execução prévia de um serviço.
Um protótipo que segue a abordagem proposta foi desenvolvido e utilizado para elaborar um caso de estudo, que mostra que replicação deterministica de uma execução pode ser obtida sem introduzir um overhead grande no tempo de execução do programa original, e com um nível alto de fidelidade.
Acknowledgements
I would like to express my sincere gratitude to my advisors Prof. Pedro F. Souto and Prof. Filipe F. Correia for their help and support throughout the development of this work. I would also like to thank Blip for the opportunity to conduct this work with them, and in particular to Diogo Monteiro and Rui Borges for their assistance during this project.
“Ow! My brains!”
Contents
1 Introduction 1
1.1 Motivation and Objectives . . . 1
1.2 Dissertation Structure . . . 6
2 Background 7 2.1 SOA and Microservices . . . 7
2.2 The Java Instrumentation API . . . 9
2.2.1 Byteman . . . 12
2.3 Protocol Buffers . . . 14
3 Literature Review 15 3.1 Introduction . . . 15
3.2 General Approaches For Debugging Distributed Systems . . . 16
3.3 Distributed Tracing . . . 16
3.3.1 Dapper . . . 17
3.3.2 Conclusion . . . 18
3.4 Log Analysis . . . 18
3.4.1 Mining Console Logs . . . 19
3.4.2 Conclusion . . . 19
3.5 Visualization . . . 20
3.5.1 Theia . . . 20
3.5.2 Conclusion . . . 20
3.6 Record and Replay . . . 20
3.6.1 GoReplay . . . 21 3.6.2 D3S . . . 21 3.6.3 Friday . . . 22 3.6.4 Conclusion . . . 22 3.7 Conclusions . . . 22 4 Problem Statement 25 4.1 Main Issues . . . 25 4.2 Objectives . . . 26 4.3 Methodology . . . 27 5 Approach 29 5.1 Assumptions and Core Tenets . . . 29
5.2 Designing an Approach for Record and Replay . . . 30
CONTENTS
5.4 Instrumenting Network Communication . . . 33
5.5 Instrumenting Random Number Generation . . . 34
6 A Prototype for Record and Replay 37 6.1 Overview . . . 37
6.2 The Record Object . . . 39
6.2.1 Storing Records . . . 41
6.3 The Record Phase . . . 41
6.3.1 Generating Communication Records . . . 42
6.3.2 Generating RNG Records . . . 45
6.4 The Replay Phase . . . 48
6.4.1 Generating a Replay Script . . . 48
6.4.2 Replaying the Execution . . . 48
6.5 Usage . . . 56
7 Case Study 59 7.1 Description of the Service . . . 59
7.2 Setup . . . 60
7.3 Methodology . . . 61
7.3.1 Measuring Execution Time . . . 62
7.3.2 Measuring Storage Space Usage . . . 62
7.3.3 Computing Replay Accuracy . . . 63
7.4 Results and Analysis . . . 64
7.4.1 Execution time . . . 64
7.4.2 Storage Space Usage . . . 64
7.4.3 Replay Accuracy . . . 66 7.5 Conclusions . . . 67 7.6 Validation Threats . . . 68 8 Conclusions 71 8.1 Contributions . . . 71 8.2 Future Work . . . 72 References 75
List of Figures
2.1 Differences between monolithic applications and microservices [Fow] . . . 9
2.2 The instrumentation process of a Java program . . . 12
5.1 The Internet protocol suite [int] . . . 34
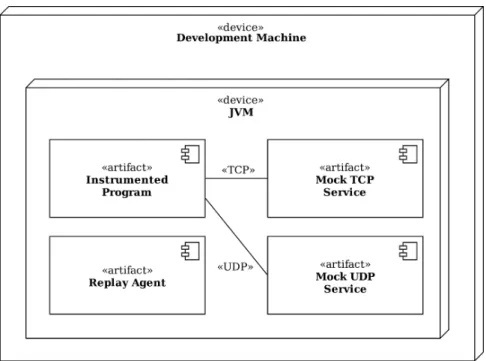
6.1 The architecture of the system in record mode. . . 38
6.2 The architecture of the system in replay mode. . . 39
6.3 The replay script generator web application . . . 49
List of Tables
3.1 Summary and comparison between the approaches to debugging a distributed
micro-service based system. . . 24
6.1 Description of the components of the system in record mode. . . 38
6.2 Description of the components of the system in replay mode. . . 40
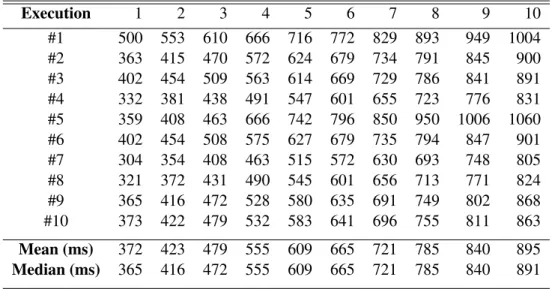
7.1 Execution times per tuple and per execution without the agent running, in mil-liseconds. . . 65
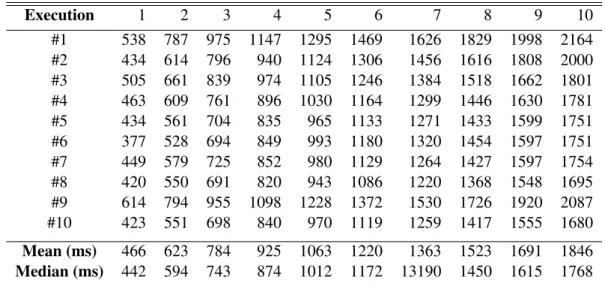
7.2 Execution times per tuple and execution with the agent in record mode, in mil-liseconds. . . 65
7.3 Execution times per tuple and execution with the agent in replay mode, in mil-liseconds. . . 66
7.4 Comparison of execution times between different modes of execution. . . 66
7.5 Storage space used per execution in record mode. . . 67
7.6 Number of lines in the log files before and after post-processing . . . 67
7.7 Comparison between log files of the replayed executions and the log file of the recorded execution. . . 68
Abbreviations
API Application Programming Interface ECA Event Condition Action
GDB GNU Debugger
GUI Graphical User Interface HTTP Hyper-Text Transfer Protocol IP Internet Protocol
JDK Java Development Kit JRE Java Runtime Environment JSON Javascript Object Notation JVM Java Virtual Machine KB Kilobyte
MB Megabyte
OS Operating System
RNG Random Number Generation RPC Remote Procedure Call SOA Service-Oriented Architecture TCP Transmission Control Protocol UDP User Datagram Protocol UUID Universally Unique Identifier VM Virtual Machine
Chapter 1
Introduction
Debugging is a core activity in the process of creating software systems. Developers report spend-ing around half of their time in debuggspend-ing tasks [LVD06]. The reason for this is, of course, that despite their creators’ best efforts no non-trivial computer program is bug-free.
Microservices, a way of architecting systems as a complex collection of single-function, highly distributed, and loosely coupled services have become mainstream in the development world [Res18]. Its advocates claim that it increases maintainability and testability in large, complex systems. While this may well be true, the distributed nature of this architecture also introduces new challenges in the debugging process.
Despite the widespread adoption of distributed, microservice-based architectures, tools to help debug them are still in its infancy. As is shown in Chapter 3, many companies have developed custom solutions, that work only for their specific architecture. It’s the purpose of this thesis to propose a more general approach to help solve this issue.
1.1
Motivation and Objectives
Traditionally, the debugging process has encompassed a few well-defined steps and made use of a set of basic generally applicable techniques. This section makes the argument that those steps and techniques are ill-suited to debug large and complex distributed systems such as microservice-based systems, and that novel ways to debug these kinds of systems are necessary.
A software bug is usually manifested through some unexpected behavior in the system. Once the behavior has been identified, the process finding and eliminating the problem which is produc-ing it, also known as debuggproduc-ing, begins.
The first step in the debugging process is trying to replicate the problem. In other words, find-ing a set of input values and execution environment for which the unexpected behavior manifests. In complex distributed systems, this often turns out to be a non-trivial problem, either because the input and context are unknown or hard to replicate or because the problems are sporadic, due to
Introduction
race conditions or issues in synchronization between processes. There may be cases where it is impractical, if not impossible, to reproduce the problem.
The irreproducibility of problems in a complex distributed system is a problem for two main reasons. First, it is substantially harder to analyze a problem of which only one example exists. It greatly increases the search space, as each input or environment attribute is a possible cause for the unexpected behavior. Second, and perhaps more dramatic, is that if the circumstances under which some bug manifests itself are not known, then there is no hope of ensuring that a potential fix works. Once a fix has been devised and is being tested, if the unexpected behavior is not present there is no way of knowing if that is because the root cause of the issue has been found and fixed, or if it is just pure chance.
Even if one manages to reproduce the problem, there is still the need to find the root cause of unexpected behavior. Over the years a number of techniques [CBM90] have emerged to analyze the execution of a program and identify the root cause of a problem:
• Output debugging: Is the simplest technique available in the debugging toolbox. In output debugging a developer inserts output statements at selected places in the program that is being debugged. The developer then attempts to understand the behavior of the program based on the outputs of those statements.
This technique is very simple and allows a developer to focus only on the section of the code that they hypothesize might be causing unexpected behavior. However, it requires modifications to the source code, and those modifications must be done in specific areas. The job of selecting the sections of code where to insert the output statements is not easy and often requires in-depth knowledge of the code base. In distributed systems, the difficulties are exacerbated because the developer must observe the output of the program in many different processors. If the number of processors is big enough this becomes unfeasible, since transient bugs may manifest themselves in some processors but not in others.
• Tracing: Tracing is similar to output debugging in that it relies on logging and outputting information in order to trace the execution of a program. Often, it relies on tracing function-ality built into either the operating system or the platform. Unlike output debugging though, it can be turned on and off on demand and spans the entirety of the program, as opposed to just the sections of interest.
Its advantages are that it is not necessary to change the program, avoiding the risk of in-troducing new bugs in the process, and that there is no need for the developer to decide where to place the output statements in the program’s source code, avoiding cases where misplaced output statements offer no information, or erroneous information, about the exe-cution. Unfortunately, it is still not very adequate to large scale distributed micro-services, since it produces vast quantities of data that are very difficult to analyze manually.
• Breakpoints: Breakpoints are points in the program where the developer has chosen to in-terrupt normal execution and output the complete state of the process at that point. When a
Introduction
breakpoint is hit, the developer can not only inspect the state of the process but also modify it. Furthermore, it is also possible to continue execution by one instruction at a time and inspecting or interacting with the state at each step.
This technique offers some clear advantages. In the first place, there is no need to modify the source code, once again avoiding the possibility of introducing new unexpected behavior when inserting the debugging probes. Secondly, the full state of the process can be inspected at each breakpoint, which means that the developer is not responsible for choosing the state variables that may or may not be useful to inspect. And finally, breakpoints can be used to analyze just the sections of code that the developer hypothesizes that might be responsible for the observed unexpected behavior. On the other hand, this places on the developer the burden of selecting the correct places on the source code to place the breakpoints such that meaningful and interesting information can be obtained that will be useful in the debugging process.
This is a very powerful technique and widely used to debug single processes. However, there are some difficulties when applying this technique to distributed environments. For instance, what should happen when a breakpoint is hit in a distributed system? Should all the processes in the system be halted, or just the process in which the breakpoint was defined? Furthermore, the state of a process is fairly easy to define and output, but the entire global state of a distributed system at some point is not so easy to define and would probably require synchronized clocks between all the processors in which parts of the system are executing on. Even the semantics of executing a single instruction is more complicated in a distributed environment. It is not clear if a single instruction should be executed in all the processes in the system or just in the process in which the breakpoint was defined. It is also not clear whether single instruction execution would be helpful at all: it is usually used to detect faulty logic, but not faulty interactions between processes.
Of course, breakpoints (as well as all the other traditional debugging techniques) remain useful to debug unexpected behavior that is confined to a single process, even if it is part of a larger distributed system.
• Assertions: Assertions define invariants in the source code that are checked at runtime. Assertions can behave like breakpoints in the sense that execution can be halted and the process state recorded when an assertion is violated or instead the execution can proceed as normal, but the state is saved somewhere for later analysis.
Assertions require modifications to the source code, which means that there is the possi-bility of mistakenly introducing new bugs in the program. They also require some amount of expertise from the programmer for both knowing which invariants should hold at each time, and to place the assertions in the correct places. However, assertions offer something that the other methods of debugging analyzed so far don’t: the possibility of collecting large amounts of data when, and only when the system does not behave as expected (and the in-variant doesn’t hold). This data has a higher likelihood of being relevant, as it was collected
Introduction
in a case where the process was misbehaving. It can then be analyzed to understand and identify the causes of the error.
But when it comes to applying assertions to a distributed system, once again the problem of obtaining a correct and synchronized global state at the precise moment that the assertion was violated does not have a simple solution. And without data on the global state of the system it becomes very difficult to detect bugs resulting from the interaction between different processes in the system.
• Controlled Execution: In controlled execution, a developer is may change the order of in-teractions between processes. This is especially useful to devise tests in which inin-teractions are executed in different orders or at different speeds in order to identify problems that exist because of race conditions or other concurrency issues. This is a method often used to de-bug multi-threaded or multi-process programs. Thus, it is inherently more adequate to use in distributed systems, due to their similarities.
However, this method has some disadvantages. Firstly, it requires the creation of a frame-work or system to support the controlled execution with a high enough degree of granularity to be useful. And secondly, it means extra work for the developers that would have to write the appropriate tests in order to identify unexpected behavour.
• Replay: Replay is a way to record information about the execution of a distributed environ-ment and trigger a new execution with the same set of inputs as the first one. This technique can be used in combination with others such as assertions that identify and collect informa-tion when the behavior of the system is unexpected.
The main advantage of this technique is that it allows for easier reproducibility of the erro-neous behavior. However, this would necessitate great precision in the recording of signif-icant events. Not only would the data transmitted between processes in the system need to be the same, but more crucially timings would need to be the exact same, or otherwise it is possible that the unexpected behavior would not manifest itself. This makes this technique very difficult to implement in practice. Not only that, but the replay is also an invasive tech-nique that would require many changes in the source code, with the risk of introducing new bugs in the process.
• Monitoring: One of the most common ways of debugging a system is capturing as much information as possible about all relevant events that occur, and then going through the information once the system behaves unexpectedly. This technique is called monitoring and is one of the most popular techniques not only for debugging distributed systems, but also detecting issues such as performance drops, service availability and resource usage.
The advantage of this technique is that if enough information is recorded then that informa-tion can be used to diagnose unexpected behavior. Furthermore, the informainforma-tion is useful even if the system is behaving as expected, for reasons such as improving the efficiency of the system. Many out-of-the-box solutions for monitoring distributed systems exist, and
Introduction
effort to integrate one into an existing system is small when taking into account the gain. However, it requires large amounts of space to store all the information that the system main-tainers might need to debug, and the developers still have to filter through great amounts of information in order to find the relevant data that they might need to detect and resolve a bug.
Monitoring, while far from perfect, is the current preferred way to debug distributed sys-tems. It was designed with distributed architectures in mind, and provides more benefits than just detecting and fixing unexpected behavior.
As shown in this section, traditional debugging techniques are mostly ill-suited to debug com-plex distributed systems, such as the ones based in the micro-service architecture. Many suffer from the problem of having been designed to debug single sequential processes and thus don’t easily generalize to distributed environments. Others, such as monitoring, while easily applica-ble to distributed environments are still expensive and time-consuming. This dissertation argues that a better framework for debugging distributed systems can be devised based on the traditional techniques presented in this section.
A good framework for distributed debugging shall meet the following requirements:
• Inexpensive: A good debugging framework should minimize the costs with storage by stor-ing only the required information to diagnose instances of unexpected behavior. Further-more, it should strive to make the effort required to filter the collected data minimal, so that the debugging process can be made shorter freeing the developers time for other tasks and potentially reducing expensive downtime.
• Non intrusive: Every modification to source code has the possibility of introducing new bugs. This is obviously not ideal in a debugging framework, where the primary objective is to reduce the number of bugs in the system. As such, modifications to the source code should be kept to a minimum. This also has the benefit of facilitating the adoption of the framework.
• Gradually adoptable: In order to encourage adoption, gradual integration into existing sys-tems must be possible. This also opens up the possibility of gradually adjusting the imple-mentation according to empirical evidence for each specific system.
• Generalizable: A distributed framework should be able to detect and offer assistance in resolving bugs resulting from the distributed nature of the system, but also ones that are confined to one single process.
This dissertation builds on the basic techniques exposed in this section to create an approach that complies with the requirements exposed for a good framework for debugging distributed systems. Specifically it describes a way of recording an execution of a program so that it can be replayed in the future under controlled conditions, such as in the programmer’s development machine and attached to an interactive debugger.
Introduction
1.2
Dissertation Structure
This chapter introduces the context around the topic debugging in distributed microservice-based environments and makes the argument for the necessity of a new, general-purpose framework for distributed debugging.
The concepts and background information that are necessary to better understand the content of this document are explained in Chapter2. Chapter3describes the state of the art and presents a survey of previous research regarding the topic of distributed debugging and a comparison be-tween existing approaches and solutions. An overview of the problem and the challenges that the approach proposed in this document aims to address is detailed in Chapter4. Chapter5describes one of the main contributions of this dissertation, which is a novel approach to debug microser-vices based on the recording and replay of past executions of a program. An implementation of a prototype tool according to the approach outlined in Chapter5is explained in detail in Chapter
6. A case study has been conducted and is explained in Chapter7. The conclusions of the work developed in this document are described in Chapter8.
Chapter 2
Background
The purpose of this chapter is to introduce concepts that are necessary to be aware of in order to understand the ideas outlaid in this document. The approach to debugging microservices described in Chapter5and the prototype implementation of that approach found in Chapter6make heavy use of the concepts explained in the remaining sections of this chapter.
2.1
SOA and Microservices
Service-oriented architecture, or SOA, is a style of software design where each component in a system provides a service to other components through a communication protocol, such as HTTP or RPC, over a network. According to the definition of SOA found in [Gro14], a service must have the following properties:
• It logically represents a business activity with a specified outcome. • It is self-contained.
• It is a black box for its consumers.
• It may consist of other underlying services.
Service orientation promotes loose coupling between services. In effect, this improves modu-larity as it means that component services may dynamically bound to other services, and services can be replaced without introducing downtime or otherwise affecting the other systems in the sys-tem. SOA encourages the establishment of clearly defined interfaces between services which offer the sole point of access. These interfaces along with the communication protocol establish the only contract between services in the system.
Service orientation also enables the concept of location transparency. This means that the consumer of the service has no information about where the service actually resides, meaning that it can be in the same machine, in a server accessed through the internet or even in multiple remote machines. The actual physical location of the provider service is hidden behind a point of
Background
access that is published by a service broker, whose main responsibility is to maintain and provide information about the services to any potential consumers.
Another benefit of SOA is re-usability. Because services are self-contained, there is nothing stopping one service being part of multiple applications. In fact, from the point of view of the producer service, there is no distinction between the consumers; it does not know whether they are part of the same application or not because there is no concept of application at the service level.
In an enterprise setting, SOA also provides an organizational benefit: Services can be inde-pendently developed and tested by different individuals or teams. This increases parallelism in development, and thus development speed. In addition, it promotes good testability as each team relies on the services maintained by others to behave in accord with specifications.
Lastly, service-orientation also facilitates availability and scalability of a system by clustering services, therefore, introducing redundancy in the system. Additionally, clustering might be done only in the services that represent a bottleneck in the overall system throughput, further increasing efficiency.
Microservices are a variant of SOA. The main difference lies in service granularity, or in other words, in how big a service must be. There is no official prescription regarding this, but the consensus in the industry seems to be that a service in the microservice architecture must be feasibly maintained by a team of 6 to 8 developers. Another differentiation between microservices and SOA is that microservices are usually more loosely-coupled. As with any development style, SOA and microservices are subject to some criticisms [fow14].
• It can be hard to establish service boundaries. When splitting a monolithic application into microservices, it can be hard to define where exactly the split should be made. If the split is made into too few services, it can be hard for one small team to maintain and the benefits gained from the transition are limited. On the other hand, if the split is made into too many services, then this may cause large dependencies between services to the point that development in one service may be blocked by the development on another. Additionally, this might also cause developers to lose sight of the overarching system goals and focus too much on the goals of the service itself.
• Communication between services over a network has a higher time cost because of network latency and message processing than in-process calls in a traditional monolithic system. Depending on the complexity of the system, the number of messages exchanged, and the purpose of the application the added overhead might be prohibitive.
• While testing individual services may become simpler with SOA and microservices, testing the overall application might become more complicated, because of the great number of dependencies between services. For the same reason, deployment can become more com-plicated.
Background
Figure 2.1: Differences between monolithic applications and microservices [Fow]
• If there is not enough reusability of the services, the benefits of moving to SOA or microser-vices are greatly diminished and the same effect can be achieved with internal modulariza-tion while maintaining a simpler design.
• Data consistency is significantly harder to guarantee in microservice-based architectures. For example, if each microservice maintains its own database as opposed to one centralized application for the whole application, then a programmer can no longer rely on the database to ensure data consistency. Additionally, protocols such as 2-phase commits are inadequate for microservices since they increase coupling between services.
• Microservices usually increase the cognitive load for programmers. The architecture intro-duces additional complexity and new problems such as network latency, message serializa-tion, load balancing, and fault tolerance. New failure modes are also introduced which are difficult to reason about. Debugging becomes increasingly complicated as the sources of problems are potentially more.
Despite all the challenges, microservices have been rising in popularity in the last few years. Its advocates claim that this architectural style further reinforces a modular structure for the sys-tem, facilitates independent development and deployment of each service and increases developer freedom to choose whichever languages and technologies are best suited for the job at hand [Mic].
2.2
The Java Instrumentation API
The Java instrumentation framework provides services that allow Java agents to instrument pro-grams running on the Java Virtual Machine, through the mechanism of byte-code manipulation.
Background
A Java instrumentation agent can be started at VM startup, through a command line switch as such:
-javaagent:jarpath[=options]
Where the jarpath is the path to the agent’s JAR file and options is the options passed to the agent — a string whose parsing and interpretation is left to the agent’s implementation. An agent can also be loaded after the VM has been started, through an implementation-specific mechanism. More than one agent can be loaded into one application and multiple agents can share the same jarpath.
According to the Java Instrumentation API documentation [Ins], an agent is a JAR file crafted according to the following specifications:
• The manifest of the agent JAR file must contain the attribute Premain-Class, which is the name of the agent class. The agent class must implement a public static premain method similar in principle to the main application entry point. After the Java Virtual Machine has initialized, each premain method will be called in the order the agents were specified, then the real application main method will be called. Each premain method must return in order for the startup sequence to proceed.
The premain method may have one of two signatures. The JVM will first attempt to invoke the method with the following signature:
public static void premain(String agentArgs, Instrumentation inst);
If this method is not implemented, the JVM will instead try to invoke the method with the following signature instead:
public static void premain(String agentArgs);
• In addition to a premain method, the agent class may also implement an agentmain method that is invoked when the agent is started after the Java Virtual Machine has started. This method is not invoked when the agent is started at JVM startup through a command line switch.
The agentmain’s method signature is the same as the signature of the premain method. • If the agent is meant to be loaded after the JVM has been started it must, in addition of
implementing the agentmain method, contain the attribute Agent-Class, containing the name of the agent class, in the manifest of its JAR.
In addition to the Premain-Class and Agent-Class attributes mentioned so far, the agent’s JAR manifest file may also define the following attributes:
• Boot-Class-Path: A list of paths to be searched by the bootstrap class loader. This attribute is optional.
Background
• Can-Redefine-Classes: A Boolean value that determines whether or not the agent can rede-fine classes. This value is optional, and is particularly useful if the agent wishes to modify JVM classes.
• Can-Retransform-Classes: A Boolean value that determines whether or not the agent can re-transform classes. As with Can-Redefine-Classes this value is optional and useful if the agent wishes to modify JVM classes.
• Can-Set-Native-Method-Prefix: A Boolean value that determines whether or not the agent can set native method prefix. This value is also optional.
The agent class is loaded by the system class loader. This class loader is typically responsible for loading the class that contains the main method. The agent options are passed to the agent through the agentArgs parameter, and if the agent cannot be resolved the JVM will abort. The second argument passed to the agent’s premain or agentmain methods is an instance of the In-strumentation interface. This interface provides the services needed to instrument Java code. The instrumentation capabilities offered by this interface are purely additive, meaning that they do not modify the application state or behavior. An instrumentation instance is created when the JVM is launched with a Java agent via a command line switch, or when a JVM provides a mechanism to load agents after the JVM is started.
Once an agent acquires an instance of the Instrumentation interface, it can use it to modify the classes that are loaded. The Instrumentation instance allows the registration of instances of the ClassFileTransformer interface. A ClassFileTransformer instance implements a single method named transform.
Once a transformer has been registered with Instrumentation.addTransformer, the transformer will be called for every class definition and redefinition. The transform method takes an array of bytes that contains the bytecode of the class that is being loaded. If no transformations are needed, then the method must return null. Otherwise, it should create a new byte array, copy the input bytes into it, make the desired transformations and then return the new array. The input byte array must not be modified. This technique is called bytecode manipulation and is very powerful.
Obviously, manually altering every byte in the byte array in order to modify the class is not very practical. As such some libraries have emerged that aim to facilitate this process. Some of the most popular are:
• ASM [ASM]: A Java bytecode manipulation framework that provides a set of common bytecode transformations and analysis algorithms that can serve as a base to build more complex tools. It is designed for performance, aiming to be as small and as fast as possible. • Javassist [Jav]: A library to modify Java bytecode. It offers two levels of API — The bytecode-level API allows the modification of classes using Java bytecode, while the source-level API allows the transformation of classes using only Java source text, requiring no knowledge of Java bytecode.
Background
Figure 2.2: The instrumentation process of a Java program
• Byteman [Byt]: A higher-level framework that allows the injection of Java code into appli-cation methods. It makes bytecode transformations easier by implementing an abstraction layer in front of the transformer. The places in the code where the code is to be injected are defined in rule files written in a specific format.
It’s worth mentioning that bytecode transformations can be applied not only to user-defined classes but also to core JDK classes. While most of the core classes will be loaded before the agent’s premain method is called, and thus will not be transformed, it is possible to re-transform them. This requires the attribute Can-Retransform-Classes to be true in the agent’s JAR manifest. Then the Instrumentation.retransformClasses method can be used to re-transform most of the core classes of the JDK. This is obviously extremely powerful and disruptive, and if it is not used with care might break programs in all sorts of unexpected ways.
Common uses for the instrumentation API are program profiling and analysis without modify-ing the original program source code. Other uses include class generation and code optimization and obfuscation.
2.2.1 Byteman
Of the bytecode manipulation frameworks mentioned in this section, Byteman is the one used extensively in the implementation described in Chapter6. Byteman is a bytecode manipulation tool that enables the modification of previously compiled Java code. Byteman uses a system of rules to specify when and wherein the program the code should be modified. Rules are written in the Event Condition Action, or ECA [byt18], rule language. Figure2.1shows the basic skeleton of a Byteman rule. The most common keywords are the following:
• RULE: This keyword defines the beginning of a rule and is followed by a text string that defines the name of the rule. The name can be any string, as long as there is no other rule with the same name. The rule’s name is used merely for identification in the source code, for example, in the case of compilation errors in the rule.
• CLASS: This is followed by the fully qualified name of the Java class that is to be instru-mented. The name of the Java class can be preceded by the “ˆ” character. In such cases, the rule instruments all classes that are sub-classes of this one.
Background
• METHOD: This keyword is followed by the name of the method of the class that is to be instrumented. It can contain just the name of the method, in which case it will instrument all the methods with that name, or the name of the method followed by a list of type parameters, in which case it will only instrument the methods whose signature matches the number and type of the parameters defined.
From this point on, the arguments passed to the method are available to the next statements. The following are some of the most relevant:
– $0: Holds the instance of the instrumented class where the method has been invoked. – $1, $2, ..., $n: Hold the arguments that are passed to the instrumented method. – $!: Holds the return value of the instrumented method.
• AT: This keyword determines the point at which the method should be instrumented. Some of the valid values that this can take are:
– AT ENTRY: The code in theDOblock is inserted right before the first instruction of the method.
– AT EXIT: The code in theDOblock is inserted just before the return statement of the method.
• BIND: This keyword permits the binding of the values available at this point, such as the arguments passed to the rules or the instance of the object that is being instrumented, to other variable names.
In Chapter6binds are used extensively in order to improve the readability and facilitate the comprehension of the listings.
• IF: This keyword is followed by the conditional statement that determines whether or not the rule is valid for a specific instance. It is checked every time before execution of the code that is defined after theDOkeyword.
• DO: This is the keyword that defines the code that must be executed in the defined point in the instrumented method. This keyword is followed by the Java code that is to be executed. It can include multiple statements separated by a semi-colon.
• ENDRULE: This keyword defines the end of the rule.
There is another important keyword, which isHELPER. This keyword is followed by the fully qualified name of a Java class whose methods can be used in theIFand DOblocks, instead of writing the code directly in the rule definition.
Background
1 # rule skeleton
2 RULE <rule name>
3 CLASS <class name>
4 METHOD <method name>
5 BIND <bindings>
6 IF <condition>
7 DO <actions>
8 ENDRULE
Listing 2.1: The skeleton of a Byteman rule [byt18].
2.3
Protocol Buffers
Protocol buffers [Pro] are a mechanism to serialize and de-serialize data. It has been developed by Google. In protocol buffers, the format and structure of the data is defined in special files with the
.protofile extension. These files are then used to generate source code in different languages that allow reading and writing the data to a variety of formats. Furthermore, protocol buffers allow updating the structure of the data without breaking programs that make use of a previous version of that structure.
Chapter 3
Literature Review
This chapter presents an analysis of the state of the art of the work done in the area of debugging large highly distributed systems, including those based in the micro-service architecture.
3.1
Introduction
The field of distributed programming is still fairly recent. It is a field of active research and many approaches have been proposed.
Proposed approaches for debugging distributed systems differ in many ways. One of the dif-ferences in the phase of the process in which they are applicable. Debugging can be thought of as a process consisting of five steps [CPP]:
1. Recognize that a bug exists. Bugs manifest themselves through unexpected program be-havior. Some are particularly serious and cause the program to terminate abnormally. Those are easy to spot. Others manifest themselves in more subtle ways and can go unnoticed for a long time. The best way to find bugs early is through comprehensive testing.
2. Isolate the bug. Bugs are contained to a section of the source code. Isolating the bug is identifying the section of code in which the error lay, thus restricting the search space for the next step in the process.
3. Identify the cause of the bug. Knowing the general vicinity of the bug is not enough. The next step is identifying what is actually causing it. The previous step was concerned with finding the where. This step aims to find the why.
4. Determine a fix for the bug. Having understood where the bug is and why it the program behaves as it does, the programmer is then equipped to determine how the problem can be mitigated..
Literature Review
5. Apply the fix and test it. The last step is to validate whether or not the devised solution fixes the bug. Furthermore, it also aims to ensure that no other bugs have been introduced. The distributed debugging approaches exposed for the remainder of this chapter aim to im-prove either step 2, step 3, or both steps from the aforementioned process. The reason is that those are generally the most time-consuming and thus benefit the most from any increased efficiency.
3.2
General Approaches For Debugging Distributed Systems
Several tools and frameworks for debugging distributed systems have been proposed. These usu-ally take one of the following approaches to the debugging process [BWBE16]:
• Tracing: Collecting information about a request throughout its lifetime in the system, in-cluding cross-process boundaries.
• Log analysis: Manually or automatically analyzing system logs in order to detect and diag-nose anomalies.
• Visualization: Transforming execution data in a high-level visualization of the system, in order to make it more understandable for a programmer.
• Record and Replay: Capturing information about an execution of the program so that it can be deterministically replayed as many times as necessary.
Each outlined approach has its advantages and disadvantages. The following sections discuss in further detail each approach and analyze particular implementations of each.
3.3
Distributed Tracing
Distributed tracing is a method to monitor distributed systems. It consists of instrumenting the source code of a program in order to collect and record metrics regarding its functionality. It is commonly used to track requests, such as user requests in a web service, and collect important metrics such as latency and failure rate. It helps the programmer identify where failures happen and understand what is causing worse than expected performance.
In microservices systems, requests often span more than one service. Distributed tracing can follow requests through service boundaries, provided that each service is adequately instrumented. The information recorded for each individual step that a request takes through a distributed system is referred to as a span. Spans reference other spans and together they form a complete trace, an end-to-end visualization of the lifetime of a request in the system. This is achieved by assigning a unique request ID to each incoming request and passing that ID to all services involved in handling the request. In that way, each service in the system knows to which trace a certain span belongs to, therefore binding the collected data to the request that originated it.
Literature Review
Distributed tracing shines when used in conjunction with tools to aggregate, search and visu-alize the data. Such tools would, for example, aggregate request tracing data according to the ID of the request. Some alert programmers when a metric exceeds a pre-defined threshold, helping maintain high service availability and discover latent bugs.
Distributed tracing is one of the most used approaches to debugging in large-scale, complex distributed environments. Despite its popularity, there are some difficulties:
• Metric overload. It often is the case that distributed tracing produces overwhelming amounts of data. Once the instrumentation is in place, it is usually easy to track more and more met-rics. In the end, it’s up to the programmer to exercise its best judgment in deciding how many and which metrics to keep track of without obscuring potentially important informa-tion.
• Vendor lock-in. There are few standards when it comes to the structure of traces. There-fore, each distributed tracing tools rolls their own implementation, making it hard to switch between tools. Efforts have been made to develop vendor-neutral APIs, namely through OpenTracing[Opeb].
• Runtime overhead. Distributed tracing tools and frameworks must aim to maintain runtime overhead to a minimum. Failure to do so affects the distributed system negatively and can defeat the purpose of adding the distributed tracing infrastructure in the first place.
• Storage requirements. Traces are often collected locally in each node in a distributed system, and transferred later for centralized processing. This may make it unsuitable for services with high throughput.
Many distributed tracing tools have been proposed, such as Magpie [BIN03], Pinpoint [CKF+02] and X-Trace [FPKS07]. Each has made new important contributions to the design of distributed tracing tools. But perhaps none is as influential has Dapper [SBB+10], a distributed tracing frame-work developed at Google. The following section analyzes Dapper and its contributions to the state of the art.
3.3.1 Dapper
Dapper is a low-level tracing framework to trace infrastructure services developed at Google. The stated goals of Dapper are low overhead, application-level transparency, and scalability. It records a collection of timestamped messages and events that trace all the work that is done in the system, starting in a single initiator.
The framework traces the work done on the system starting from a single initiator. It uses an annotation-based [BIN03] monitoring scheme, meaning that every record is tagged with an identi-fier that binds the records together and with the original request. This approach has the drawback of requiring the instrumentation of programs. Dapper takes advantage of the homogeneous in-frastructure at Google and restricts instrumentation to only a small set of libraries shared by all
Literature Review
applications. Causal relationships between spans are preserved by representing a trace as a tree structure, in which each node is a span and each edge indicates a causal relationship. Thus, the root span is causally related to all the other spans in the three, while a leaf span has only a causal relationship with its parent.
One of the new contributions introduced by Dapper is the usage of sampling to maintain low overhead, which is especially useful in services that are highly sensitive to latency variations. The Dapper developers use a uniform sampling probability to select which requests to record. They found that recording on average 1 out of each 1024 requests is likely to still capture data of interest in high throughput services. However, in services with lower traffic, those sampling rates are not high enough to ensure that important information is not missed.
3.3.2 Conclusion
Many of the benefits provided by Dapper are only possible due to the uniformity of Google’s distributed environment. Most applications share some common libraries and use the same pro-gramming languages. Unfortunately, this does not translate very well to microservice architec-tures. Microservices are inherently heterogeneous. The work required for instrumentation would be very high and so would the effort required to maintain interoperability. However, some of the ideas introduced by Dapper have proven to be useful and are widely used today.
Furthermore, while distributed tracing may provide great insights into the workings of a dis-tributed application, and does offer important performance information, it is not very useful for debugging past the point of recognizing the existence of the bug. It may, in certain cases, provide the programmer with useful information to isolate the bug, but when it comes the time to identify its cause, the programmer is left to its own devices.
3.4
Log Analysis
Debugging through log analysis consists of examining the free text logs generated and collected by applications in order to recognize and isolate a bug. It is perhaps the most primitive form of distributed debugging, but it offers something that all other approaches do not: it works even if the system being debugged cannot be modified. In an age where third-party cloud services are ever more commonly part of the architecture of most distributed systems, log analysis is indeed often the only kind of debugging approach that is applicable.
This approach relies on relevant and informative log messages being present throughout the code, and in specific in the section that contains the problem. Adequately placing log statements requires experience and familiarity with the code base. It is essential to strike a balance between having enough information to assist in the debugging process and cluttering log files and obscuring relevant information with irrelevant messages.
Production services tend to produce large amounts of logs. So many, in fact, that trying to find relevant information is akin to trying to find a needle in a haystack. This problem is amplified in distributed systems since the logs may be scattered in the different machines on which the services
Literature Review
run. A programmer, if left unassisted, has little hope of finding the logs that he needs to help identify or isolate a bug.
Efforts [XHF+10] have been made to automate the task of filtering and organizing the infor-mation recorded by logs. The big difficulty in extracting inforinfor-mation from log messages is their unstructured, free text nature. One of these attempts is analyzed in the following section.
3.4.1 Mining Console Logs
Researchers at Berkeley [XHF+10] have attempted to detect bugs in programs by automatically analyzing the application logs. They devised an approach to transform logs into more structured data with a higher signal to noise ratio. The process is described as having three steps:
1. Log Parsing. The aim of this step is to extract information from logs such as message types and message variables. Message types are messages with the same structure while message variablesare the variable parts of each message.
Static source code analysis is used to extract all possible log messages and build an index of message templates to which logs are matched to at runtime.
2. Feature Creation. Many problems can only be detected in a sequence of messages. This step focuses on grouping related messages in preparation for problem detection.
Messages are grouped in two different ways. Firstly, based on state variables, which enu-merate the possible states of an object in a program. Secondly, based on the number of times an identifier shows up in the logs. Different features lead to different types of problem detection.
3. Machine-Learning. Finally, statistical methods are utilized to identify common patterns and therefore discover anomalies in the data, which may indicate the presence of a bug.
This approach has proven successful, but with some faults. Namely, it does not detect certain classes of bugs such as those that arise in distributed environments because of the contention for resources and race conditions.
3.4.2 Conclusion
The unstructured nature of log messages makes it so that the potentially useful information that can be automatically extracted is not enough to reliably detect many classes of bugs. For that reason, log analysis remains of limited usefulness for developers and is best used when the quantity of log messages is small or there is no other option.
In addition, log analysis aims at identifying and recognizing that a bug exists in the program. It offers little help in isolating the bug, and none at all in the further steps of the debugging process.
Literature Review
3.5
Visualization
Distributed systems based on microservices can be highly complex and thus hard to understand for the human brain. It is that complexity that inspired work on visualization tools that aim at making distributed systems more transparent to the programmer. They offer a high-level visual abstraction over the underlying system that can be used to spot anomalies and understand the overall behavior of the system.
The downside of such approaches is that the underlying structure of the system is hidden and important details may be omitted. Such details could otherwise be used by programmers to define or refine their hypothesis about the root cause of problems in the system.
The following section analyzes a visualization tool called Theia [GKT+12] that takes advan-tage of application-specific knowledge about Hadoop [Had] in order to help developers identify problems in their clusters.
3.5.1 Theia
Theia [GKT+12] is a visualization tool that analyzes application-level logs for large Hadoop clus-ters, generating visual signatures of each job’s performance. The idea behind Theia, as in most other visualization tools, is to provide a high-level overview that allows developers to explore the large amounts of data collected by the monitoring systems and narrow down the root cause of the issues.
Theia exploits application-specific knowledge about Hadoop to provide relevant insights to the developer and distinguish application from infrastructure errors with some amount of success.
3.5.2 Conclusion
Visualization tools appear to be most useful when used in a well-known and controlled environ-ment, about which assumptions can be made that allow the tool to create relevant and insightful visualizations. This is not the case in large scale highly distributed systems based on microser-vices, which are mostly heterogeneous. Assumptions made about services would likely not hold for others. This limits the usefulness of visualization tools for providing generic performance information about the system.
3.6
Record and Replay
Record and replay consists of capturing an execution such that it can be replayed deterministically any number of times that a programmer might need to identify and resolve a problem.
This section goes over three debugging frameworks based on the record and replay approach: GoReplay [GoR], D3S [LGW+08] and Friday [GAM+07].
Literature Review
3.6.1 GoReplay
GoReplay [GoR] is a tool which allows the recording of production traffic and replaying that traffic during testing. It provides the ability to replay the traffic at different speeds and to re-write requests. Furthermore, it performs the analysis and recording of network traffic without modifying or otherwise affecting the applications that use it.
GoReplay supports a large but limited number of network communication protocols, including binary protocols. Furthermore, it is aimed at replaying only network traffic, and not necessarily the execution of a program. If part of the execution of the program is non-deterministic, because it depends on random number generation or for any other reason, then GoReplay does not ensure that the program executes in the same way. This somewhat limits the application of this tool.
3.6.2 D3S
D3S [LGW+08] is a framework that models the execution of a distributed system as a state ma-chine in which states are snapshots of the system with different global timestamps. It allows developers to write functions that check invariants in the system. During runtime, global snap-shots of the system are recorded. When an invariant is violated the checker functions signals it and the developer is able to inspect the system snapshots that lead to the faulty state, effectively replaying the execution.
D3S can be fairly expensive to implement. Firstly it requires large amounts of data to be collected, though this can be mitigated by using buffers to store the system snapshots, that is only persisted in case an invariant is violated. Secondly, it introduces overhead in the system that can go up to 8%. Whether or not this is significant in a system is up to the maintainers to decide.
While D3S does not require changes to the existing source code of a program, it is not as non-invasive as it might appear at first sight. This is because it rewrites the binary modules of the process that it is attached to. Assuming D3S is well tested this should not have any nefarious consequences, but as any modification to the source code, it carries the added risk of introducing bugs in the system.
Furthermore, using D3S effectively requires some level of familiarity and expertise with the system being debugged, since developers have to write functions to check function invariants. This also adds the risk of false positives due to bugs in the checker functions.
In the other hand, D3S presents some significant advantages. It can be adopted gradually, in the sense that developers can write new checker functions incrementally in order to cover larger and larger sections of code. Additionally, it has also been shown empirically to work in some real-life systems to detect and diagnose some classes of bugs.
Ultimately, the greatest problem with D3S is that it cannot diagnose bugs if they are not cov-ered by the invariants checked by the checker functions. This requires extra development effort in designing and implementing comprehensive checker functions and even then some bugs are bound to remain undetected and thus unsolved.
Literature Review
3.6.3 Friday
Friday is a system that is based on another tool by the same authors called liblog [GASS06]. Liblog itself provides the record and replay functionality, while Friday manages the replay in the context of an interactive debugger, such as GDB [GDB]. Furthermore, it extends debugger functionality with the addition of distributed breakpoints and watchpoints that allow a programmer to inspect the state of the system during the replay.
Liblogis the core of Friday. It works by intercepting system calls and recording informa-tion that is non-deterministic, such as random number generainforma-tion or the sending and receiving of messages so that the execution can be replayed deterministically.
The limitations of Friday have much to do with the limitations of the underlying liblog library. Liblogproduces vast amounts of data, which makes it unsuitable for systems with high throughput. Furthermore, it also introduces some amount of network overhead, since it embeds a Lamport clock [Lam78] in each message in order to preserve causal relationships.
Friday provides something that most other solutions do not, and that is the ability to assist developers for all steps in the debugging process, up until testing and validating that any devised solution works as expected.
3.6.4 Conclusion
Record and replay based approaches tend to be more complex than others. They tend to introduce a large runtime and network overhead and require large amounts of storage in order to record enough information to accurately replay executions.
However, as demonstrated by Friday, such approaches have the potential of being of great use throughout the entirety of the debugging process, as opposed to just helping to identify and isolating a bug. With record and replay systems a programmer has access to the entirety of the state of the application at each and any moment and can inspect it as they would in any other se-quential single process application. In fact, record and replay tools have the possibility of making distributed debugging more similar to the debugging of single process applications.
3.7
Conclusions
Different approaches to debugging distributed environments, and in specific microservices, each have their own merits and drawbacks. Most can be used complementary, for the areas in which one excel is usually the ones other lack. It is common, for example, for monitoring systems to take advantage of distributed tracing to collect data and visualization tools to present it to the programmer. Table3.1presents a summary of the analysis done in this chapter.
Unfortunately, most approaches focus on helping the programmer identify a problem. When it comes to identifying the root cause of a bug the developer is left fending for themselves. This is where the record and replay approach outshines the others. While it is much more complex, and most likely requires some familiarization with debugging tools such as interactive debuggers, it
Literature Review
assists developers in identifying the cause of the problem by allowing them to inspect the state of the program at each step in the execution.
Literature Review T able 3.1: Summary and comparison between the approaches to deb ugging a distrib uted micro-service based system. A ppr oach T racing Log Analysis V isualization Record and Replay T ar get Helps to identify the cause of a b ug Helps to identify the cause of a b ug Helps to identify the ex-istence of a b ug, as well as isolating it and identi-fying its cause Helps with all steps of the deb ugging process, since identifying the existence of a b ug to determining and applying a fix Cost Lo w to medium o v erhead cost, b ut possibly high storage cost Lo w o v erhead cost, possibly high stor -age cost Lo w o v erhead cost, pos-sible high costs of stor -age and m aintenance of the visualization service or tool Higher o v erhead and high cost of storage In v asi v eness Some what in v a-si v e, may require modification of source code Not v ery in v asi v e Not v ery in v asi v e Can be in v asi v e and re-quire modifications to the source code Gradual adoption Possible, at the cost of missing infor -mation Possible Possible, although at the cost of usefulness Possible
Chapter 4
Problem Statement
The overarching problem addressed in this document, as described in Chapter1is of how to best debug microservices. This chapter breaks that overarching problem into more specific issues, that are addressed throughout the remainder of this thesis.
4.1
Main Issues
Part of what makes distributed programs harder to debug comes down to their increased com-plexity and high concurrency. Developers generally find that reasoning about concurrent events is more challenging than sequential ones. Furthermore, the fact that distributed programs run si-multaneously on multiple processors, each of which maintaining their own time reference, further complicates the debugging process.
Cheung [CBM90] identified the following difficulties in debugging distributed programs: • Maintaining precise global states. Local state on each machine is readily available, but
com-bining them into a global state requires that all processors clocks be synchronized, which is difficult to achieve.
• Large state space. The state space includes each machine’s own state as well as the records of the interactions between all machines in the system. Large amounts of data are produced, from which the interesting parts must be selected to be analyzed. This is often non-trivial and requires manual effort by the developer or system operator. When the system grows to a certain size, this task becomes cumbersome.
• Interaction between multiple asynchronous processes. Bugs that result from the interaction between processes are often sporadic and hard to reproduce, resulting from synchronization issues or race conditions.
• Communication limitations. Communication delays and limited bandwidth may render some traditional debugging techniques impractical.
Problem Statement
• Error latency. The time interval between the occurrence of the error and it’s detection is usually larger in a distributed program. By the time the error is detected, it may have propagated to other nodes in the system. This may make it harder to find the root cause of the issue.
A great number of issues in distributed programs arise from troubles in the communication between the nodes in the system. Microservices are even worse in this aspect. Because they are made of smaller, more focused components, then this means that there are usually more nodes in the system when compare to a distributed system comprised of more monolithic components. This larger number of nodes has two consequences:
• Each individual node has a larger number of dependencies. • A larger number of messages are exchanged in the system.
This makes this kind of issues even more common. The problem with all these issues is that they are mostly transient, and transient errors are very hard to reproduce. Often programmers are left scavenging through logs to find any information that might help root cause the problem, with no other recourse. Sometimes the problems are even left unsolved due to lack of logging and the development team must wait until the next time the problem occurs to try and find the root of the issue.
4.2
Objectives
The goal of this work is to define a conceptual framework for debugging microservices and will fo-cus on one main research question: “Can a specific execution of a system be faithfully replayed in a developer’s local machine?”
An execution is a subset of all the behaviors encoded in a programs source code that is man-ifested every time a program executed. Some executions may be anomalous meaning that the behavior of the program is different from the expected behavior. Anomalous executions are espe-cially interesting in the scope of this document as they represent bugs in a program. While some instances of anomalous behavior might be automatically detected, others require knowledge of the business rules and the purpose of the program and thus require manual inspection of the results. That is not the scope of the framework, but in order to use the framework, it is necessary to have a system in place to detect anomalous executions that might be of interest to be replayed.
It is also important to define what it means to faithfully reproduce an execution. A naive approach to determine whether or not a replayed execution is faithful to a reference execution would be to check if the output produced is the same. However, that would not be enough since it is possible that the replayed execution produces the same results in a different way. That is not ideal since the purpose of the framework is to allow a programmer to inspect the internal state of the system. Evidently, this is only useful if the state of the system during the replay is the same as the state of the system in the point in the original execution.
Problem Statement
The approach described in this document to reproduce an execution requires first recording said execution so that it can then be replayed. As such, to answer the main research question it is necessary to answer other questions as well:
• Can enough information be recorded in an execution without introducing overhead in exe-cution time that impacts the viability of the system?
• Is the amount of data generated during the execution small enough to be viably stored in either the machines executing the instrumented program or in centralized storage?
• Can the recording and replaying of executions be performed without modifying the source code of the program?
The solution proposed in this document attempts to achieve replay-ability of executions of programs running in the Java Virtual Machine without modifying the source code of the program, and relying purely on bytecode manipulation. This is unlike all the other solutions analyzed in Chapter3.
4.3
Methodology
In order to answer the research questions enunciated in this chapter, a prototype tool was de-veloped based on the record and replay approach described in Chapter5. Details regarding the implementation of the prototype can be found in Chapter6.
This prototype has been used to conduct a case study in a Java service that is part of a larger system based on the microservice architecture. The description of that case study can be found in Chapter7. The purpose of this case study is to collect and analyze data in order to answer the research questions.
![Figure 2.1: Differences between monolithic applications and microservices [Fow]](https://thumb-eu.123doks.com/thumbv2/123dok_br/15587069.1050079/29.892.177.745.115.492/figure-differences-monolithic-applications-microservices-fow.webp)

![Figure 5.1: The Internet protocol suite [int]](https://thumb-eu.123doks.com/thumbv2/123dok_br/15587069.1050079/54.892.242.704.139.512/figure-the-internet-protocol-suite-int.webp)