A.M.R. Neiva, P.C.S. Carvalho, I.M.H.R. Antunes, M.M.V.G. Silva, A.C.T. Santos, M.M.S. Cabral Pinto, P.P. Cunha
PII: S0375-6742(13)00215-X
DOI: doi:10.1016/j.gexplo.2013.10.014
Reference: GEXPLO 5244
To appear in: Journal of Geochemical Exploration Received date: 10 November 2012
Accepted date: 19 October 2013
Please cite this article as: Neiva, A.M.R., Carvalho, P.C.S., Antunes, I.M.H.R., Silva, M.M.V.G., Santos, A.C.T., Pinto, M.M.S. Cabral, Cunha, P.P., Contaminated water, stream sediments and soils close to the abandoned Pinhal do Souto uranium mine, central Portugal, Journal of Geochemical Exploration (2013), doi: 10.1016/j.gexplo.2013.10.014
This is a PDF file of an unedited manuscript that has been accepted for publication. As a service to our customers we are providing this early version of the manuscript. The manuscript will undergo copyediting, typesetting, and review of the resulting proof before it is published in its final form. Please note that during the production process errors may be discovered which could affect the content, and all legal disclaimers that apply to the journal pertain.
ACCEPTED MANUSCRIPT
Contaminated water, stream sediments and soils close to the abandoned
Pinhal do Souto uranium mine, central Portugal
A.M.R. Neivaa,*, P.C.S. Carvalhoa, I.M.H.R. Antunesb, M.M.V.G. Silvaa, A.C.T. Santosa,
M.M.S. Cabral Pintoc, P.P. Cunhad
a Department of Earth Sciences and Geosciences Centre, University of Coimbra, Portugal b
Polytechnic Institute of Castelo Branco, Portugal
c Department of Geosciences, University of Aveiro, Portugal, CNC – Centre for Neuroscience and Cell
Biology, University of Coimbra, Portugal, Geosciences Centre, University of Coimbra, Portugal
d Department of Earth Sciences, IMAR – Marine and Environmental Research Centre, University of
Coimbra, Portugal,
A B S T R A C T
The Pinhal do Souto mine exploited a quartz vein containing uranium minerals, mainly autunite and
torbernite. This vein intersects a two-mica granite containing 10 ppm U and uraninite. The mine was
exploited underground and produced 93091 kg U3O8 between 1978 and 1989 and was then closed down.
Two dumps were left in the mine area and these are partially covered by natural vegetation. Groundwater
and surface water have a similar slightly acid-to-alkaline pH. The 2
2
UO is abundant and complexed with 2
3
CO , under neutral to alkaline pH. Metals and arsenic concentrations in the water increase during the
dry season due to the evaporation. Uranium concentration in the water increases (up to 104.42 g/l) in the wet season, because secondary uranium minerals are dissolved and uranium is released into the water. Soils
tend to retain a higher concentration of several metals, including U (up to 336.79 mg/kg) than stream
sediments (up to 35.68 mg/kg), because vermiculite from the former could adsorb it more easily than could
kaolinite from the latter. The Fe-oxides precipitate retains the highest concentrations of several metals,
including U and Th (up to 485.20 and 1053.12 mg/kg, respectively) and the metalloid As, because it is richer
* Corresponding author.
ACCEPTED MANUSCRIPT
in oxyhydroxides and organic matter than stream sediments and soils. The median concentrations of Fe, As,
Cd, Pb, Sb, Th, U, W and Zn in soils from this area are higher than in European soils of the FOREGS data.
Waters from dry and wet seasons, stream sediments and soils are contaminated and must not be used. This
area was compared with another Portuguese abandoned uranium mine area. The former mine caused a lower
environmental impact attributable to it having lower sulfide concentration and mineral alteration than in the
latter.
Keywords: Abandoned uranium mine; Water; Stream sediments; Soils; Contamination
1. Introduction
The extraction of uranium ore produces tailings, large volumes of contaminated waste rocks and heap-leach residues accumulated in dumps at the mine site. The sulfides present are oxidized, causing acidification of water and the release of metals. The erosion and weathering of dumps cause contamination of surface water and groundwater (e.g Gómez et al., 2006) leading to contamination of stream sediments and soils (e.g. Lottermoser and Ashley, 2005, 2006; Lottermoser et al., 2005; Kipp et al., 2009). Metals and metalloids are fixed by inorganic phases (e.g. Mulligan et al., 2001), as well as organic matter (e.g. Schaller et al., 2011). In the wet season and wet climates, acid mine drainage development and leaching of dumps are dominant pathways of contaminants into the surrounding environment. Recent rehabilitated uranium mine sites located in wet climates have been successfully remediated (e.g. Lottermoser and Ashley, 2006 and papers therein).
Portugal has about 58 uranium deposits that have been exploited and later abandoned, most of them without any remediation processes. Rare Portuguese studies on
environmental pollution associated with uranium mines have been reported (e.g. Pinto et al., 2004; Antunes et al., 2011). This paper presents the investigation of environmental impacts caused by the Pinhal do Souto abandoned uranium mine, located in central
ACCEPTED MANUSCRIPT
Portugal, focusing on water, stream sediments and soils. Such information reinforces the evidence of environmental and human health risks associated with old abandoned mining areas.
2. Geological setting and mineralized quartz vein
The Pinhal do Souto uranium mine is located at the western end of the village of
Tragos, near Mangualde, 120 km NE of Coimbra, in central Portugal (Fig. 1a, b) and,
geologically it belongs to the Central Iberian Zone of the Iberian Massif. This area consists of two granites and is represented on the Fornos de Algodres Portuguese geological map (Gonçalves et al., 1990), where granites dominate. A coarse-grained porphyritic biotite granite partially surrounds a medium-grained two-mica granite (Fig. 1b). Both Variscan granites intruded the schist-greywacke complex.
The mine consists of a mineralized quartz vein trending N15-32º E, 65-77º ESE, up to 3 m thick at the surface and 18 m thick at depth, which intersects the two-mica granite. This vein is white in colour, locally smoked and reddish, but the last colour is due to Fe-oxides.
It contains uranium minerals mainly autunite, Ca(UO2)2(PO4)2.10-12H2O and torbernite,
Cu(UO2)2(PO4)2.11H2O, but also uraninite, UO2, meta-torbernite, Cu(UO2)2(PO4)2.8H2O,
sabugalite, HAl(UO2)4(PO4)4.16H2O, parsonite, Pb2(UO2)(PO4)2.2H2O, phosphuranylite,
Ca(UO2)4(PO4)2(OH)4.7H2O and black uranium oxides. The quartz vein is mainly
accompanied by an altered lamprophyre. The host granite is altered showing some kaolinite, secondary muscovite and silicification close to fractures.
The uranium mine was exploited underground and had two levels and a gallery at the
hillside. The mine produced 93091 kg U3O8, retained in ore minerals with 0.72 % U, from
ACCEPTED MANUSCRIPT
3. The mine site
The Pinhal do Souto uranium mine site is located in a steep, dipping N hillside with altitudes ranging from 650 to 550 m and a slope of about 13%, which is crossed by a NNE trending stream of torrential ephemeral regime. The surface drainage runs to N and W towards the valley of the Ludares stream, which has a very low water flux in the summer and belongs to the Dão river drainage basin.
The annual average temperature in the 1971-2000 period varied from 21.4ºC to 6.9ºC, reaching 40.5ºC in July-September and -7.3ºC to -5ºC in December-February. The rainfall dominates in the winter and the area receives about 1200-1400 mm/year. In 2009/2010 and
2010/2011, the temperature was lower and the precipitation was 10 mm/month lower in
February than in April and 80 mm/month higher in November than in February, although the temperature did not change significantly in these two months (SNIRH, 2012).
The mine gallery is closed and it is flooded in the rainy season. The mine has a vertical extraction shaft and a ventilation shaft. Some hydraulic backfill was also used with tailings from other uranium mines. Two mine waste heaps forming the dumps, were left, one with rock waste and another with low grade ore, and these are partially covered by natural vegetation. The stream sediments are mainly composed of weathered granite and quartz grains. Humic cambilsol holding low develop brown soil (Food and Agriculture Organization of the United Nations, 2006) occurs in the area. The area is almost covered by natural vegetation, consisting mostly of pines, some oaks and herbaceous species, but vineyards and orchards also occur in the valleys and there is also some pasture.
4. Analytical methods
Four wells, two springs, three streams and two mine galleries, all located close to the Pinhal do Souto abandoned uranium mine (Fig. 1c) made a total of eleven sampling points
ACCEPTED MANUSCRIPT
that were chosen to collect water samples four times during a year in April and July 2010 during the dry season, and November 2010 and February 2011 during the wet season, obtaining a total of 44 water samples. Water from wells was collected 1-2 m below the
water level and samples from springs, streams and mine galleries were collected 20 cm
below the surface. Temperature, pH, Eh, dissolved oxygen, electrical conductivity and
alkalinity were measured in situ. The samples were filtered through 0.45 m pore size
membrane filters. They were acidified with HNO3 at pH 2 for the determinations of
cations by Inductively Coupled Plasma Optical Emission Spectrometry (ICP-OES), using a Horiba Jovin Yvon JY2000 2 spectrometer with a monochromator. Anions were
determined in non-acidified samples by ion chromatography with a Dionex ICS 3000 Model. The precision was mainly better than 5%, but only better than 15% for Na and Al. Duplicate blanks and a laboratory water standard were analysed for quality control. Total dissolved solids and total solids were determined, corresponding to the weight of material
obtained by evaporating of 100 ml of filtered and unfiltered water through 0.45 m filters,
respectively. The analytical data show ion balance errors within 5% for most water
samples.
A total of 15 samples of stream sediments were collected (Fig. 1c). They were from six places that receive surface drainage from the dumps and the mine gallery, five local streams and four places in the Ludares stream that receive some mine drainage, but at some distance from the mine. A sediment very rich in colloidal Fe-oxides, precipitated from a groundwater close to the old mine was also collected (sample 5; Fig. 1c). A total of 47 soil samples were collected inside or close to the mine area of influence, using a sampling grid of 0.5x0.6 km (Fig. 1d). The stream sediment and soil samples were
ACCEPTED MANUSCRIPT
at 40º C, disaggregated with a rubber hammer and sieved through a 2 mm nylon sieve for the determinations of mineralogical, physico-chemical and chemical data. The pH of the samples was measured in a solid-water suspension (liquid/solid ratio of 2.5), whereas electrical conductivity (EC) was measured in a liquid/solid ratio of 1/5. Representative stream sediment (6) and soil (13) samples from the Pinhal do Souto area containing distinct Th and U concentrations were selected to determine organic matter (OM) and cation exchange capacity (CEC), while grain size and mineralogical identifications were also obtained in some of these representative stream sediments (4) and soil (9) samples. The grain size was determined by laser diffraction analysis of the < 2 mm fraction, using a Coulter LS 230 laser granulometer and the accuracy of the grain size analysis is up to 10%. The mineralogical identifications were carried out by X-ray diffraction, using a Philips PW 3710 X-ray diffractometer, with a Cu tube, at 40 kV and 20 nA. The
mineralogical composition of the < 2 m fraction was obtained in oriented samples before
and after heating up to 550ºC and with ethylene glycol treatment. These determinations were carried out at the Department of Earth Sciences, University of Coimbra, Portugal. The cation exchange capacity (CEC) was determined as the sum of extractable bases and extractable acidity by the ammonium acetate solution (pH7) method (Thomas, 1982) with a precision of 2%. The organic carbon content was determined using an elemental
analyser. After oxidation at 1100ºC, CO2 was quantified by an NIRD (near infrared
detector). The organic matter (OM) was calculated applying a factor of 1.724, on the assumption that OM contains 58% organic carbon (Nelson and Sommers, 1996), with a precision of 2% for stream sediment and 5% for soil. These two determinations were carried out at the Department of Edaphology, University of Trás-os-Montes and Alto Douro, Portugal.
ACCEPTED MANUSCRIPT
Samples < 250 m of stream sediments and soils were digested with aqua regia (3:1
HCl-HNO3), filtered through a 2 m filter and analysed by an ICP-OES to determine
several metals and metalloids at the Department of Earth Sciences, University of Coimbra. An in-house reference soil, prepared for aqua regia analysis, was validated using the certified sewage sludge amended soil BCR 143 R. Duplicate blanks and a laboratory standard were included in each batch of 30 samples. The detection limits in mg/l for stream sediments and soils are 0.003 for Sr, 0.001 for Zn, 0.01 for Al, Fe and Pb, 0.02 for Cr and Mn, 0.03 for Co and Cu, 0.04 for Cd and Ni, 0.05 for As, Sb, Th and W and 0.135 for U. The precision for determinations in stream sediments is 4-12 %, with the highest value for Cu, and 1-16 % for soils with the 16% for Ni.
The spatial distribution of physico-chemical parameters, metals and metalloids of soils of the abandoned Pinhal do Souto uranium mine area is tested with a coupled
methodology that performs geochemical distribution and geostatistical interpolation. A multivariate statistical analysis, using principal component analysis (PCA) is applied to the variables of waters and soils. In soils, a subsequent synthesis of the variables (PCA technique, Spearman) will reduce the outliers’ weight. The results suggest spatial
correlations between some variables and independence of others, which are characterized individually. Concentrations below the detection limits are considered zero. Samples without determined concentrations are not included in the PCA.
5. Results
5.1. Water samples
The physico-chemical parameters and chemical analyses of water samples from the Pinhal do Souto abandoned uranium mine area are shown in Table 1. The water sample from a spring (PS7) was collected upstream of the old mine area to represent the
ACCEPTED MANUSCRIPT
background or natural levels (Fig. 1c). The PS5 water is from another spring that experiences some influence from the old mining activities, whereas PS9 and PS10 are groundwater samples from the mine gallery. The PS1, PS2, PS3 and PS8 are groundwater samples collected from wells and the PS4, PS6 and PS11 samples are from streams located inside the area of the Pinhal do Souto abandoned mine (Fig. 1c). According to the Piper classification, most water samples are of sodium-potassium type and chloride type or do not contain a dominant anion. However, those from springs and the mine gallery are of mixed cations, but of bicarbonate type.
The electrical conductivity ranges from 22 to 235 S/cm and the total dissolved solids
are within the range 14-131 mg/l, indicating that these waters are poorly mineralized. pH values range from 5.1 to 8.5 and increase in February (Table 1).
In general, As, Ba, B, Cd, Co, Cr, Cu, Li, Ni, Pb, Sr, Th and Zn show higher
concentrations in April and July than in November and February due to the evaporation
effect (Table 1, Fig. 2a,b, c). Uranium with concentrations ranging from 29.59 g/l to
104.42 g/l has a distinct behaviour as its concentration increases during rainfall periods
(Fig. 2f). Furthermore, Na, Ca, Mg, HCO and 3 NO show the highest concentrations in 2
most water samples in July and November (Table 1, Fig. 2d) and in some groundwater samples (PS5, PS9 and PS10). These cations and anions are probably related to the weathering of the country two-mica granite (Fig. 1c), because they have higher
concentrations in the spring water sample (PS5) and mine gallery water samples (PS9 and PS10) than in water samples from wells and streams, as those water samples show the
highest electrical conductivity values (Table 1). The highest NO concentrations of these 2
water samples are probably due to the fact that they have the lowest redox potential values (Eh). In general, surface water and groundwater have higher electrical conductivity in July
ACCEPTED MANUSCRIPT
and November than in April and February, which is attributed to the higher concentrations
of Na, Ca, Mg and HCO and 3 NO in July and November. No significant distinction 2
occurs in the physico-chemical parameters and chemical composition (e.g. Ba, Cd, Cr, Cu, Ni, Pb, Zn, Th and U concentrations) of groundwaters and surface waters (Table 1).
Samples PS1, PS3 and PS8 are from wells and PS4 and PS11 are from streams (Table 1) affected by fertilizers and therefore show the highest SO24(Fig. 2e) and
3
NO concentrations.
Principal component analysis (PCA) was applied to 28 determinations (measured physico-chemical parameters and analysed anions and cations) in 44 water samples from the Pinhal do Souto uranium mine area (Table 2). The three first component axes (PC1, PC2 and PC3) explain most of the data variability (75% of the total variance). The first principal component axis PC1 shows the association of B, Ba, Cd, Co, Cr, Cu, Li, Ni, Pb, Sr, Zn, As and Th with its positive loading, whereas U is associated with negative loading in the PC1, supporting that finding the U has a distinct behaviour from the others, as its concentration increases in the wet season and the other concentrations increase in the dry season.NO ,2
3
HCO , Na, Ca, Mg and Mn show a high loading in PC2 (Table 2), as they present the highest concentrations in most water samples in July and November (Table 1). The association of Cl, NO , 3 SO24and K with the negative loading of PC3 (Table 2) is
attributed to the water samples being affected by fertilizers, which have the highest
2 4
ACCEPTED MANUSCRIPT
5.2. Stream sediments
The textural characteristics, physico-chemical parameters and concentrations of metals and metalloids of stream sediments from the Pinhal do Souto abandoned uranium mine area are given in Table 3. They are dominated by sand (46.3-85.5 %) and have 12.8-47.5 % silt and 1.7-6.2 % clay. They consist of quartz, K-feldspar, plagioclase, muscovite, chlorite, kaolinite, illite and smectite. Of the clay minerals, kaolinite dominates (up to 46
%). The Fe-oxides precipitate (PS-SED5) has 19.8 % silt and 3.9 % of the < 2 m fraction,
which is amorphous. It has the highest organic matter content, cation exchange capacity and electrical conductivity (Table 3).
Organic matter in soils and recent sediments has a much higher CEC (up to 500 cmol/kg) than clay minerals or Al-Fe-oxides (up to 150 cmol/kg) (Mirsal, 2004). The sediment from the Ludares stream has the lowest organic matter content and cation exchange capacity (Table 3). The mine drainage stream sediment PS-SED20 with the highest silt (47.5 %) and clay (6.2 %) contents has the highest cation exchange capacity (4.53 cmol/kg), as shown in Table 3, but no correlation was found between these two parameters, because kaolinite is the most abundant clay mineral in stream sediments and has a low adsorption capacity.
There is no significant distinction between the average pH values of stream sediments that received the direct uranium mine drainage (4.8) and the local stream sediments (4.7), but a slightly higher value (5.2) appears in the Ludares stream sediments.
In general, stream sediments that received direct drainage from the abandoned uranium mine have the highest Fe, Mn, Cd, As, Zn, Pb, Cr and Th concentrations (Fig. 3).
However, some of these sediment samples have similar As and Th contents to those of local stream sediments (Table 3, Fig. 3). Cobalt and Ni were only detected in some stream sediments that received the mine drainage and in the Fe-oxides precipitate. Uranium was
ACCEPTED MANUSCRIPT
only detected in one sample from Ludares stream and in the Fe-oxides precipitate (Table 3). The Fe-oxides precipitate is the richest in organic matter (7.26%), electrical
conductivity (200 S/cm), As (3.71 g/kg), Cd (1.24 g/kg), Co (1.34 g/kg), Fe (278.9 g/kg),
Th (1.05 g/kg), U (485 mg/kg), W (108 mg/kg) concentrations (Table 3). A correlation matrix was calculated for the data of the stream sediment samples (Table 4), but the Fe-oxides precipitate sample was not included in this calculation, because it has a different origin and higher concentrations of metals and metalloids when compared with the other samples. There are significant positive correlations (r > 0.7 at 95% level), between Fe concentration and As, Cd, Cr, Pb and Th concentrations. These correlations in stream sediments reflect the capacity of Fe-oxyhydroxides to adsorb metals and metalloids in the surface environment (e.g. Abdelouas, 2006; Grosbois et al., 2007; Root et al., 2007; Cabral Pinto et al., 2008; Carvalho et al., 2012) and indicate the influence of mine dumps, because the stream sediments receiving the direct drainage from these mine dumps have the highest concentrations of Fe, As, Cd, Cr, Pb and Th (Table 3).
5.3. Soils
The textural characteristics, physico-chemical parameters and concentrations of metals and metalloids of soils from the Pinhal do Souto uranium mine area are presented in Appendix A. Although the number of soil samples with determined textural characteristics is limited, they are dominated by sand (79.9-97.4 %) and the clay content is very low (0.3-1.8 %). The soil samples consist of quartz, K-feldspar, plagioclase, muscovite, kaolinite, illite, smectite and vermiculite. Of the clay minerals, kaolinite is generally the most abundant (up to 50 %), but vermiculite dominates (up to 46 %) in a few samples and smectite is only very rarely important (up to 55 %). The organic matter concentrations are very low ranging from 0.72 to 4.95 % (Appendix A). The cation exchange capacity is also
ACCEPTED MANUSCRIPT
low 0.12-5.13 cmol/kg. The electrical conductivity values range from 10 to 103 S/cm,
suggesting low contamination. The pH values are acidic, as they range from 3.2 to 5.4, which is attributed to the influence of the granite background and in some soil samples is also due to mine tailings. The concentrations of metals and metalloids have a great range and most of them have two or more values below the detection limit, except for Fe and Zn (Appendix A).
Significant positive correlations (r > 0.7 at 95% level) occur between the concentrations of As and Al, Cu, Fe, Mn, Pb, Sb, Sr and W (Table 5). Tungsten is also positively
correlated with Al and Sb, Ni with Co, and Sr with Pb. These correlations can be associated with the occurrence of these metals and metalloids in the U-mine and their similar geochemical behaviours.
Principal component analysis (PCA) was applied to these physico-chemical parameters and 14 metals and 2 metalloids determined in 47 soil samples collected from the Pinhal do Souto uranium mine area (Table 6). Most of the data variability is represented by the principal components (PCs), which can explain the behaviours of metals and metalloids and their absorption and retention according to soil properties. The first three factors (PC1, PC2 and PC3) explain most of the data variability (70% of the total variance). Most metals and metalloids, such as Al, As, Cd, Co, Cr, Cu, Fe, Mn, Ni, Pb, Sb, Sr, Th, W and Zn are correlated, as confirmed by PC1 and space association (Table 6). The mobility of metals decreases as the pH approaches neutrality, which is correlated with EC, and confirmed by PC2 space association (Table 6). The independence of U is confirmed by PC3 factor (Table 6) and suggests a distinct behaviour relatively to other metals as it is probably mainly associated with the two-mica granite from Pinhal do Souto.
Concentrations of metals and metalloids were interpolated to the samples that are located in the nodes of the irregular grid used to collect soil samples in the study area,
ACCEPTED MANUSCRIPT
using the multi-Gaussian Kriging implemented in SpaceSat v.2.2.17 (BioMedware, 2011). These concentrations were transformed into normal scores to attenuate the impact of extreme values on the computation of the variogram, and then interpolated using ordinary Kriging. The results (Kriging estimate and predicted variance) were back-transformed using the empirical procedure developed by Saito and Goovaerts (2000). Total metal and metalloid contents were grouped in four classes (minimum; median; median plus one standard deviation; median plus two standard deviations; higher values). Maps of Cr, Th and Zn total concentrations show patterns that define a coincident anomaly zone, inside the uranium mine area and close to the dumps. Chromium and Th are more widely dispersed and with lower values (Fig. 4). In the northern part of the area, the Zn anomaly (Zn > 258 mg/kg) is more widely dispersed than the U anomaly (167 mg/kg). Another U anomaly occurs in the southern part of the area. Both U anomalies are to close the mine dumps. Maps of Sb, Pb, Sr and W define coincident anomalies that are located to the west of the mine dumps (Fig. 4), but with different concentrations (Sb > 99 mg/kg; Pb > 404 mg/kg; Sr > 41 mg/kg; W > 56 mg/kg). There is another Pb anomaly which is related to the dump located to the north of the area. Two larger W anomalies with higher
concentrations are defined (Fig. 4).
6. Discussion
6.1. Geochemistry of waters, stream sediments and soils
The pH values of groundwater samples from the gallery within the Pinhal do Souto uranium mine, when it was operating and autunite and torbernite were actively dissolved, ranged from 4.49 to 6.18 (Magalhães et al., 1985). After the mine was closed in 1989, primary minerals altered to secondary uranium minerals due to weathering. In general, secondary minerals are phosphates, carbonates, sulphates, oxyhydroxides and silicates
ACCEPTED MANUSCRIPT
(Stefaniak et al., 2009). From April 2010 to February 2011 the pH values of groundwater range from 5.1 to 8.5 (Table 1) and are similar to those of surface water (5.1-8.3); they ranged from slightly acid to alkaline because sulphide oxidation is not enough to produce an acid pH and the formation of secondary minerals that retained the acidity, metals and metalloids until rainfall was favoured (Bigham and Nordstrom, 2000; Jambor et al., 2000; Jerz and Rimstidt, 2003). This neutral to alkaline pH is typical of waters close to uranium mines (e.g. Lottermoser et al., 2005; Gómez et al., 2006).
The water chemistry is mainly controlled by pH, Eh and the type of complexing agents present (Langmuir, 1997). Most samples collected in February 2011 do not contain Cd, Co, Cr, Cu, Fe, Li, Ni, Zn and Pb (Table 1), because they generally have the highest pH values (6.84-8.48, Table 1), which favours the formation of secondary minerals such as hydroxides and oxyhydroxides (Jambor, 1994). But in general, As, Ba, Cd, Co, Cr, Cu, Li, Ni, Pb, Sr, Th and Zn exhibit higher concentrations in summer than in winter (Table 1, Fig. 2a, b, c) due to the higher temperature, which causes water evaporation. In general, stream sediments that receive the direct mine drainage due to erosion and leaching of mine dumps have the highest concentrations of Fe, Mn, Cd, As, Zn, Pb, Cr and Th (Fig. 3, Table 3), which are adsorbed in organic matter and oxyhydroxides. In the stream sediments, Fe-oxides precipitate (PS-SED5) is the main carrier of Fe, As, Cd, Co, Sr, Th, U and W (Table 3), because it immobilizes metals and metalloids adsorbed onto the surfaces of
Fe-oxyhydroxides (e.g. Frau and Ardau, 2004; Pinto et al., 2004; Grosbois et al., 2007; Cabral Pinto et al., 2008; Carvalho et al., 2012) and some is retained in organic matter. Variations in pH and Eh or a flood event can cause dissolution of these Fe-oxyhydroxides and thus release high amounts of toxic metals and metalloids into the environment (Siegel, 2002; Carvalho et al., 2012). The Fe-oxides precipitate (PS-SED5) is also the richest in organic matter (Table 3) which also retains metals and metalloids.
ACCEPTED MANUSCRIPT
The Na, Ca, Mg and HCO concentrations of waters from the Pinhal do Souto uranium 3
mine (Table 1) are related to Mn and those variables are dependent on the redox potential (Eh). The experimental studies indicate that Mn concentrations in waters have been attributed to the reductive dissolution of Mn oxyhydroxides that are mediated microbially
and by the cation exchange (Petrunic et al., 2005; Loomer et al., 2011). The Mn2+ released
by reduction reactions is important in the cation exchange reaction between the water and
cations (Na+, Mg2+ and Ca2+) adsorbed on the solid phase. HCO is produced during the 3
interaction of Mn oxides with dissolved organic matter in water. The Fe is not associated with these variables, because Fe-oxyhydroxides are hardly dissolved compared to Mn-oxyhydroxides (Alloway, 1995). The general decrease of water Eh in November 2010 (Table 1) caused the Mn oxyhydroxides dissolution and was the reason why most of the
water has high values of the cations and alsoNO . However, in general they reach the 2
highest concentrations in water in July because of the intense water evaporation. Their higher concentrations in water collected in July and November 2010 than in samples collected in April 2010 and February 2011 justify the higher electrical conductivity values in the first two than in the second two months (Table 1).
The U concentrations in water range from 29.59 g/l to 104.42 g/l (Table 1), which
are typical of waters from uraniferous areas (e.g., Bernhard et al., 1996; Noller et al., 1997; Iwatsukí and Yoshida, 1999; Landa, 1999). U (VI) is much more soluble than U
(IV) and occurs as 2
2
UO under neutral and alkaline conditions and forms complexes with
carbonates, phosphates, vanadates, fluorides, sulphates and silicates (Langmuir, 1997). Uranyl carbonate and sulphate complexes, are the most stable complexes under water Eh-pH conditions (Lottermoser et al., 2005). The highest concentrations of U occur in surface water and groundwater from the Pinhal do Souto uranium mine area in the wet season
ACCEPTED MANUSCRIPT
(November 2010 and February 2011) (Table 1, Fig. 2f), when the flow is high and
leaching from the dumps and mineralized quartz vein takes place as is common in uranium mine areas (e.g. Pinto et al., 2004).
Of the stream sediments, only one sample from the Ludares stream and the Fe-oxides precipitate retain U up to 0.49 g/kg in the latter (Table 3), because U was adsorbed onto Fe-oxyhydroxides (Lottermoser and Ashley, 2006; Abdelouas, 2006) and probably retained in the organic matter, which is a main uranium binding (Idiz et al., 1986).
The low phosphate and sulphate concentrations in water samples from the Pinhal do Souto uranium mine area with high uranium concentration, in particular those related to the mine gallery (Table 1) suggest the occurrence of uranium as uranyl tricarbonate
species, as these minerals are extremely stable and soluble (Clark et al., 1995; Stefaniak et al., 2009). Those samples from the spring (PS5) and mine gallery (PS9 and PS10) were selected for speciation, as they show the highest U concentrations (Table 1). The U speciation was obtained using the Visual Minteq version 3.0 (Gustafsson, 2010). The
calculations predict that 2
2
UO is abundant and complexed with CO32in water samples
PS5, PS9 and PS10 (Table 7). The formation of strong carbonate complexes
2 2 3 2(CO )
UO and UO2(CO3)43is common under neutral to alkaline pH conditions
(Grenthe et al., 1992), as in these three water samples from the Pinhal do Souto uranium mine (Tables 1, 7).
The high uranium concentration of up to 71.85 g/l in the water sample (PS7) from
upstream of the mine influence suggests that the country granite contains uranium. The Variscan two-mica granite from the Pinhal do Souto uranium mine, which is cut by the mineralized quartz vein, has a mean 10 ppm U concentration (Silva and Neiva, 2000) and contains uraninite (Cabral Pinto et al., 2008, 2009). This granite belongs to the Beira
ACCEPTED MANUSCRIPT
batholith, which contains uranium minerals (Cotelo Neiva, 2003) and is an important source of uranium for surface water and groundwater (Porcelli et al., 1997).
In fluvial systems affected by the mine drainage, the contaminant concentrations in sediments tend to decrease downstream of the contaminant sources, due to hydrodynamic and chemical processes (Hudson-Edwards et al., 1996; Cidu et al., 2011). This attenuation is observed in Fig. 3, as there is a decrease in the concentrations of potential toxic metals and metalloids from the effluents that receive mine drainage for the Ludares stream, which flows a long away from the mine dumps and has a higher hydraulic flow than its effluents. The metals Al, Cd, Co, Cr, Cu, Fe, Ni, Pb, Sr, Th, W and Zn and the metalloids As and Sb continue to be released from the mine dumps, leaching through the mine area and are retained in soils (Appendix A, Fig. 4). These soils have an acid pH (3.2-5.4, Appendix A), which influences the adsorption capacity of metals and metalloids (Appendix A, Fig. 4), because these metals and metalloids are more mobile and more available in acid than neutral conditions (Alloway, 1995). Cr, Th, U, Zn and Pb anomalies of soils are related to the mine dumps (Fig. 4). The organic matter forms soluble and insoluble complexes with heavy metals causing their retention in soils (Kabata-Pendias and Mukherjee, 2009). But the organic matter concentration is very low in these soils, ranging from 0.72 to 4.95% (Appendix A), so it did not play a significant role. These soils are also poor in the clay fraction (content up to 1.8%), because they consist mainly of sand (up to 97.4%, Appendix A). Therefore, the clay minerals that are good to retain metals and metalloids could not have played an important effect. Metals and metalloids are probably mainly retained in the vermiculite and Fe-oxyhydroxides of soils (James and Barrow, 1981), which is also
supported by the PC1 association (Table 6).
Although the number of solid samples analysed for texture is small, the stream sediment samples have a higher clay content (1.7 to 6.2 %) than the soil samples (0.3 to
ACCEPTED MANUSCRIPT
1.8 %). The Al, As, Sr and Zn attain higher concentrations in a few stream sediment samples than in soil samples (Table 3, Appendix A). The Al content is a major constituent of kaolinite, which occurs in stream sediments. But kaolinite does not easily adsorb metals and metalloids, which explains that generally the stream sediments are not richer in them than soils. In general, soils tend to have higher Cu, Mn, Pb, Sb, U and W concentrations than stream sediments (Table 3, Appendix A), because soils contain vermiculite which adsorbs metals and metalloids. The Fe-oxides precipitate has higher As, Cd, Co, Fe, Sr, W, Th and U concentrations than the soils (Table 3, Appendix A), because its concentrations of iron-oxides and organic matter are higher than those in soils. Therefore, the Fe-oxides precipitate has a great capacity to adsorb metals and the metalloid As.
6.2. Contaminated waters, stream sediments and soils
In general, water from the Pinhal do Souto uranium mine area has higher NO , As, Cd, 2
Cr, Cu, Fe, Ni and Pb concentrations than the acceptable levels for drinking water under Portuguese law (Decree, 2007), and higher U content than the level indicated by the World Health Organization (WHO, 2010) (Table 1, Fig. 2a, b, f). The sample PS5 also has a concentration of Co that is higher than permitted for agricultural use (Portuguese Decree, 1998).
To assess the contamination degree in stream sediments, the pollution index is given by the enrichment factor (EF), which was calculated for all metals and metalloids using the equation EF = [(elementsample/Alsample)] / [(elementbaseline/Albaseline)] (Sutherland, 2000;
Andrews and Sutherland, 2004). EF has five categories: < 2 – no pollution; 2-5 – moderate pollution; 5-20 – significant pollution; 20-40 – very strong pollution; > 40 – extreme pollution. Geochemical normalization of trace elements to a conservative element, which has a uniform flux in the surface environment for a long period of time,
ACCEPTED MANUSCRIPT
compensates for changes in the concentrations of trace elements (Sutherland, 2000). The Al content was used for normalization, as Al is almost immobile in the surface
environment. The average of each element from the five regional stream sediment samples collected in the Pinhal do Souto uranium mine area (Table 3) was used as a baseline value, because background values depend on the scale and lithology and the use of background values obtained in large areas consisting of several lithological units can lead to spurious results (Reimann and Garrett, 2005). However, Co, Ni and U concentrations are below the detection limit in these five analysed samples. So, the concentrations of these elements (Co-9 ppm; Ni-19 ppm and U-0.5 ppm) given by Ferreira (2000) and Ferreira et al. (2001) for a low-density geochemical survey in Portugal were used.
The stream sediments that receive mine drainage (Table 3) are significantly to very strongly polluted in Cr (EF > 5, up to 38); moderately significantly to very strongly
polluted in Mn (EF > 2, up to 23); moderately to significantly polluted in Pb (EF > 2, up to 6) and moderately polluted in Cd, Co, Fe, Th and Zn (EF > 2). The sediment from the Ludares stream that receives indirect contribution from the mine drainage is extremely polluted in U (EF = 97) and moderately polluted in Pb (EF = 3). The pollution found in streams that flow through the uranium mine area is greatly attenuated and disappears in the Ludares stream, except for one point, which receives a direct contribution from the mine drainage and has a very high U concentration (36 mg/kg, Table 3).
The level of contamination in soils from the Pinhal do Souto uranium mine area is defined by comparing the total concentrations in soils with the maximum accepted levels in soils according to Italian Legislation (Decreto Ministeriale, 1999), which are higher for industrial areas than for public, private green areas and residential sites. Most of the soils studied have high As, Cd and Sb concentrations that render them unfit for any use (Fig. 5). Some soil samples have higher Cu, Pb and Zn concentrations than the acceptable level for
ACCEPTED MANUSCRIPT
public, private green areas and residential sites. This legislation does not provide values for some metals. The maximum contents of Fe, As, Cd, Co, Ni, Pb, Sb, U, W and Zn of these soils are higher than those of Portuguese soils from the FOREGS data (Table 8). The median values of Fe, As, Cd, Pb, Sb, Th, U, W and Zn of soils from this Portuguese area are higher than those of soils from European countries of the FOREGS data (Salminen et al., 2005). The concentrations of Cd, Pb, Sb, U and W of soils from this Portuguese area also attain higher maximum concentrations than those of soils from European countries (Table 8). Therefore, the soils from the Pinhal do Souto mine area are contaminated due to the dumps.
6.3. Comparison of the environmental impacts caused by two abandoned uranium mines in Portugal
The environmental impacts caused by the abandoned uranium mine from Pinhal do Souto (PS) are compared with those produced by another abandoned uranium mine located in Vale de Abrutiga (VA), central Portugal (Table 9). The PS mine was exploited
for four years longer and produced more 3091 kg U3O8 than the VA mine, and both were
closed down in 1989. However, the contamination of water in U, Pb and Cu is higher in the VA area than in the PS area, though the contamination with Th is higher in the PS area. The both the surface water and groundwater from the VA area have a higher electrical conductivity than those from the PS area, supporting the greater abundance of metals in waters from the VA area. The water from the VA area has an acid pH, whereas that from the PS area has a slightly acid to alkaline pH, because quartz veins from the VA area contain more sulfides than the quartz vein from the PS area which altered into oxides and
2 4
SO is formed and has a much higher value in waters from the VA area (Table 9). The
ACCEPTED MANUSCRIPT
exploitation in the PS area. Therefore, secondary uranium minerals should be more
abundant in the VA quartz veins than in the PS quartz vein and dumps. Secondary minerals retain acidity and metals are liberated into water, particularly during the wet season (e.g. Jerz and Rimstidt, 2003). Water from the VA area is more contaminated with U, Pb and Cu than that from the PS area (Table 9). Water from the VA area is also contaminated with
2 4
SO , Fe, Mn and Ra and must not be used for drinking and irrigation (Pinto et al., 2004),
whereas that from the PS area is also contaminated with NO , As, Cd, Cr and Ni and 2
must not be used as drinking water (Portuguese Decree, 2007; WHO, 2010).
In both areas, stream sediments that receive drainage from the U mines were compared with sediments collected in local streams and found to be generally enriched in Fe, Co, Cu and Zn but those from the PS area are also generally enriched in Pb and Th. The
contamination of these stream sediments in Cu, Zn, Co and Fe is higher in the VA area and the contamination in Th and Pb is higher in the sediments from the PS area. The stream sediments of the VA area are also contaminated in U. However, the Fe-oxides precipitate related to the PS mine has the highest U, Co, Fe and Th contents (Table 3), showing the importance of Fe-oxyhydroxides to adsorbing metals (e.g. Carvalho et al., 2012).
7. Conclusions
The Pinhal do Souto abandoned uranium mine caused contamination in several metals including Th and U and metalloids in water, stream sediments and soils, which must not be used. The OM content and precipitation of Mn, Fe oxyhydroxides in stream sediments due to the high pH values of water are the most important for the retention of metals and metalloids and some have higher concentrations than in soils. In general, stream sediments have a higher clay content than soils, but soils tend to show higher Cu, Mn, Pb, Sb, U and
ACCEPTED MANUSCRIPT
W concentrations, which may be adsorbed by vermiculite, and a lower Fe content than stream sediments. The Fe-oxides precipitate is richer in As, Cd, Co, Fe, Sr, W, Th, U and organic matter than stream sediments and soils, as these metals and metalloid are retained in organic matter and oxyhydroxides. Specifically, the dumps must be rehabilitated.
Uranium concentrations in water from the Pinhal do Souto area are of particular concern because they are permanently above the human consumption limits, in both the wet and dry seasons, whereas metals and arsenic generally cause environmental concern in the dry season (April and July). In the wet season, secondary uranium minerals are
dissolved and uranium is released into the solution. Metals and arsenic are released in lower concentrations than uranium, as sulphides occur in low amounts. In the dry season, their concentrations increase due to evaporation, whereas U is scavenged from the solution through the formation of secondary minerals.
This area was compared with the abandoned uranium mine area at Vale de Abrutiga. Although both mines were closed down in 1989 and the former was exploited for four
years longer and produced 3000 kg more U3O8, it caused less of an environment impact
on the water and stream sediments than the latter. This is attributed to the fact that sulfides are less abundant and underground mineral alteration was less intense in the former, as
shown by a lower SO24concentration in water than in the latter, which was exploited in an
open pit. In the Pinhal do Souto uranium mine area, soils have higher median values of Fe, As, Cd, Pb, Sb, Th, U, W and Zn than soils from European countries of the FOREGS data (Salminen et al., 2005), because they are contaminated due to the dumps.
ACCEPTED MANUSCRIPT
Acknowledgements
Thanks are due to M. Blanco for determination of grain size of samples from stream sediments and soils and the preparation of clay fractions for X-ray diffraction (XRD), to C. Maia for XRD diagrams, to Prof. J.F.C. Mendes for determinations of cation exchange capacity and organic matter in samples of stream sediments and soils, and to S.M. Lima for some information on the mine site. Financial support was provided by the Portuguese Government for the project Pest-OE/CTE/UI0073/2011 to the Geosciences Centre through the Portuguese Foundation for Science and Technology. This paper benefitted from the helpful comments of the Associate Editor Enrico Dinelli and two anonymous referees.
References
Abdelouas, A., 2006. Uranium mill tailings. Geochemistry, mineralogy and environmental impact. Elements
2, 335-341.
Alloway, B.J., 1995. Heavy metals in soils. 2nd Edn, Blackie Academic & Professional, London, 368p. Andrews, S., Sutherland, R.A., 2004. Cu, Pb and Zn contamination in Nuuanu watershed, Oahu, Hawaii.
Science of the Total Environment 324, 173-182.
Antunes, S.C., Pereira, R., Marques, S.M., Castro, B.B., Gonçalves, F., 2011. Impaired microbial activity
caused by metal pollution: A field study in a deactivated uranium mining area. Science of the Total
Environment 410-11, 87-95.
Bernhard, G., Geipel, G., Brendler, V., Nitsche, H., 1996. Speciation of uranium in seepage waters of a mine
tailing pile studied by time-resolved laser-induced fluorescence spectrometry (TRLFS). Radiochimica.
Acta 74, 87-91.
Bigham, J.M., Nordstrom, D.K., 2000. Iron and aluminum hydroxysulfates from acid sulfate waters. In
Alpers, C.N., Jambor, J.L., Nordstrom, D.K. (Ed), Sulfate minerals: Crystallography, geochemistry, and
environmental significance. Mineralogical Society of America. Reviews in Mineralogy and
Geochemistry 40, 351-403.
ACCEPTED MANUSCRIPT
Cabral Pinto, M.M.S., Silva, M.M.V.G., Neiva, A.M.R., 2008. Geochemistry of U-bearing minerals at Vale
de Abrutiga uranium mine, central Portugal. Neues Jahrbuch für Mineralogie 185, 183-198.
Cabral Pinto, M.M.S., Silva, M.M.V.G., Neiva, A.M.R., 2009. Uranium minerals from a Portuguese
Variscan peraluminous granite, its alteration, and related uranium-quartz veins. New York: Nova
Science, Uranium: Compounds, Isotopes and Applications / ed. Gerhardt H. Wolfe. - New York; Nova
Science, 287-318.
Carvalho, P.C.S., Neiva, A.M.R., Silva, M.M.V.G., 2012. Assessment to the potential mobility and toxicity
of metals and metalloids in soils contaminated by old Sb-Au and As-Au mines (NW Portugal).
Environmental Earth Science 65, 1215-1230.
Cidu, R., Frau, F., Da Pelo, S., 2011. Drainage at abandoned mine sites: natural attenuation of contaminants
in different seasons. Mine Water and Environment 30, 113-126.
Clark, D.L., Hobart, D.E., Neu, M.P., 1995. Actinide carbonate complexes and their importance in actinide
environmental chemistry. Chemical Reviews 95, 25-48.
Cotelo Neiva, J.M., 2003. Jazigos portugueses de minérios de urânio e sua génese. In Engineering Geology
and Geological Resources. Ferreira, M.R.P.V. (Ed), Book in honour to Prof. J.M. Cotelo Neiva. Coimbra
University Press 1, 15-76.
Decreto Ministeriale, 1999. Approvazione dei metodi ufficiali di analisi chimica del suolo. SO Gazzetta
Ufficiale.
Ferreira, A., 2000. Dados geoquímicos de base de sedimentos fluviais de amostragem de baixa densidade de
Portugal continental: estudo de factores de variação regional. PhD Thesis. Univ. Aveiro,
http://hdl.handle.net/10400.9/542.
Ferreira, A., Inácio, M.M., Morgado, P., Batista, M.J., Ferreira, L., Pereira, V., Pinto, M.S., 2001.
Low-density geochemical mapping in Portugal. Applied Geochemistry 16, 1323-1331.
Food and Agriculture Organization of the United Nations (FAO), 2006. World reference base for soil
resources. 2nd edition. World Soil Resources Reports, nº 103.
Frau, F., Ardau, C., 2004. Mineralogical controls on arsenic mobility in the Baccu Locci stream catchment
(Sardinia, Italy) affected by past mining. Mineralogical Magazine 68, 15-30.
Gómez, P., Garralón, A., Buil, B., Turrero, Ma J., Sánchez, L., De la Cruz, B., 2006. Modeling of
geochemical processes related to uranium mobilization in the groundwater of a uranium mine. Science of
ACCEPTED MANUSCRIPT
Gonçalves, L.S.M., Araújo, J.R.F., Fonseca, E.C., Serrano Pinto, M.C., Ferreira Pinto, A.F., 1990. Carta
Geológica de Portugal, Folha 17-B Fornos de Algodres, Escala 1/50 000. Direcção Geral de Geologia e
Minas, Serviços Geológicos de Portugal.
Grenthe, I., Fuger, J., Konings, R.J.M., Lemire, R.J., Muller, A.B., Cregu, C.N.T., Wanner, H., 1992.
Chemical Thermodynamics of Uranium, North-Holland.
Grosbois, C., Courtin-Nomade, A., Martin, F., Bril, H., 2007. Transportation and evolution of trace elements
bearing phases in stream sediments in a mining –Influenced basin (Upper Isle River, France. Applied
Geochemistry 22, 2362-2374.
Gustafsson, J.P., 2010. Visual MINTEQ ver. 3.0. 2010. Available at http://www2.lwr.kth.se/English/
OurSoftware /vminteq /index.htm [Verified 19 January 2012].
Hudson-Edwards, K.A., Macklin, M.G., Curtis, C.D., Vaughan, D.L., 1996. Processes of formation and
distributions of Pb-, Zn-, Cd- and Cu-bearing minerals in the Tyne Basin, Northeast England;
implications for metal-contaminated river systems. Environmental Science Technology 30, 72-80.
Idiz, E.F., Carlisle, D., Kaplan, I.R., 1986. Interaction between organic matter and trace metals in an
uranium rich bog, Kern County, California, USA. Applied Geochemistry 1, 573-590.
Iwatsukí, T., Yoshida, H., 1999. Groundwater chemistry and fracture mineralogy in the basement granitic
rock in the Tono uranium mine area, Gifu Prefecture, Japan-groundwater composition, Eh evolution
analysis by fracture filling minerals. Geochemical Journal 33, 19-32.
Jambor, J.L., 1994. Mineralogy of Sulfide-rich Tailings and Their Oxidation Products. In Environmental
Geochemistry of Sulfide Mine-wastes, Mineralogical Association of Canada Short Course 22, 59-102.
Jambor, J.L., Nordstrom, D.K., Alpers, C.N., 2000. Metal-sulfate salts from sulphide mineral oxidation. In
Alpers, C.N., Jambor, J.L., Nordstrom, D.K. (Ed), Sulfate minerals: Crystallography, geochemistry, and
environmental significance. Mineralogical Society of America. Reviews in Mineralogy and
Geochemistry 40, 303-350.
James, R.O., Barrow, N.J., 1981. Copper reactions with inorganic components of soils including uptake by
oxide and silicate minerals. In Loneragan, J., Robson, A., Graham, R. (Ed), Copper in soils and plants.
Academic Press, New York 47-68.
Jerz, J.K., Rimstidt, J.D., 2003. Efflorescent iron sulfate minerals: paragenesis, relative stability, and
environmental impact. American Mineralogist 88, 1919-1932.
ACCEPTED MANUSCRIPT
Kipp, G.G., Stone, J.J., Stetler, L.D., 2009. Arsenic and uranium transport in sediments near abandoned
uranium mines in Harding County, South Dakota. Applied Geochemistry 24, 2246-2255.
Landa, E.R., 1999. Geochemical and biogeochemical controls on element mobility in and around mill
tailings. Reviews in Economic Geology 6B, 527-538.
Langmuir, D., 1997. Aqueous environmental geochemistry. Prentice Hall, Upper Saddle River.
Loomer, D.B., Al, T.A., Banks, V.J., Parker, B.L., Mayer, K.U., 2011. Manganese and trace-metal mobility
under reducing conditions following in situ oxidation of TCE by KMnO4: a laboratory column
experiment. Journal of Contaminant Hydrology 119, 13-24.
Lottermoser, B.G., Ashley, P.M., Costelloe, M.T., 2005. Contaminant dispersion at the rehabilitated Mary
Kathleen uranium mine, Australia. Environ. Geol. 48, 748-761.
Lottermoser, B.G., Ashley, P.M., 2006. Physical dispersion of radioactive mine waste at the rehabilitated
Radium Hill uranium mine site, South Australia. Australian Journal of Earth Sciences 53, 485-499.
Magalhães, M.C.F., Pedrosa de Jesus, J.D., Williams, P.A., 1985. The chemistry of uranium dispersion in
groundwaters at the Pinhal do Souto mine, Portugal. Inorganica Chimica Acta 109, 71-78.
Mirsal, I.A., 2004. Soil Pollution. Origin, Monitoring & Remediation. Springer, Berlin, 312 pp.
Mulligan, C.N., Yong, R.N., Gibbs, B.F., 2001. Remediation technologies for metal-contaminated soils and
groundwater: an evaluation. Engineering Geology 60, 193-207.
Nelson, D.W., Sommers, L.E., 1996. Total carbon, organic carbon, and organic matter. In: Methods of Soils
Analysis, Part 2, 2nd ed., A.L. Page et al., Ed. Agronomy 9, 961-1010. American Society of Agronomy, Inc. Madison, WI.
Noller, B.N., Watters, R.A., Woods, P.H., 1997. The role of biogeochemical processes in minimising
uranium dispersion from a mine site. Journal of Geochemical Exploration 58, 37-50.
Petrunic, B.M., MacQuarrie, K.T., Al, T.A., 2005. Reductive dissolution of Mn oxides in river-recharged
aquifers: a laboratory column study. Journal of Hydrology 301, 163-181.
Pinto, M.M.S.C., Silva, M.M.V.G., Neiva, A.M.R., 2004. Pollution of water and stream sediments
associated with the Vale de Abrutiga uranium mine, central Portugal. Mine Water and the Environment
23, 66-75.
Porcelli, D., Anderson, P.S., Wasserburg, G.J., Ingri, J., Baskaran, M., 1997. The importance of colloids and
mires for the transport of uranium isotopes through the Kalix River watershed and Baltic Sea.
ACCEPTED MANUSCRIPT
Portuguese Decree, 1998. Portuguese Legislation on Water Quality. Diário da República I-A, Lisbon,
3676-3722.
Portuguese Decree, 2007. Portuguese Legislation on Water Quality. Diário da República I-A, Lisbon,
5747-5765.
Reimann, C., Garrett, R.G., 2005. Geochemical background – concept and reality. Science of the Total
Environment 350, 12-27.
Root, R.A., Dixit, S., Campbell, K.W., Jew, A.D., Hering, J.G., O’Day, P.A., 2007. Arsenic sequestration by
sorption processes in high-iron sediments. Geochimica et Cosmochimica Acta 71, 5782-5803.
Saito, H., Goovaerts, P., 2000. Geostatistical interpolation of positively skewed and censored data in a
dioxin contaminated site. Environmental Science & Technology 34, 4228-4235.
Salminen, R., Batista, M.J., Bidovec, M., Demetriades, A., De Vivo, B., De Vos, W., Duris, M., Gilucis, A.,
Gregorauskiene, V., Halamic, J., Heitzmann, P., Lima, A., Jordan, G., Klaver, G., Klein, P., Lis, J.,
Locutura, J., Marsina, K., Mazreku, A., O'Connor, P.J., Olsson, S.A., Ottesen, R.-T., Petersell, V., Plant,
J.A., Reeder, S., Salpeteteur, I., Sandstrom, H., Siewers, U., Steenfelt, A., Tarvainen, T. 2005. FOREGS
Geochemical Atlas of Europe. Methodology and Maps. Part 1 (526 pp) and Part 2 (690 pp).
Schaller, J., Weiske, A., Dudel, E.G., 2011. Effects of gamma-sterilization on DOC, uranium and arsenic
remobilization from organic and microbial rich stream sediments. Science of the Total Environment 409,
3211-3214.
Siegel, F.R., 2002. Environmental Geochemistry of potentailly toxic metals. Springer, Berlin Heildelberg
New York, 212 pp.
Silva, M.M.V.G., Neiva, A.M.R., 2000. Geochemistry of Hercynian peraluminous granites and their
minerals from Carregal do Sal-Nelas-Lagares da Beira area, central Portugal. Chemie der Erde 59,
329-349.
SNIRH, 2012. Sistema Nacional de Informação de Recursos Hídricos.
Stefaniak, E.A., Worobiec, A., Potgieter-Vermaak, S., Alsecz, A., Török, S., Van Grieken, R., 2009.
Combined SEM/EDX and micro-Raman spectroscopy analysis of uranium minerals from a former
uranium mine. Journal of Hazardous Materials 68, 416-423.
Sutherland, R.A., 2000. Bed sediment-associated trace metals in an urban stream, Oahu, Hawai.
ACCEPTED MANUSCRIPT
Thomas, G.W., 1982. Exchangeable cations. In Page, A.L. (Ed), Methods of soil analysis, Part 2, Second
Edition, Agronomy Monograph 9, American Society of Agronomy, Madison, WI.
ACCEPTED MANUSCRIPT
Figure Captions
Fig. 1. Geological area containing the Pinhal do Souto uranium mine and the sample collection sites. a.
Location of the Tragos area on the map of Portugal; b. Geological map of this area with the Ludares stream
and its effluents and the area of detailed study; c.d. Simplified map showing the two mine dumps and
location of water and stream sediment samples in c and soil samples in d., where the area used in the maps
of soil anomalies (Fig. 4) is shown.
Fig. 2. Seasonal chemical variations in waters from the Pinhal do Souto uranium mine area. a) As, b) Pb, c)
Th, d) Na, e) SO24, f) U. VMR - recommended values for agriculture; VMA - permitted values for agriculture; VP - permitted values for human consumption (Portuguese Decrees, 1998, 2007), except for U
(WHO, 2010).
Fig. 3. Variation in concentrations of metals and a metalloid in stream sediments from the Pinhal do Souto
uranium mine area.
Fig. 4. Location of soil samples and geochemical distribution of seven metals and one metalloid in the
Pinhal do Souto uranium mine area.
Classes defined for Cr (0-3, 3-7, 7-12, >12 mg/kg); Th (0-23, 23-35, 35-47, >47 mg/kg); U (0-46, 46-106,
106-167, >167 mg/kg); Zn (3-112, 112-185, 185-258, >258 mg/kg); Sb (0-27, 27-63, 63-99, >99 mg/kg);
Pb (0-98, 98-251, 251-404, >404 mg/kg); Sr (0-13, 13-27, 27-41, >41 mg/kg); W (0-21, 21-39, 39-56, >56
mg/kg).
Fig. 5. Selected concentrations of some metals and metalloids of soils from the Pinhal do Souto uranium
mine area. Maximum levels for — public, private green areas and residential sites; - - - industrial areas
ACCEPTED MANUSCRIPT
ACCEPTED MANUSCRIPT
ACCEPTED MANUSCRIPT
ACCEPTED MANUSCRIPT
ACCEPTED MANUSCRIPT
ACCEPTED MANUSCRIPT
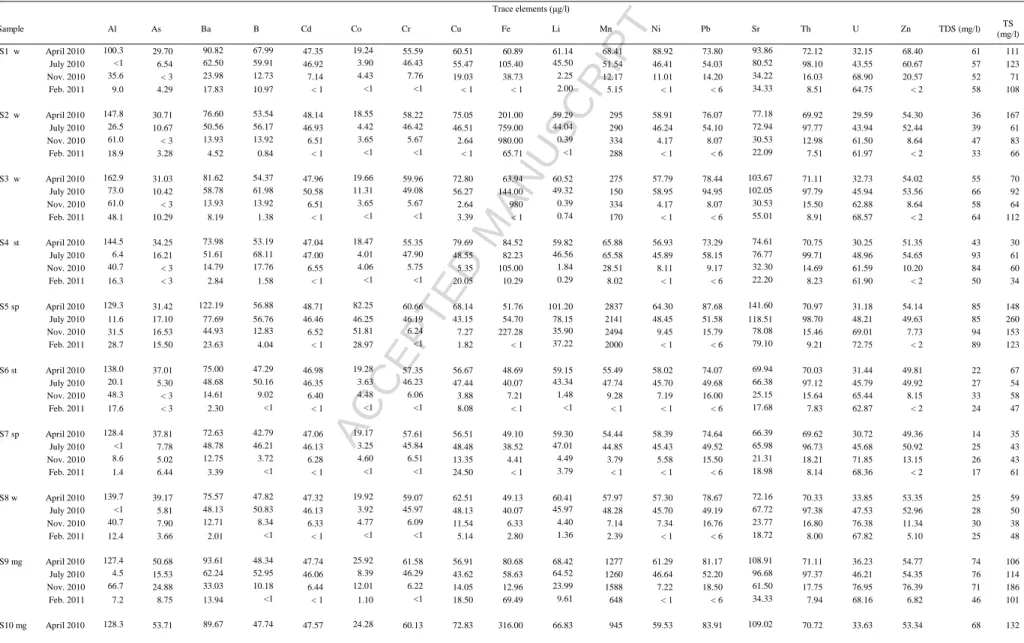
Sample T (ºC) pH Eh (mV) DO (mg/l) EC (μS/cm) HCO3- SO42- PO42- NO3- NO2- Cl- F- Na K Ca Mg PS1 w April 2010 13.9 5.12 333 7.29 96 9.31 4.91 0.09 17.04 0.38 14.51 0.09 7.05 4.03 3.90 3.01 July 2010 15.6 6.03 51 5.65 94 10.80 6.66 0.09 14.88 0.76 14.61 0.04 8.14 3.85 3.28 3.46 Nov. 2010 12.5 5.77 -134 3.75 80 10.20 5.85 0.21 10.88 0.65 12.25 0.06 7.88 3.09 3.59 1.95 Feb. 2011 12.0 7.54 177 7.10 87 9.15 10.70 0.18 16.03 0.61 12.87 0.08 7.90 3.66 3.72 1.34 PS2 w April 2010 11.0 6.23 59 1.92 53 14.45 1.01 < 0.006 0.10 0.86 11.78 0.13 5.88 1.55 2.07 2.00 July 2010 14.4 6.52 -235 0.91 62 21.60 1.57 0.19 < 0.004 1.20 11.61 0.03 6.45 2.35 2.26 1.86 Nov. 2010 8.3 6.47 -47 0 64 21.01 1.77 0.18 0.08 1.09 14.77 0.02 7.90 3.23 2.84 1.03 Feb. 2011 6.3 8.11 -93 0 43 14.56 2.59 < 0.006 < 0.004 0.94 9.72 0.02 6.12 1.96 1.75 < 0.001 PS3 w April 2010 12.1 7.96 91 2.93 83 17.82 7.04 < 0.006 4.33 0.83 10.95 0.11 5.40 1.47 7.04 3.16 July 2010 17.6 6.87 -5 5.24 113 47.52 13.05 0.16 0.05 1.75 10.25 0.18 6.03 1.75 22.63 9.81 Nov. 2010 12.8 5.87 -7 1.96 89 20.40 12.15 < 0.006 3.60 1.01 10.29 0.06 7.90 3.23 2.84 1.03 Feb. 2011 9.0 8.07 133 2.01 89 24.96 14.99 0.21 10.19 1.14 11.12 0.10 5.80 1.94 11.5 2.61 PS4 st April 2010 12.1 8.10 68 7.74 46 1.19 2.04 < 0.006 2.20 0.37 7.42 0.13 4.64 1.58 2.36 2.01 July 2010 15.0 6.31 124 5.82 99 20.74 6.73 0.37 10.15 0.94 15.28 0.10 9.36 3.37 4.29 4.47 Nov. 2010 10.2 6.53 -19 5.29 87 18.97 6.33 0.20 6.62 0.72 15.26 0.26 8.99 3.02 5.09 1.75 Feb. 2011 10.1 8.11 134 9.59 49 12.06 5.19 0.06 3.82 0.52 8.35 0.12 5.14 2.22 2.82 < 0.001 PS5 sp April 2010 13.7 7.14 56 3.17 134 101.38 2.37 < 0.006 0.18 8.62 9.10 0.30 8.11 2.62 11.52 5.57 July 2010 14.2 7.55 -69 5.52 136 117.50 < 0.004 < 0.006 < 0.004 8.38 9.36 0.37 9.21 2.97 12.39 21.11 Nov. 2010 14.3 7.17 -142 5.56 149 108.53 < 0.004 < 0.006 < 0.004 8.31 8.23 0.32 9.55 2.77 13.22 7.30 Feb. 2011 13.7 8.30 52 6.19 141 100.26 3.54 < 0.006 < 0.004 6.65 8.42 0.28 9.33 2.93 13.27 7.47 PS6 st April 2010 12.1 6.73 77 7.81 33 5.74 1.32 < 0.006 3.20 0.21 6.67 0.07 4.03 1.32 0.87 1.81 July 2010 13.2 5.11 193 6.47 42 5.18 2.34 < 0.006 4.85 0.43 8.47 0.06 4.63 1.89 1.11 1.24 Nov. 2010 11.4 5.86 12 6.96 49 5.10 2.44 < 0.006 8.05 0.40 9.43 0.06 5.89 2.06 1.80 0.90 Feb. 2011 10.0 8.06 155 9.76 35 6.66 3.00 < 0.006 3.59 0.33 6.20 0.04 4.21 1.98 1.06 < 0.001 PS7 sp April 2010 12.0 6.46 120 8.21 22 7.92 0.33 0.10 1.81 0.33 4.76 0.06 3.54 1.03 0.40 1.65 July 2010 15.1 6.14 47 6.36 41 13.18 0.72 0.21 1.56 1.09 6.73 0.07 4.49 1.90 1.76 0.98 Nov. 2010 14.1 5.30 72 7.25 41 14.08 0.34 0.20 1.73 1.17 6.18 0.06 4.84 1.81 1.88 0.49 Feb. 2011 12.2 7.82 136 7.48 26 14.77 1.01 0.20 1.96 0.94 6.14 0.06 4.57 1.94 2.19 < 0.001 PS8 w April 2010 11.5 6.35 64 5.78 38 6.14 3.31 0.06 2.85 0.25 9.81 0.08 4.52 1.20 0.80 1.88 July 2010 13.5 6.03 36 6.80 44 5.40 5.23 0.12 3.96 0.52 7.05 0.06 5.12 1.85 1.03 1.42 Nov. 2010 13.2 5.74 89 5.67 47 7.96 3.62 0.16 3.88 0.85 6.48 0.06 5.54 1.73 1.39 0.73 Feb. 2011 11.1 7.46 238 7.37 37 4.58 6.20 0.09 2.45 0.48 5.86 0.06 4.62 1.82 0.84 < 0.001 PS9 mg April 2010 14.9 6.57 35 5.02 120 70.29 0.30 < 0.006 0.17 1.82 9.26 0.20 6.37 2.19 7.01 4.09 July 2010 17.2 6.50 -33 1.76 129 86.40 0.17 < 0.006 < 0.004 3.32 9.75 0.30 7.78 2.79 8.46 12.52 Nov. 2010 12.0 6.40 10 0.22 107 57.12 < 0.004 < 0.006 < 0.004 8.41 8.77 0.24 8.58 2.75 10.48 5.49 Feb. 2011 10.8 6.84 90 3.41 67 40.56 1.47 < 0.006 0.27 1.52 7.09 0.12 5.57 2.37 5.21 1.59 PS10 mg April 2010 14.4 6.89 -30 3.50 109 60.39 0.16 < 0.006 < 0.004 2.09 9.38 0.21 6.44 2.15 7.33 4.15 July 2010 19.7 7.70 -278 0.35 235 109.08 < 0.004 < 0.006 < 0.004 8.12 10.82 0.31 8.75 2.69 11.30 20.43 Nov. 2010 9.5 6.95 -158 0.01 129 110.77 < 0.004 < 0.006 < 0.004 7.39 9.31 0.21 8.48 2.59 10.44 6.22 Feb. 2011 9.2 8.48 11 0.72 84 57.20 0.63 < 0.006 0.07 2.31 8.01 0.06 6.58 2.44 6.91 3.37 PS11 st April 2010 13.3 6.76 88 7.71 45 12.67 2.30 < 0.006 2.38 0.29 8.01 0.14 4.77 2.39 2.53 < 0.001 July 2010 15.3 6.24 135 6.08 100 21.17 6.98 0.32 11.06 0.96 16.08 0.13 9.48 3.37 4.57 5.10 Nov. 2010 10.0 6.85 43 5.72 86 17.75 3.31 0.11 4.60 0.55 11.10 0.11 9.15 2.94 5.26 1.78 Feb. 2011 10.0 8.09 86 9.90 49 12.69 5.11 0.06 3.79 0.53 8.21 0.10 5.27 2.19 2.85 < 0.001 VMR nd 575 nd 50 nd 70 1 nd nd nd nd VMA nd nd nd nd nd nd 15 nd nd nd nd VP nd 250 nd 50 0.5 250 1.5 200 nd nd ndACCEPTED MANUSCRIPT
Table 1- Physico–chemical and chemical results of waters from the Pinhal do Souto uranium mine area
T - temperature; Eh - relative to field pH electrode; DO - dissolved oxygen; EC - electrical conductivity. w- well; st- stream; sp - spring; mg - mine gallery; Nov.- November; Feb.- February; VMR - recommended value for agriculture use; VMA - permitted values for agriculture; VP - permitted values for human consumption (Portuguese Decrees 1998; 2007), except for U (WHO, 2010); TDS - total dissolved solids, TS - Total solids; nd - not defined. Analyst: A.C.T. Santos.
ACCEPTED MANUSCRIPT
Table 1 (cont.) - Physico–chemical and chemical results of waters from the Pinhal do Souto uranium mine area
Trace elements (μg/l) Sample Al As Ba B Cd Co Cr Cu Fe Li Mn Ni Pb Sr Th U Zn TDS (mg/l) TS (mg/l) PS1 w April 2010 100.3 29.70 90.82 67.99 47.35 19.24 55.59 60.51 60.89 61.14 68.41 88.92 73.80 93.86 72.12 32.15 68.40 61 111 July 2010 <1 6.54 62.50 59.91 46.92 3.90 46.43 55.47 105.40 45.50 51.54 46.41 54.03 80.52 98.10 43.55 60.67 57 123 Nov. 2010 35.6 < 3 23.98 12.73 7.14 4.43 7.76 19.03 38.73 2.25 12.17 11.01 14.20 34.22 16.03 68.90 20.57 52 71 Feb. 2011 9.0 4.29 17.83 10.97 < 1 <1 <1 < 1 < 1 2.00 5.15 < 1 < 6 34.33 8.51 64.75 < 2 58 108 PS2 w April 2010 147.8 30.71 76.60 53.54 48.14 18.55 58.22 75.05 201.00 59.29 295 58.91 76.07 77.18 69.92 29.59 54.30 36 167 July 2010 26.5 10.67 50.56 56.17 46.93 4.42 46.42 46.51 759.00 44.04 290 46.24 54.10 72.94 97.77 43.94 52.44 39 61 Nov. 2010 61.0 < 3 13.93 13.92 6.51 3.65 5.67 2.64 980.00 0.39 334 4.17 8.07 30.53 12.98 61.50 8.64 47 83 Feb. 2011 18.9 3.28 4.52 0.84 < 1 <1 <1 < 1 65.71 <1 288 < 1 < 6 22.09 7.51 61.97 < 2 33 66 PS3 w April 2010 162.9 31.03 81.62 54.37 47.96 19.66 59.96 72.80 63.94 60.52 275 57.79 78.44 103.67 71.11 32.73 54.02 55 70 July 2010 73.0 10.42 58.78 61.98 50.58 11.31 49.08 56.27 144.00 49.32 150 58.95 94.95 102.05 97.79 45.94 53.56 66 92 Nov. 2010 61.0 < 3 13.93 13.92 6.51 3.65 5.67 2.64 980 0.39 334 4.17 8.07 30.53 15.50 62.88 8.64 58 64 Feb. 2011 48.1 10.29 8.19 1.38 < 1 <1 <1 3.39 < 1 0.74 170 < 1 < 6 55.01 8.91 68.57 < 2 64 112 PS4 st April 2010 144.5 34.25 73.98 53.19 47.04 18.47 55.35 79.69 84.52 59.82 65.88 56.93 73.29 74.61 70.75 30.25 51.35 43 30 July 2010 6.4 16.21 51.61 68.11 47.00 4.01 47.90 48.55 82.23 46.56 65.58 45.89 58.15 76.77 99.71 48.96 54.65 93 61 Nov. 2010 40.7 < 3 14.79 17.76 6.55 4.06 5.75 5.35 105.00 1.84 28.51 8.11 9.17 32.30 14.69 61.59 10.20 84 60 Feb. 2011 16.3 < 3 2.84 1.58 < 1 <1 <1 20.05 10.29 0.29 8.02 < 1 < 6 22.20 8.23 61.90 < 2 50 34 PS5 sp April 2010 129.3 31.42 122.19 56.88 48.71 82.25 60.66 68.14 51.76 101.20 2837 64.30 87.68 141.60 70.97 31.18 54.14 85 148 July 2010 11.6 17.10 77.69 56.76 46.46 46.25 46.19 43.15 54.70 78.15 2141 48.45 51.58 118.51 98.70 48.21 49.63 85 260 Nov. 2010 31.5 16.53 44.93 12.83 6.52 51.81 6.24 7.27 227.28 35.90 2494 9.45 15.79 78.08 15.46 69.01 7.73 94 153 Feb. 2011 28.7 15.50 23.63 4.04 < 1 28.97 <1 1.82 < 1 37.22 2000 < 1 < 6 79.10 9.21 72.75 < 2 89 123 PS6 st April 2010 138.0 37.01 75.00 47.29 46.98 19.28 57.35 56.67 48.69 59.15 55.49 58.02 74.07 69.94 70.03 31.44 49.81 22 67 July 2010 20.1 5.30 48.68 50.16 46.35 3.63 46.23 47.44 40.07 43.34 47.74 45.70 49.68 66.38 97.12 45.79 49.92 27 54 Nov. 2010 48.3 < 3 14.61 9.02 6.40 4.48 6.06 3.88 7.21 1.48 9.28 7.19 16.00 25.15 15.64 65.44 8.15 33 58 Feb. 2011 17.6 < 3 2.30 <1 < 1 <1 <1 8.08 < 1 <1 < 1 < 1 < 6 17.68 7.83 62.87 < 2 24 47 PS7 sp April 2010 128.4 37.81 72.63 42.79 47.06 19.17 57.61 56.51 49.10 59.30 54.44 58.39 74.64 66.39 69.62 30.72 49.36 14 35 July 2010 <1 7.78 48.78 46.21 46.13 3.25 45.84 48.48 38.52 47.01 44.85 45.43 49.52 65.98 96.73 45.68 50.92 25 43 Nov. 2010 8.6 5.02 12.75 3.72 6.28 4.60 6.51 13.35 4.41 4.49 3.79 5.58 15.50 21.31 18.21 71.85 13.15 26 43 Feb. 2011 1.4 6.44 3.39 <1 < 1 <1 <1 24.50 < 1 3.79 < 1 < 1 < 6 18.98 8.14 68.36 < 2 17 61 PS8 w April 2010 139.7 39.17 75.57 47.82 47.32 19.92 59.07 62.51 49.13 60.41 57.97 57.30 78.67 72.16 70.33 33.85 53.35 25 59 July 2010 <1 5.81 48.13 50.83 46.13 3.92 45.97 48.13 40.07 45.97 48.28 45.70 49.19 67.72 97.38 47.53 52.96 28 50 Nov. 2010 40.7 7.90 12.71 8.34 6.33 4.77 6.09 11.54 6.33 4.40 7.14 7.34 16.76 23.77 16.80 76.38 11.34 30 38 Feb. 2011 12.4 3.66 2.01 <1 < 1 <1 <1 5.14 2.80 1.36 2.39 < 1 < 6 18.72 8.00 67.82 5.10 25 48 PS9 mg April 2010 127.4 50.68 93.61 48.34 47.74 25.92 61.58 56.91 80.68 68.42 1277 61.29 81.17 108.91 71.11 36.23 54.77 74 106 July 2010 4.5 15.53 62.24 52.95 46.06 8.39 46.29 43.62 58.63 64.52 1260 46.64 52.20 96.68 97.37 46.21 54.35 76 114 Nov. 2010 66.7 24.88 33.03 10.18 6.44 12.01 6.22 14.05 12.96 23.99 1588 7.22 18.50 61.50 17.75 76.95 76.39 71 186 Feb. 2011 7.2 8.75 13.94 <1 < 1 1.10 <1 18.50 69.49 9.61 648 < 1 < 6 34.33 7.94 68.16 6.82 46 101 PS10 mg April 2010 128.3 53.71 89.67 47.74 47.57 24.28 60.13 72.83 316.00 66.83 945 59.53 83.91 109.02 70.72 33.63 53.34 68 132