OSD
11, 2791–2829, 2014A robust method for removal of glint effects from satellite ocean colour imagery
R. K. Singh and P. Shanmugam
Title Page
Abstract Introduction
Conclusions References
Tables Figures
◭ ◮
◭ ◮
Back Close
Full Screen / Esc
Printer-friendly Version Interactive Discussion
Discussion
P
a
per
|
Discussion
P
a
per
|
Discussion
P
a
per
|
Discussion
P
a
per
|
Ocean Sci. Discuss., 11, 2791–2829, 2014 www.ocean-sci-discuss.net/11/2791/2014/ doi:10.5194/osd-11-2791-2014
© Author(s) 2014. CC Attribution 3.0 License.
This discussion paper is/has been under review for the journal Ocean Science (OS). Please refer to the corresponding final paper in OS if available.
A robust method for removal of glint
e
ff
ects from satellite ocean colour
imagery
R. K. Singh and P. Shanmugam
Ocean Optics and Imaging Laboratory, Department of Ocean Engineering, Indian Institute of Technology Madras, Chennai – 600036, India
Received: 15 October 2014 – Accepted: 17 November 2014 – Published: 8 December 2014 Correspondence to: P. Shanmugam ([email protected])
Published by Copernicus Publications on behalf of the European Geosciences Union.
OSD
11, 2791–2829, 2014A robust method for removal of glint effects from satellite ocean colour imagery
R. K. Singh and P. Shanmugam
Title Page
Abstract Introduction
Conclusions References
Tables Figures
◭ ◮
◭ ◮
Back Close
Full Screen / Esc
Printer-friendly Version Interactive Discussion
Discussion
P
a
per
|
Discussion
P
a
per
|
Discussion
P
a
per
|
Discussion
P
a
per
|
Abstract
Removal of the glint effects from satellite imagery for accurate retrieval of water-leaving radiances is a complicated problem since its contribution in the measured signal is dependent on many factors such as viewing geometry, sun elevation and azimuth, illumination conditions, wind speed and direction, and the water refractive index. To
5
simplify the situation, existing glint correction models describe the extent of the glint-contaminated region and its contribution to the radiance essentially as a function of the wind speed and sea surface slope that often lead to a tremendous loss of information with a considerable scientific and financial impact. Even with the glint-tilting capability of modern sensors, glint contamination is severe on the satellite-derived ocean colour
10
products in the equatorial and sub-tropical regions. To rescue a significant portion of data presently discarded as “glint contaminated” and improving the accuracy of water-leaving radiances in the glint contaminated regions, we developed a glint correction al-gorithm which is dependent only on the satellite derived Rayleigh Corrected Radiance and absorption by clear waters. The new algorithm is capable of achieving
meaning-15
ful retrievals of ocean radiances from the glint-contaminated pixels unless saturated by strong glint in any of the wavebands. It takes into consideration the combination of the background absorption of radiance by water and the spectral glint function, to accurately minimize the glint contamination effects and produce robust ocean colour products. The new algorithm is implemented along with an aerosol correction method
20
and its performance is demonstrated for many MODIS-Aqua images over the Arabian Sea, one of the regions that are heavily affected by sunglint due to their geographical location. The results with and without sunglint correction are compared indicating ma-jor improvements in the derived products with sunglint correction. When compared to the results of an existing model in the SeaDAS processing system, the new algorithm
25
OSD
11, 2791–2829, 2014A robust method for removal of glint effects from satellite ocean colour imagery
R. K. Singh and P. Shanmugam
Title Page
Abstract Introduction
Conclusions References
Tables Figures
◭ ◮
◭ ◮
Back Close
Full Screen / Esc
Printer-friendly Version Interactive Discussion
Discussion
P
a
per
|
Discussion
P
a
per
|
Discussion
P
a
per
|
Discussion
P
a
per
|
above results. Unlike the standard models, the new algorithm performs well in variable illumination and wind conditions and does not require any auxiliary data besides the Rayleigh-corrected radiance itself. Exploitation of signals observed by sensors looking within regions affected by bright white sunglint is possible with the present algorithm when the requirement of a stable response over a wide dynamical range for these
5
sensors is fulfilled.
1 Introduction
Ocean colour remote sensing data provided by the NASA’s Sea-viewing Wide Field-of-view Sensor (SeaWiFS, on board the SeaStar satellite) and Moderate-resolution Imaging Spectroradiometer (MODIS, on board the Terra and Aqua satellites), ESA’s
10
MEdium Resolution Imaging Spectrometer (MERIS, on board the Envisat satellite), and ISRO’s Ocean Colour Monitor (OCM-1 and OCM-2, on board the IRS-P4 and Oceansat-2 satellites respectively) are a vital resource for operational forecasting and oceanographic research, and related applications in the global oceans. With the ad-vent of these sensors, the prospects of better algorithms to enable the interpretation
15
of ocean colour in Case 2 waters have particularly improved. A few examples of some of the ways that ocean colour data have been used in various studies include monitor-ing the spatial and temporal variability of algal blooms (instrumental in characterizmonitor-ing variability of marine ecosystems and is key tool to investigate how marine ecosys-tems respond to climate change and anthropogenic perturbations), monitoring coastal
20
marine pollution and river plumes, understanding global carbon budgets and climate change impacts (Shanmugam et al., 2013; Shanmugam, 2011). The largest sources of error for retrieval of ocean radiances in Case 2 waters (optically complex) are often attributed to the treatment of aerosol and sunglint radiances in the atmospheric correc-tion procedure (Shanmugam, 2012; Rakesh Kumar and Shanmugam, 2014; Wang and
25
Bailey, 2001). Since simultaneous in-situ measurements of atmospheric optical proper-ties are not available in the most of the cases, atmospheric correction of ocean colour
OSD
11, 2791–2829, 2014A robust method for removal of glint effects from satellite ocean colour imagery
R. K. Singh and P. Shanmugam
Title Page
Abstract Introduction
Conclusions References
Tables Figures
◭ ◮
◭ ◮
Back Close
Full Screen / Esc
Printer-friendly Version Interactive Discussion
Discussion
P
a
per
|
Discussion
P
a
per
|
Discussion
P
a
per
|
Discussion
P
a
per
|
imagery usually relies on the satellite-derived data alone (Ruddick et al., 2000). The former problem has been successfully addressed in a recent study (Rakesh Kumar and Shanmugam, 2014) which uses the Rayleigh corrected radiance to estimate and extrapolate the aerosol radiance rather than using the aerosol models and relative hu-midity (Gordon and Wang, 1994). The problem of sunglint is particularly acute under
5
a wind-roughened sea surface condition and one of the greatest confounding factors limiting the quality and accuracy of satellite data (Kay et al., 2009; Zhang and Wang, 2010). This often results in the periodic black portions on swaths found in images of the ocean colour products of these regions (Ottaviani et al., 2008).
Sunglint is a phenomenon caused by the specular reflection of the incident light from
10
the sun to the sensor. The region affected by sunglint may vary from a single disk (image of sun), on a perfectly flat and clam surface, to a distinctive widespread spatial pattern (due to reflection into a wide range of angles) on the wind-roughened sea surface due to the reflection by a large number of wave facets (Zhang and Wang, 2010). This region often extends to several hundred kilometers, with associated reflectance
15
factor greater than 0.2 (Hagolle et al., 2004). The effect of sunglint is highest at the sub-solar point due to the decrease in angle between the sun and sensor (Wang and Bailey, 2001). The sunglint pattern varies with respect to the wind speed and direction, sensor geometry and illumination conditions. The viewing geometry, relative orientation of the sensor’s viewing angle, solar zenith angle, and the slope of the water surface
20
along with the sea surface roughness governed by the wind speed and wind direction, play a significant role in determination of sunglint (Cox and Munk, 1954).
Most ocean colour sensors are designed to capture the radiances over a given dy-namic range (minimal threshold corresponding to the saturation limit) in a given band. The minimal threshold defines the lowest intensity of radiances to be detected by the
25
OSD
11, 2791–2829, 2014A robust method for removal of glint effects from satellite ocean colour imagery
R. K. Singh and P. Shanmugam
Title Page
Abstract Introduction
Conclusions References
Tables Figures
◭ ◮
◭ ◮
Back Close
Full Screen / Esc
Printer-friendly Version Interactive Discussion
Discussion
P
a
per
|
Discussion
P
a
per
|
Discussion
P
a
per
|
Discussion
P
a
per
|
Bailey, 2001). The change in the viewing angle reduces the number of facets of water formed by a rough sea reflecting the incident solar radiation in a specular manner into the sensor’s field of view. For sensors without such a capability (glint-tilting) such as MODIS, glint contamination can be so severe that satellite retrieval of ocean colour products may yield unacceptably large uncertainties (Zhang and Wang, 2010).
5
The extent of the glint-contaminated region and its contribution to the radiance is generally computed from the Cox and Munk model (Cox and Munk, 1954) with the input of the sea-surface wind speed. Several recent studies have improved this model based on redefined sea surface statistical parameters. For instance, Shifrin utilized the Richardson number to link the stability of the atmosphere–water interface to the sea
10
surface roughness (Shifrin, 2001). Ebuchi and Kizu re-estimated the slope statistics with a more general data set from a radiometer onboard Geostationary Meteorological Satellite (GMS) and ancillary data from space-borne scatterometers, which resulted in a narrower distribution for the glint which was similar to the Cox and Munk model (Ebuchi and Kizu, 2002). Bréon and Henriot used the Polarization and Directionality
15
of Earth’s Reflectance (POLDER) (Deschamps et al., 1994) with NASA scatterometer for wind speed and direction to quantify glint contamination by redefining the slope statistics (Bréon and Henriot, 2006). It should be noted that these methods utilized certain ancillary data, which are difficult to obtain in real time. Doerffer et al. used a Neural Network (NN) to estimate glint radiance from the radiative transfer calculations
20
(Doerffer et al., 2008). The efficiency of this algorithm depends on the training of the NN and there is a chance of producing irrelevant glint radiance due to the synthetic output from the radiative transfer equations. Steinmetz et al. used a spectral matching approach for modelling atmosphere and sunglint using all available spectral bands and matching with the spectrum to be corrected (Steinmetz et al., 2011). Another approach
25
was proposed by Shanmugam (2012) which empirically related the glint radiance to the Rayleigh corrected radiance. Recently, Kutser et al. (2013) attempted to correct glint contamination by fitting a power function on the measured (in-situ) reflectance values from the blue and NIR (near infrared) region. Many of the models developed for
OSD
11, 2791–2829, 2014A robust method for removal of glint effects from satellite ocean colour imagery
R. K. Singh and P. Shanmugam
Title Page
Abstract Introduction
Conclusions References
Tables Figures
◭ ◮
◭ ◮
Back Close
Full Screen / Esc
Printer-friendly Version Interactive Discussion
Discussion
P
a
per
|
Discussion
P
a
per
|
Discussion
P
a
per
|
Discussion
P
a
per
|
satellite applications have been reviewed and evaluated for correction of the sunglint contamination effects in satellite ocean colour data (Kay et al., 2009; Zhang and Wang, 2010).
A model for sunglint correction presently used in the SeaDAS processing system was proposed by Wang and Bailey (Wang and Bailey, 2001), which is based on the glint
5
radiance computation from Cox and Munk (1954) with inputs from the solar and viewing geometries, sea-surface wind speed and direction, and the estimated aerosol optical thickness. This method determines the normalized glint radiance LGN depending on the above parameters, for vacuum and solar irradiance,F0(λ)=1.0. The glint correction procedure is applied on the pixels withLGNvalues ranging between 0.0≤LGN≤0.005
10
(Wang and Bailey, 2001). Such a criterion leads to the removal of a significant number of pixels restricting a large area of swath from ocean colour research.
The major drawback of these models for sunglint correction is the absence of an-cillary information such as wind speed, wind direction, sea surface slope and other parameters. The objective of this paper is to develop an alternative robust sunglint
cor-15
rection algorithm that is entirely dependent on the satellite-derived products alone. The new algorithm (hereafter referred to as “New Glint Correction – NGC” algorithm) takes into account the absorption by clear water as the ancillary data which is almost constant for a wide variety of waters. The performance of NGC algorithm is tested for several MODIS-Aqua images of the Arabian Sea and its results are compared with those of
20
the default model available in the SeaDAS processing system (called as SeaDAS Glint Correction (SGC) algorithm for brevity). The applicability of NGC algorithm over the global oceans is further discussed.
2 New glint correction (NGC) algorithm
Satellite ocean colour sensors measure the spectrum of sunlight reflected from the
25
con-OSD
11, 2791–2829, 2014A robust method for removal of glint effects from satellite ocean colour imagery
R. K. Singh and P. Shanmugam
Title Page
Abstract Introduction
Conclusions References
Tables Figures
◭ ◮
◭ ◮
Back Close
Full Screen / Esc
Printer-friendly Version Interactive Discussion
Discussion
P
a
per
|
Discussion
P
a
per
|
Discussion
P
a
per
|
Discussion
P
a
per
|
tributed by the atmosphere through the process of scattering by molecules and par-ticles (aerosols) and the remaining signal is the desired water-leaving radiance (Lw(λ)) (Gordon, 1997; Shanmugam and Ahn, 2007). The water-leaving radiance carries im-mense information concerning water constituents, but its retrieval is more complicated by the atmospheric and surface reflected contributions. The basic form of equation to
5
represent these contributions is given below,
Lt(λ)=Lr(λ)+La(λ)+Lra(λ)+T Lg(λ)+tLwc(λ)+tLw(λ) (1) whereLr is the Rayleigh radiance, La is the aerosol radiance andLrais the radiance due to the combined effect of Rayleigh and aerosols, which define the path signal be-tween the surface and satellite sensor. Other contributions are the glint radiance (Lg)
10
and whitecap radiance (Lwc) that are added up to the water signal due to specular re-flection from the sea surface and breaking of waves respectively. These radiances with the directT(λ) and diffused t(λ) transmittance components constitute to the total radi-ance (Lt) signal recorded by the satellite sensor. In the above equation, the Rayleigh radiance in the visible and NIR wavelengths can be easily computed with good
accu-15
racy without use of the remotely sensed data as it depends mainly on the molecular composition of the atmosphere (Deschamps et al., 1983; Wang, 2005). However, esti-mation and extrapolation of the aerosol radiance is a complex problem, but has been addressed in a recent study by Rakesh Kumar and Shanmugam (2014). The whitecaps radiance part is ignored for brevity. The remaining part is the sunglint radiance which
20
often deteriorates the quality of ocean colour products, thus constituting the main focus of the present work.
The default model used in the SeaDAS processing system computes the sunglint ra-diance as a function of the sea-surface wind speed, wind direction and solar and sensor geometries. The SeaDAS model is built on the Cox and Munk model which ignores the
25
sky radiance, which raises the question of the validity of the Cox and Munk distribution for the global oceans and for all weather conditions (Shifrin, 2001). Further the sunglint correction is limited to the region at the edge of the sunglint, where the contribution of
OSD
11, 2791–2829, 2014A robust method for removal of glint effects from satellite ocean colour imagery
R. K. Singh and P. Shanmugam
Title Page
Abstract Introduction
Conclusions References
Tables Figures
◭ ◮
◭ ◮
Back Close
Full Screen / Esc
Printer-friendly Version Interactive Discussion
Discussion
P
a
per
|
Discussion
P
a
per
|
Discussion
P
a
per
|
Discussion
P
a
per
|
sunglint is below a predetermined threshold, and beyond this threshold it deteriorates the quality of the ocean colour products or simply creates the flag in areas with strong sunglint effects. The sunglint contamination is particularly evident in both atmospheric and ocean products (e.g., the aerosol optical thickness and water-leaving radiances) (Wang and Bailey, 2001). Since most of the ancillary information needed for sunglint
5
correction are not measured at the time of each satellite overpass, it is necessary to de-velop a robust algorithm that relies only on the satellite-derived information for removal of the sunglint effects. Thus, the new algorithm does not use the ancillary data (such as wind speed and direction) but entirely depends on the Rayleigh corrected radiance itself. This way of sunglint correction is efficient and has wider applicability regardless
10
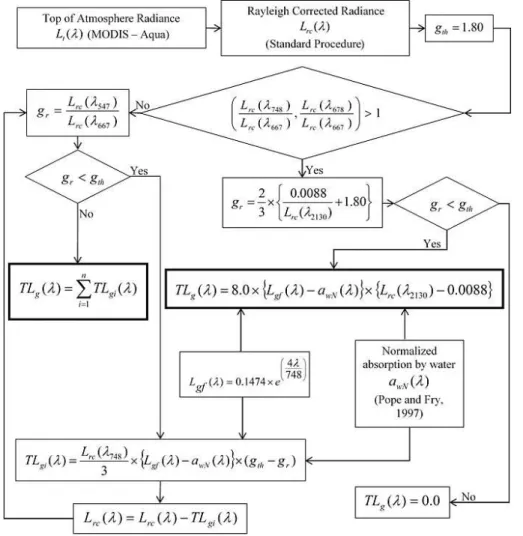
of the water types and weather conditions. Figure 1 shows a step-by-step procedure to compute the sunglint radiance and remove its effect on satellite ocean colour imagery. The procedure is elucidated in the following sections.
2.1 Calculation of glint ratio (gr)
The glint radiance spectra do not have any features, but are a continuously increasing
15
function of wavebands (Doerffer et al., 2008; Shanmugam, 2012). Addition of a strictly increasing sunglint radiance spectrum through the wavebands would decrease the slope of two consecutive glint contaminated radiance bands. It implies that the lower the ratio of two Rayleigh corrected wavebands, the higher the glint contamination. This condition can be quantified by defining a glint ratio as
20
gr=Lrc(λ547)
Lrc(λ667) (2)
The ratio of the Rayleigh corrected radiance at 547 and 667 nm is chosen because most oceanic waters containing sediments and algal bloom features exhibit nearly the same response in these bands, with the highest radiance values at 547 nm and lowest radiance values at 667 nm in the visible spectral region (Rakesh Kumar and
Shan-25
OSD
11, 2791–2829, 2014A robust method for removal of glint effects from satellite ocean colour imagery
R. K. Singh and P. Shanmugam
Title Page
Abstract Introduction
Conclusions References
Tables Figures
◭ ◮
◭ ◮
Back Close
Full Screen / Esc
Printer-friendly Version Interactive Discussion
Discussion
P
a
per
|
Discussion
P
a
per
|
Discussion
P
a
per
|
Discussion
P
a
per
|
forms a floating bloom or a thick layer of bloom (Shanmugam et al., 2013) that covers the surface of water restricting specular reflection and hence significantly reduces the glint produced in the region. In these conditions, the total glint in a pixel depends on the water fraction and bloom fraction. Thegr defined in Eq. (2) fails when intense al-gal blooms are encountered resembling to land vegetation which completely change
5
the spectral features ofLw spectra (as shown in Fig. 11f of Rakesh Kumar and Shan-mugam, 2014). To avoid misinterpretation of glint for bloom-dominated pixels,gr is re-defined as a function ofLrc(2130 nm).Lrc(2130 nm) (Fig. 2a) can be used to estimate the extent of glint as the water constituents have very little influence in this band (Kauf-man et al., 2002). The 2130 nm band is generally not used because it has a low signal
10
to noise ratio (SNR), and is not available in many ocean colour sensors. If 2130 nm band (as in MODIS) is not available in a sensor, this band can be correlated with the 667 nm band with a good determination coefficient as shown in Fig. 2c (from pixels marked by transect in Fig. 2a).
Thegrobtained by the ratio of 547 and 667 nm bands can be related toLrc(2130 nm)
15
(Fig. 2d) and this relationship can be used to determine the glint radiance for bloom-dominated waters distinguished using the band ratios (Rakesh Kumar and Shan-mugam, 2014). Thegrcan be calculated as follows,
gr=2
3×
0.0088
Lrc(λ2130)+1.8
(3)
The glint ratio obtained from this method is applied only to those pixels characterized
20
by high chlorophyll waters with peak radiances at 678 and 748 nm.
2.2 Determination of glint threshold (gth)
To identify the pixels contaminated by sunglint and determine the extent of the glint-contaminated region, a threshold value of Lrc(2130 nm)=0.0088 µW cm−2nm−1sr−1 is defined. In Fig. 2b the red portions are contaminated by intense glint effects with
25
OSD
11, 2791–2829, 2014A robust method for removal of glint effects from satellite ocean colour imagery
R. K. Singh and P. Shanmugam
Title Page
Abstract Introduction
Conclusions References
Tables Figures
◭ ◮
◭ ◮
Back Close
Full Screen / Esc
Printer-friendly Version Interactive Discussion
Discussion
P
a
per
|
Discussion
P
a
per
|
Discussion
P
a
per
|
Discussion
P
a
per
|
value depicting moderate/minimal glint effects, and the blue colour shows the glint free regions.
Due to the absence of 2130 nm band in many sensors, it is related to the 547 and 667 nm bands using radiance values (from the transect in Fig. 2a) with the re-gression values shown in Fig. 3a and b. Using the slope and intercept values from
5
Fig. 3a and b and Eq. (3), the glint threshold (gth) can be defined asgratLrc(2130 nm)=
0.0088 µW cm−2nm−1sr−1.
gr|Lrc(λ2130)=0.0088=gth=
Lrc(λ547)
Lrc(λ667) =
19.68×Lrc(λ2130)+0.3738
18.0×Lrc(λ2130)+0.1412 ≈1.8 (4)
Equation (4) states that glint correction is required whenever the value ofgris less than
gth. The NGC method estimates glint radiance in an iterative process to reduce a small
10
portion of glint radiance per iteration. The systematic reduction of glint increases the value ofgr and finally converges togth (Fig. 3c). The number of iterations involved in the process depends upon the extent of the glint contamination in a given pixel. The lower the glint ratio, the larger the amount of glint deducted in an iteration. The iterative procedure gives a more precise value of glint radiance but it cannot be applied on
15
bloom conditions asLrc (2130 nm) cannot be updated as visible and NIR bands, and hence, after one iteration theLrc (2130 nm) information becomes obsolete.
2.3 Normalized absorption by water (awN(λ))
The NGC algorithm uses the normalized absorption coefficient of waterawN(λ), which are taken from Pope and Fry (1997) and extrapolated to the near infrared (NIR) bands
20
OSD
11, 2791–2829, 2014A robust method for removal of glint effects from satellite ocean colour imagery
R. K. Singh and P. Shanmugam
Title Page
Abstract Introduction
Conclusions References
Tables Figures
◭ ◮
◭ ◮
Back Close
Full Screen / Esc
Printer-friendly Version Interactive Discussion
Discussion
P
a
per
|
Discussion
P
a
per
|
Discussion
P
a
per
|
Discussion
P
a
per
|
2.4 Glint spectral function (Lgf(λ))
The glint spectral function is a constant spectrum, which defines the basic behavior of glint and its spectral shape is altered depending on the glint intensity in a given pixel. The multiplication of other terms (defined in the next step) depending on the magnitude of glint toLgf(λ) modifies its spectral shape as required for better glint correction. The
5
value ofLgf(λ) is calculated on the basis of the assumption of continuously increasing spectrum of sunglint as shown in different studies (Doerffer et al., 2008; Shanmugam, 2012; Pravin and Shanmugam, 2014). This behavior can be easily determined by an exponential function of wavelength.
Lgf(λ)=0.1474×e(7484λ) (5)
10
The regression coefficient in Eq. (5) is tuned using the minimum value ofgth(i.e., 1.80) with an error of±1 %.
2.5 Estimation of glint radiance
In satellite imagery, water acts as a background which absorbs the radiance strongly at longer wavelengths (Pope and Fry, 1997). The absorption by water alters the shape
15
of the glint spectrum, which can be determined as the difference between glint spectral function and normalized absorption by water as given below,
T Lg(λ)∝(Lgf(λ)−awN(λ)) (6) whereT(λ) is the direct transmittance associated with the total glint Lg(λ). The total glint contamination is evaluated by the inequality between gr and gth, which makes
20
one of the factors contributing to its magnitude. The larger the difference betweength
andgr, the stronger the glint contamination, which implies that the total glint is directly proportional to this difference,
OSD
11, 2791–2829, 2014A robust method for removal of glint effects from satellite ocean colour imagery
R. K. Singh and P. Shanmugam
Title Page
Abstract Introduction
Conclusions References
Tables Figures
◭ ◮
◭ ◮
Back Close
Full Screen / Esc
Printer-friendly Version Interactive Discussion
Discussion
P
a
per
|
Discussion
P
a
per
|
Discussion
P
a
per
|
Discussion
P
a
per
|
The proportionality factor for the total glint depends upon the radiance level of the pixel, leading to the inclusion ofLrc(λ748) with a scale factor 3 to limit the small portion of glint radiance deducted in each iteration. The resulting equation to compute the glint radiance can be expressed as,
T Lgi(λ)=Lrc(λ748)
3 ×(Lgf(λ)−awN(λ))×(gth−gr) (8)
5
The approximation ofT Lg(λ) is achieved in several steps so as to avoid overestimation, andLrc(λ) is subsequently updated after each iteration to reduce a small portion of glint in every iteration. The decrease in the magnitude ofLrc(λ) leads to an increase in gr. The process is carried out until thegrapproachesgth(Fig. 3c). Thus, afterniterations, the total glint contamination can be defined as a sum of TLgi,
10
T Lg(λ)= n X
i=1
T Lgi(λ) (9)
The above expression is capable of providing accurate estimates of sunglint radiance for pixels of waters other than the bloom-dominated waters. As mentioned earlier, after the first iteration, Lrc (2130 nm) becomes obsolete and hence, the glint radiance is needed to be removed in the first iteration only. Thus, Eq. (8) can be rewritten by
15
relatingT LgandLrc(2130 nm) as follows,
T Lg(λ)=8.0× {Lgf(λ)−awN(λ)} × {Lrc(λ2130)−0.0088} (10a)
T Lg(λ)=0.2× {Lgf(λ)−awN(λ)} × {Lrc(λ667)−0.3} (10b) Note that the SWIR bands are not available in many ocean colour sensors; hence the 667 nm band can be used to estimate the glint radiance. Equation (10b) has tuned
20
OSD
11, 2791–2829, 2014A robust method for removal of glint effects from satellite ocean colour imagery
R. K. Singh and P. Shanmugam
Title Page
Abstract Introduction
Conclusions References
Tables Figures
◭ ◮
◭ ◮
Back Close
Full Screen / Esc
Printer-friendly Version Interactive Discussion
Discussion
P
a
per
|
Discussion
P
a
per
|
Discussion
P
a
per
|
Discussion
P
a
per
|
suspended sediment dominated waters due to high level of radiance in the red spectral region. However, high absorption and low radiance in this spectral region can be used to estimate the glint radiance in bloom dominated waters, whereas rest of the portions (pixels) are treated using the 748 nm band (Eq. 8).
The efficiency of the NGC algorithm is assessed based on the digital interpretation
5
and assumption of spatial homogeneity of glint corrected products. To evaluate its ef-ficiency in-situ observation data (with and without glint contamination) are used. The validation results are also compared with those of the default glint correction procedure in SeaDAS software.
3 Data sources
10
Several MODIS Level-1A data (Local Area Coverage data) of the Arabian Sea (avail-able at http://oceancolor.gsfc.nasa.gov/) have been selected for evaluating the perfor-mance of the proposed NGC algorithm. The purpose of choosing the Arabian Sea is that the tropical region is seasonally subjected to reversing monsoonal wind system. With intense blooms driven by coastal upwelling, Ekman pumping and meso-scale
ed-15
dies during summer, and winter-cooling and convective mixing associated with aerosol dust deposition during winter (Kumar et al., 2010), thus becoming one of the most bio-logically productive regions of the world’s oceans (Banse, 1987). However, the season-ality of the phytoplankton blooms, the high biological productivity, and the associated optical properties remain poorly explored and understood. Many complex atmosphere–
20
ocean interactions make the Arabian Sea to be optically complex, affecting the default atmospheric correction algorithm to produce highly erroneous ocean colour products.
The selected MODIS–Aqua L1A data are converted to the calibrated and scaled L1B (Level 1-B) top-of-atmosphere radiance (Lt(λ)) using SeaDAS. These radiances are passed into the default algorithm (Wang, 2002, 2005) to obtain Rayleigh corrected
25
radiance (Lrc(λ)) in the L1B to L2 (Level 2) processing step. The Lrc(λ) radiances are input in to the NGC algorithm to estimate and minimize sunglint contamination in the
OSD
11, 2791–2829, 2014A robust method for removal of glint effects from satellite ocean colour imagery
R. K. Singh and P. Shanmugam
Title Page
Abstract Introduction
Conclusions References
Tables Figures
◭ ◮
◭ ◮
Back Close
Full Screen / Esc
Printer-friendly Version Interactive Discussion
Discussion
P
a
per
|
Discussion
P
a
per
|
Discussion
P
a
per
|
Discussion
P
a
per
|
data. The sunglint corrected radiance produced by the NGC method is then fed to the aerosol correction scheme (Rakesh Kumar and Shanmugam, 2014) to obtain the desired water-leaving radiance Lw(λ). Sunglint correction is assessed based on the derived ocean colour products such as water-leaving radiance and chlorophyll gen-erated with and without sunglint correction. The results from the NGC algorithm are
5
compared with those of the default sunglint model for all the selected MODIS-Aqua images. Separately, MODIS-Aqua image (file A2004026202500) is processed to ob-tain the Rayleigh-corrected radiances in order to address the sensor saturation issues pertaining to glint contamination.
To analyze the performance of NGC method, concurrent in-situ data and MODIS–
10
Aqua data are used for validation. The in-situ data used in this study is a part of the NASA bio-Optical Marine Algorithm Data set (NOMAD) (Werdell and Bailey, 2005), consisting of 35 in-situ and MODIS-Aqua matchups in regions away from the sunglint or without glint contamination and 4 matchups with glint contamination. Though the number of matchups with glint contamination is small, it is sufficient to show the validity
15
and behavior of the present algorithm.
4 Results and discussion
4.1 Image and spectral analyses using MODIS-Aqua data
Saturation issue is well addressed with an example of MODIS-Aqua imagery (A2004026202500) from the Pacific Ocean (Fig. 4a), where the Rayleigh corrected
20
radiances (Lrc) are plotted for a transect running from high sunglint to low sunglint (bot-tom to top). Figure 4b and c shows very high radiances at 412 and 443 nm for a num-ber of pixels (in the order of 32 µW cm−2nm−1sr−1) suggesting the presence of clouds. A similar trend is seen at 448 nm but with many more number of pixels saturated due to sunglint in the beginning of the transect (Fig. 4d). The level of radiance for which the
25
OSD
11, 2791–2829, 2014A robust method for removal of glint effects from satellite ocean colour imagery
R. K. Singh and P. Shanmugam
Title Page
Abstract Introduction
Conclusions References
Tables Figures
◭ ◮
◭ ◮
Back Close
Full Screen / Esc
Printer-friendly Version Interactive Discussion
Discussion
P
a
per
|
Discussion
P
a
per
|
Discussion
P
a
per
|
Discussion
P
a
per
|
blue-green bands to 3.2 µW cm−2nm−1sr−1 in the red and NIR bands. The number of pixels saturated with such high radiance values further increases toward the red and NIR bands (Fig. 4g–j), reaching around 1500 pixels at 869 nm (Fig. 3j).
The results of NGC algorithm are compared with those of the SGC model, the Fig. 5a is a typical example of the Rayleigh-corrected radiance image (667 nm), where a
tran-5
sect (green) running across the glint patch and a box covering a portion of sunglint are used for extracting and comparing theLrc,T LgandLrc−T Lg(glint corrected) inter-mediate products. TheT Lgspectra extracted from the glint contaminated region (box in Fig. 5a) demonstrate that the SGC model tend to underestimate the glint radiances significantly when compared to the NGC algorithm (Fig. 5b and c). The comparison of
10
the products from these models further shows high T Lg radiances for pixels (beyond pixel number 320) in the centre of the glint patch because of the underestimation of glint by the SGC model (Fig. 5d). The lack of ancillary data such as wind speed and direction leads to a wrong estimation of the SGC glint spectrum (T Lg) relative to theLrc
spectrum. This wrong estimation of slope values in turn results in uneven correction of
15
glint in the imagery. By contrast, the NGC algorithm performs well in terms of remov-ing the glint signal more accurately (see more realistic (Lrc−T Lg) values for the entire transect) and retaining the useful signal for further processing (Fig. 5e).
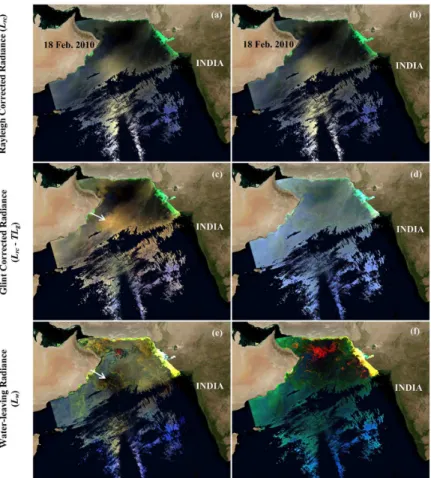
To better visualize these issues, the false colour composite images (R–G– B=748 nm–547 nm–412 nm) generated using the Raleigh-corrected radiance (Lrc),
20
glint-corrected radiance (Lrc−T Lg) and water-leaving radiance (Lw) are shown in Fig. 6a–f. The Rayleigh-corrected image clearly shows a long patch (unsaturated) of sunglint extending from the southern to the northern Arabian Sea, spatially diverse aerosols in the vicinity of coasts and across the Arabian Sea and highly reflective sedi-ments (bright features) especially around the Gulf of Kutch on the west of India (Fig. 6a
25
and b). When the SGC model is applied to these complex conditions (i.e., the combina-tion of aerosol-induced glint, cloud-induced glint, and sunglint), its efficiency is partic-ularly deteriorated as the presence of aerosols in the glint affected area increases the magnitude of radiances significantly. The residual glint radiance can be easily seen in
OSD
11, 2791–2829, 2014A robust method for removal of glint effects from satellite ocean colour imagery
R. K. Singh and P. Shanmugam
Title Page
Abstract Introduction
Conclusions References
Tables Figures
◭ ◮
◭ ◮
Back Close
Full Screen / Esc
Printer-friendly Version Interactive Discussion
Discussion
P
a
per
|
Discussion
P
a
per
|
Discussion
P
a
per
|
Discussion
P
a
per
|
the glint-corrected (Lrc−T Lg) image produced by the SGC model (Fig. 6c). The conse-quence of the underestimation of glint is overestimation of the aerosol radiance (La(λ)) and overcorrection ofLw(λ). The dark patch indicated in Fig. 6e exhibits significantly reduced Lw(λ) values (Fig. 7c) and this effect can be seen as an elevated pigment concentration in the Algal Bloom Index (ABI) chlorophyll product (Shanmugam, 2011)
5
(Fig. 7d). The right column (Fig. 6d–f) shows the corresponding products generated by the NGC algorithm. It becomes apparent that the NGC algorithm allows removal of glint effects from this image so well that produces spatially homogeneous features in the glint-corrected image and physically realistic features in the water-leaving radiance data.
10
The new Lw(λ) image clearly depicts an extensive field of curvilinear and spiral-like features (red colour indicative of floating blooms and green colour indicative of in-water blooms) of theN. miliaris blooms associated with meso-scale eddies in the central Arabian Sea and highly reflective suspended sediments (yellow colour) along the coastal areas (along the Gujarat coast in the eastern Arabian Sea) (Rakesh Kumar
15
and Shanmugam, 2014). Clearly, theLw(λ) spectra in Fig. 7 peak toward the blue region due to high backscattering and diminish in the NIR due to profound absorption by water itself. Slightly highLw values are seen at 678 nm due to the chlorophyll fluorescence which indicate a phytoplankton concentration larger than the background level usually found in clear waters (Shanmugam et al., 2013; Shanmugam, 2011; Rakesh Kumar and
20
Shanmugam, 2014). Both theLw(λ) spectra and chlorophyll products from the NGC algorithm appear more realistic than those of the SGC model. Another improvement in the NGC products is its ability to reduce the complex effects of aerosol-induced glint (indicated by black arrow) and cloud-induced glint (indicated by white arrow) and this effect is particularly seen in the ABI chlorophyll image (Fig. 7f). It is quite clear that
25
OSD
11, 2791–2829, 2014A robust method for removal of glint effects from satellite ocean colour imagery
R. K. Singh and P. Shanmugam
Title Page
Abstract Introduction
Conclusions References
Tables Figures
◭ ◮
◭ ◮
Back Close
Full Screen / Esc
Printer-friendly Version Interactive Discussion
Discussion
P
a
per
|
Discussion
P
a
per
|
Discussion
P
a
per
|
Discussion
P
a
per
|
Figure 7g and h shows quantitative comparisons of the derived chlorophyll concen-tration for cases with and without glint correction (Fig. 7b, d and f). It is evident that when glint correction is ignored in the atmospheric correction procedure, the chlorophyll val-ues are abnormally high (beyond 120 mg m−3) due to the presence of glint in the data (see Fig. 7b, g and h). With glint correction by the SGC model (along with the
de-5
fault atmospheric correction algorithm), the retrieved chlorophyll values are reasonably consistent with those of the NGC algorithm (implemented along with the new aerosol correction method, Rakesh Kumar and Shanmugam, 2014) in relatively clear waters. But the performance of SGC deteriorates when chlorophyll concentration is as high as 80 mg m−3 in bloom waters (pixels 400–600 on the transect in Fig. 7b). However, the
10
number of such abnormal retrievals is drastically reduced and more reasonable chloro-phyll data are achieved with the correction of glint contamination applied using the NGC algorithm. For relatively high chlorophyll values from the glint pixels (see the filament-like features of dense blooms in the area of strong sunglint in the magnified chlorophyll image),Lw(λ) are plotted in Fig. 7e with convincing spectral shapes and magnitudes
15
for typical algal blooms. These spectra suggest that accurate retrievals of the water-leaving radiance have improved the accuracy in chlorophyll retrievals over these glint affected regions. The high chlorophyll values for the SGC model is due to the overes-timation ofLa(λ) in optically complex waters (Rakesh Kumar and Shanmugam, 2014), but the estimation is further biased due to the underestimation of the glint radiance in
20
the glint contaminated regions.
To examine the consistency of the NGC algorithm, both the SGC and NGC algo-rithms were tested on six other MODIS-Aqua images where the sunglint contamination was obvious. The sunglint mask was purposely turned offbefore applying these algo-rithms to all glint contaminated regions. Figures 8a–c and 9a–c display the
Rayleigh-25
corrected images with different glint patterns ranging from highly concentrated (e.g., 22 February 2013 and 5 March 2013) to wide-spread glints (e.g., 17 February 2009 and 26 February 2013). Note that the glint corrected radiance data produced by the SGC model still contain high level of residual glints surrounding the glint mask and
OSD
11, 2791–2829, 2014A robust method for removal of glint effects from satellite ocean colour imagery
R. K. Singh and P. Shanmugam
Title Page
Abstract Introduction
Conclusions References
Tables Figures
◭ ◮
◭ ◮
Back Close
Full Screen / Esc
Printer-friendly Version Interactive Discussion
Discussion
P
a
per
|
Discussion
P
a
per
|
Discussion
P
a
per
|
Discussion
P
a
per
|
in regions of the concentrated sunglint patterns (Figs. 8d–f and 9d–f), whereas the glint corrected radiances from the NGC algorithm appear to be much more reasonable (Figs. 8j–l and 9j–l). The residual sunglint radiances and glints produced by aerosols and clouds, clearly seen in Figs. 8e and 9d, likely increase the aerosol radiances to be used in the subsequent atmospheric correction procedure. The aerosol correction
pro-5
cedures (Gordon and Wang, 1994; Ruddick et al., 2000; Shanmugam, 2012; Rakesh Kumar and Shanmugam, 2014) use the NIR bands which are the most affected bands when residual glint radiances come into play (Gordon, 1978). These high radiances in the NIR region are assumed to be due to aerosols and extrapolated to other visible bands, which ultimately results in highly erroneousLw(λ) retrievals in the glint
contam-10
inated regions. Consequently, removal of the glint effects by the SGC model is flawed by over-correction or under-correction of the water-leaving radiances (Figs. 8g–i and g–i). On the contrary, there are no obvious biases and noises in the water-leaving ra-diances produced by the NGC algorithm (Figs. 8m–o and 9m–o). The spatial structure of the turbid and bloom features detected in the new Lw products is consistent with
15
results from a previous study (Shanmugam et al., 2013). The false colour composite images generated with theLwproducts do not show the magnitude of errors caused by the glint correction procedure. To examine these errors, chlorophyll data were derived from the ABI algorithm applied to the results of the SGC and NGC algorithms (Fig. 10). Clearly, chlorophyll retrievals with the SGC model are high for northern Arabian Sea
20
waters (consistent brown patches depicting an over-estimation of chlorophyll in both low bloom and high bloom waters), because the derived normalized water-leaving ra-diances are significantly reduced. The failure of the default aerosol correction in the SeaDAS processing system can be attributed to the inadequate NIR correction. An-other reason for failure is the constraints for deriving aerosol optical properties whose
25
OSD
11, 2791–2829, 2014A robust method for removal of glint effects from satellite ocean colour imagery
R. K. Singh and P. Shanmugam
Title Page
Abstract Introduction
Conclusions References
Tables Figures
◭ ◮
◭ ◮
Back Close
Full Screen / Esc
Printer-friendly Version Interactive Discussion
Discussion
P
a
per
|
Discussion
P
a
per
|
Discussion
P
a
per
|
Discussion
P
a
per
|
Since the northern Arabian Sea is surrounded by Thar Desert in the east, the Rub-Al-Khali (Arabian Desert) in the west and Iranian Desert in the north, the glint effects produced during the transport of these aerosols are simply ignored by the SGC model leading to overestimating of the chlorophyll concentration. Similarly, the derived chloro-phyll concentration is high for moderate bloom waters affected by the cloud-induced
5
glint (indicated by white arrow in Fig. 10a and b). The effect of residual glint contam-ination due to sunglint, aerosols and clouds is already reported to bias the derived aerosol optical thickness high and to overestimate the chlorophyll (Wang and Bailey, 2001). For clear oceanic waters surrounding the glint mask in the southern part of the Arabian Sea, the chlorophyll concentration derived with the SGC model is reduced
10
significantly compared with the results of the NGC algorithm.
To explore the possibility and see the applicability of the NGC algorithm for res-cuing the discarded data, we also extended our analysis to exploit signals observed by MODIS-Terra sensor looking within regions of the Arabian Sea affected by high glint (not shown for brevity). The MODIS-Terra instrument is designed to operate over a wide
15
dynamical range to capture low water-leaving radiance and high surface radiance from land. When examined the performance of the NGC algorithm, it was found that a large portion of such glint contaminated region is successfully recovered by the NGC algo-rithm. Thus, it can also be applied to similar regions affected by bright sunglint when the requirement of a stable response over a wide dynamical range for the new generation
20
ocean colour sensors is fulfilled.
4.2 Validation of MODIS-Aqua water-leaving radiances with in-situ data
To validate the results obtained by the NGC method and to compare its results with those from the SGC method, 4 glint contaminated matchups and 35 matchups from other regions are used. Many data showing the highest magnitude in the water-leaving
25
radiance signal were collected from the coastal regions. To examine whether the water signals (high radiance) without glint contamination are corrected for glint, the in-situ matchups are chosen from the Florida Keys and Bay of Fundy which are dominated
OSD
11, 2791–2829, 2014A robust method for removal of glint effects from satellite ocean colour imagery
R. K. Singh and P. Shanmugam
Title Page
Abstract Introduction
Conclusions References
Tables Figures
◭ ◮
◭ ◮
Back Close
Full Screen / Esc
Printer-friendly Version Interactive Discussion
Discussion
P
a
per
|
Discussion
P
a
per
|
Discussion
P
a
per
|
Discussion
P
a
per
|
by suspended sediments (Fig. 11a and b). As expected, the SGC method underesti-mates the water-leaving radiance data in both relatively clear waters and turbid waters. The Lw retrievals from the NGC algorithm show close correspondence to in-situ Lw
data (Fig. 11b). The mean spectralLw for these 35 observations is shown in Fig. 11c and d, with an average high radiance of≈1.5µW cm−2nm−1sr−1(in the green region).
5
The clear underestimation of Lw(λ) by the SGC method is mainly due to the erro-neous aerosol estimation (Bailey et al., 2010; Ruddick et al., 2000; Shanmugam, 2012; Rakesh Kumar and Shanmugam, 2014) over turbid waters, and an apparent improve-ment with the NGC output is because of the impleimprove-mentation of a new aerosol correction algorithm (Rakesh Kumar and Shanmugam, 2014). However, both SGC and NGC
al-10
gorithms distinguish suspended sediments and glint properly and hence there is no effect of these methods on their outputs. Further statistical analyses of these results show noticeably lower RMSE and MRE values for the NGC algorithm than for the SGC algorithm (Fig. 11d).
Figure 11e and f shows true colour composite images of MODIS-Aqua showing the
15
Bay of Fundy with sampling locations affected by the glint effects. These points are present in the low glint region and are subjected to glint correction by both the glint correction methods. Figure 11g shows improvement in the resulting products from the NGC over the SGC method when related to the in-situLwdata. This is obvious with the mean water-leaving spectra shown in Fig. 11h, where the NGC derivedLwspectrum is
20
more closer to the in-situLwspectrum than the SGCLwspectrum.
5 Conclusions
Sunglint correction is an important step in atmospheric correction of satellite ocean colour imagery which minimizes or removes the sunglint effects to derive more ac-curate water-leaving radiances. The effects of other glint effects produced by intense
25
OSD
11, 2791–2829, 2014A robust method for removal of glint effects from satellite ocean colour imagery
R. K. Singh and P. Shanmugam
Title Page
Abstract Introduction
Conclusions References
Tables Figures
◭ ◮
◭ ◮
Back Close
Full Screen / Esc
Printer-friendly Version Interactive Discussion
Discussion
P
a
per
|
Discussion
P
a
per
|
Discussion
P
a
per
|
Discussion
P
a
per
|
and direction, solar and viewing geometries, and aerosol optical thickness) which are either unavailable for every satellite overpass or insufficient for accurate glint correc-tion. Further if the ancillary data such as wind speed and direction and solar and sensor geometry are not synchronized with each other, it would often lead to the incorrect ap-proximation of sea surface slope and hence inaccurate and erroneous ocean colour
5
products required for further analyses. Regardless of these drawbacks, there are also obvious problems with these methods ignoring other glint contributing elements in the imagery.
To overcome these problems, a new algorithm for sunglint correction (NGC) has been developed and implemented in the SeaDAS processing system along with a
re-10
cent aerosol correction method (Rakesh Kumar and Shanmugam, 2014). The NGC algorithm is novel because it entirely depends on the satellite-derived product (Lrc) alone, thereby enabling accurate removal of the sunglint effects in satellite derived ocean colour data. Its effectiveness is also apparent in regions affected by other glint effects produced by intense aerosols and clouds (Fig. 12c and d). The NGC algorithm
15
has a provision to estimate the intensity and extent of glint in each pixel iteratively which helps to avoid an over-estimation of glint caused by a one-step process. Another feature is the magnitude of glint portion calculated in each iteration and deducted from the Lrc that decreases exponentially in each iteration. This enables the accuracy of glint radiances estimated by the NGC algorithm for the successive iteration. When the
20
chlorophyll concentration increases, algal blooms begin to occur in the water column that tends to suppress the specular reflection of light at the surface. For waters with floating blooms, a large fraction of pixel does not produce specular reflection leading to significantly low glint values. Thus, the glint signal of these pixels depends upon the glint fraction and intensity and spatial extent of blooms. The treatment of such pixels is
25
successfully achieved by the NGC algorithm and the resulting water-leaving radiance values are thus reliable for further interpretation and analyses (Fig. 12c).
The performance of NGC algorithm when tested on several MODIS-Aqua images ac-quired over Arabian Sea waters in the presence of sunglint and complex aerosols and
OSD
11, 2791–2829, 2014A robust method for removal of glint effects from satellite ocean colour imagery
R. K. Singh and P. Shanmugam
Title Page
Abstract Introduction
Conclusions References
Tables Figures
◭ ◮
◭ ◮
Back Close
Full Screen / Esc
Printer-friendly Version Interactive Discussion
Discussion
P
a
per
|
Discussion
P
a
per
|
Discussion
P
a
per
|
Discussion
P
a
per
|
clouds is exceptionally good. Comparison of the water-leaving radiances and chloro-phyll products generated with and without glint correction demonstrates the necessity of glint correction by the NGC algorithm. Further validation conducted based on the concurrent in-situ and MODIS-Aqua data confirms that the NGC algorithm yields sig-nificantly low errors when compared to the SGC model. The later model often leads to
5
significantly reduced Lw values and increased chlorophyll concentrations in the glint-contaminated regions. The accuracy of ocean colour products obtained from this model is also deteriorated in other regions affected by glints due to aerosols and clouds. By contrast, the NGC algorithm minimizes all these complex glint effects and delivers ac-curate ocean colour products as desired by the research community. The main
advan-10
tage of this algorithm is its robustness in terms of correcting the sunglint and other glint effects effectively and producing reliable ocean colour products. The approach de-scribed here will expedite the routine adaptation of this algorithm for improving satellite derived ocean biological and ocean optical products, e.g., chlorophyll concentration, suspended sediment concentration, the diffuse attenuation coefficient, and ocean
in-15
herent optical property data.
Acknowledgements. This work is supported by grants from the ISRO-IITM cell (Number: ICSR/ISRO-IITM/OEC/13-14/149/PSHA). We gratefully acknowledge the Ocean Biology Pro-cessing Group of NASA for the distribution of the MODIS data and NOMAD in-situ data and the development and support of the SeaDAS Software.
20
References
Bailey, S. W., Franz, B. A., and Werdell, P. J.: Estimation of near-infrared water-leaving reflectance for satellite ocean colour data processing, Opt. Express, 18, 7521–7527, doi:10.1364/OE.18.007521, 2010.
Banse, K.: Seasonality of phytoplankton chlorophyll in the central and northern Arabian sea,
25
OSD
11, 2791–2829, 2014A robust method for removal of glint effects from satellite ocean colour imagery
R. K. Singh and P. Shanmugam
Title Page
Abstract Introduction
Conclusions References
Tables Figures
◭ ◮
◭ ◮
Back Close
Full Screen / Esc
Printer-friendly Version Interactive Discussion
Discussion
P
a
per
|
Discussion
P
a
per
|
Discussion
P
a
per
|
Discussion
P
a
per
|
Bréon, F. M. and Henriot, N.: Spaceborne observations of ocean glint reflectance and modelling of wave slope distributions, J. Geophys. Res., 111, C06005, doi:10.1029/2005JC003343, 2006.
Cox, C. and Munk, W.: Measurement of the roughness of the sea surface from photographs of the Sun’s glitter, J. Opt. Soc. Am., 44, 838–850, 1954.
5
Deschamps, P. Y., Herman, M., and Tanre, D.: Modelling of the atmospheric effects and its application to the remote sensing of ocean colour, Appl. Optics, 22, 3751, doi:10.1364/AO.22.003751, 1983.
Deschamps, P.-Y., Breon, F.-M., Leroy, M., Podaire, A., Bricaud, A., Buriez, J.-C., and Seze, G.: The POLDER mission: instrument characteristics and scientific objectives, IEEE T. Geosci.
10
Remote, 32, 598–615, doi:10.1109/36.297978, 1994.
Doerffer, R., Schiller, H., Fischer, J., Preusker, R., and Bouvet, M.: The impact of sun glint on the retrieval of water parameters and possibilities for the correction of MERIS scenes, in: Proceedings of the 2nd MERIS (A) ATSR User Workshop, vol. 2008, Frascati, Italy, 2008. Ebuchi, N. and Kizu, S.: Probability distribution of surface wave slope derived using Sun glitter
15
images from geostationary meteorological satellite and surface vector winds from scatterom-eters, J. Oceanogr., 58, 477–486, doi:10.1023/A:1021213331788, 2002.
Gomes, H. D. R., Goes, J. I., Matondkar, S. G. P., Parab, S. G., Al-Azri, A. R. N., and Thop-pil, P. G.: Blooms of Noctiluca miliaris in the Arabian Sea – an in situ and satellite study, Deep-Sea Res. Pt. I, 55, 751–765, doi:10.1016/j.dsr.2008.03.003, 2008.
20
Gordon, H. R.: Removal of atmospheric effects from satellite imagery of the oceans, Appl. Optics, 17, 1631–1636, doi:10.1364/AO.17.001631, 1978.
Gordon, H. R.: Atmospheric correction of ocean colour imagery in the Earth Observing System era, J. Geophys. Res., 102, 17081, doi:10.1029/96JD02443, 1997.
Gordon, H. R. and Wang, M.: Retrieval of water-leaving radiance and aerosol optical
thick-25
ness over the oceans with SeaWiFS: a preliminary algorithm, Appl. Optics, 33, 443–452, doi:10.1364/AO.33.000443, 1994.
Hagolle, O., Nicolas, J.-M., Fougnie, B., Cabot, F., and Henry, P.: Absolute calibration of VEG-ETATION derived from an interband method based on the Sun glint over ocean, IEEE T. Geosci. Remote, 42, 1472–1481, doi:10.1109/TGRS.2004.826805, 2004.
30
Kaufman, Y. J., Martins, J. V., Remer, L. A., Schoeberl, M. R., and Yamasoe, M. A.: Satellite retrieval of aerosol absorption over the oceans using sunglint, Geophys. Res. Lett., 29, 1928, doi:10.1029/2002GL015403, 2002.
OSD
11, 2791–2829, 2014A robust method for removal of glint effects from satellite ocean colour imagery
R. K. Singh and P. Shanmugam
Title Page
Abstract Introduction
Conclusions References
Tables Figures
◭ ◮
◭ ◮
Back Close
Full Screen / Esc
Printer-friendly Version Interactive Discussion
Discussion
P
a
per
|
Discussion
P
a
per
|
Discussion
P
a
per
|
Discussion
P
a
per
|
Kay, S., Hedley, J. D., and Lavender, S.: Sun glint correction of high and low spatial resolution images of aquatic scenes: a review of methods for visible and near-infrared wavelengths, Remote Sens., 1, 697–730, doi:10.3390/rs1040697, 2009.
Kumar, S. P., Roshin, R. P., Narvekar, J., Dinesh, P. K., and Vivekanandan, E.: Signatures of global warming and regional climate shift in the Arabian Sea, in: Climate Change and Aquatic
5
Ecosystems, edited by: Joseph, A., Nandan, S. B., and Augustine, A., 55–62, Cochin Uni-versity of Science and Technology, Cochin, India, available at: http://drs.nio.org/drs/handle/ 2264/3564, 2010.
Kutser, T., Vahtmäe, E., Paavel, B., and Kauer, T.: Removing glint effects from field radiometry data measured in optically complex coastal and inland waters, Remote Sens. Environ., 133,
10
85–89, doi:10.1016/j.rse.2013.02.011, 2013.
Mohan, M. and Chauhan, P.: Simulations for optimal payload tilt to avoid sunglint in IRS-P4 Ocean Colour Monitor (OCM) data around the Indian subcontinent, Int. J. Remote Sens., 22, 185–190, doi:10.1080/014311601750038929, 2001.
Ottaviani, M., Spurr, R., Stamnes, K., Li, W., Su, W., and Wiscombe, W.: Improving the
descrip-15
tion of sunglint for accurate prediction of remotely sensed radiances, J. Quant. Spectrosc. Ra., 109, 2364–2375, doi:10.1016/j.jqsrt.2008.05.012, 2008.
Pope, R. M. and Fry, E. S.: Absorption spectrum (380–700 nm) of pure water. II. Integrating cavity measurements, Appl. Optics, 36, 8710–8723, 1997.
Pravin, J. D. and Shanmugam, P.: A new theory and its application to remove the effect of
20
surface-reflected light in above-surface radiance data from clear and turbid waters, J. Quant. Spectrosc. Ra., 142, 75–92, 2014.
Rakesh Kumar, S. and Shanmugam, P.: A novel method for estimation of aerosol radiance and its extrapolation in the atmospheric correction of satellite data over optically complex oceanic waters, Remote Sens. Environ., 142, 188–206, doi:10.1016/j.rse.2013.12.001, 2014.
25
Ruddick, K. G., Ovidio, F., and Rijkeboer, M.: Atmospheric correction of SeaWiFS imagery for turbid coastal and inland waters, Appl. Optics, 39, 897, doi:10.1364/AO.39.000897, 2000. Shanmugam, P.: A new bio-optical algorithm for the remote sensing of algal blooms in complex
ocean waters, J. Geophys. Res., 116, C04016, doi:10.1029/2010JC006796, 2011.
Shanmugam, P.: CAAS: an atmospheric correction algorithm for the remote sensing of complex
30
OSD
11, 2791–2829, 2014A robust method for removal of glint effects from satellite ocean colour imagery
R. K. Singh and P. Shanmugam
Title Page
Abstract Introduction
Conclusions References
Tables Figures
◭ ◮
◭ ◮
Back Close
Full Screen / Esc
Printer-friendly Version Interactive Discussion
Discussion
P
a
per
|
Discussion
P
a
per
|
Discussion
P
a
per
|
Discussion
P
a
per
|
Shanmugam, P. and Ahn, Y.-H.: New atmospheric correction technique to retrieve the ocean colour from SeaWiFS imagery in complex coastal waters, J. Opt. A-Pure Appl. Op., 9, 511– 530, doi:10.1088/1464-4258/9/5/016, 2007.
Shanmugam, P., Suresh, M., and Sundarabalan, B.: OSABT: an innovative algorithm to de-tect and characterize ocean surface algal blooms, IEEE J. Sel. Top. Appl., 6, 1879–1892,
5
doi:10.1109/JSTARS.2012.2227993, 2013.
Shifrin, K. S.: An algorithm for determining the radiance reflected from the rough sea sur-face using MODIS-N satellite radiometer data, IEEE T. Geosci. Remote, 39, 677–681, doi:10.1109/36.911124, 2001.
Steinmetz, F., Deschamps, P., and Ramon, D.: Atmospheric correction in presence of sun glint:
10
application to MERIS, Opt. Express, 19, 9783–800, 2011.
Wang, M.: The Rayleigh lookup tables for the SeaWiFS data processing: accounting for the effects of ocean surface roughness, Int. J. Remote Sens., 23, 2693–2702, doi:10.1080/01431160110115591, 2002.
Wang, M.: A refinement for the Rayleigh radiance computation with variation of the atmospheric
15
pressure, Int. J. Remote Sens., 26, 5651–5663, doi:10.1080/01431160500168793, 2005. Wang, M. and Bailey, S. W.: Correction of Sun glint contamination on the SeaWiFS ocean and
atmosphere products, Appl. Optics, 40, 4790–4798, 2001.
Wang, M. and Shi, W.: The NIR-SWIR combined atmospheric correction approach for MODIS ocean colour data processing, Opt. Express, 15, 15722, doi:10.1364/OE.15.015722, 2007.
20
Werdell, P. J. and Bailey, S. W.: An improved in-situ bio-optical data set for ocean colour al-gorithm development and satellite data product validation, Remote Sens. Environ., 98, 122– 140, doi:10.1016/j.rse.2005.07.001, 2005.
Zhang, H. and Wang, M.: Evaluation of sun glint models using MODIS measurements, J. Quant. Spectrosc. Ra., 111, 492–506, doi:10.1016/j.jqsrt.2009.10.001, 2010.
25
OSD
11, 2791–2829, 2014A robust method for removal of glint effects from satellite ocean colour imagery
R. K. Singh and P. Shanmugam
Title Page
Abstract Introduction
Conclusions References
Tables Figures
◭ ◮
◭ ◮
Back Close
Full Screen / Esc
Printer-friendly Version Interactive Discussion
Discussion
P
a
per
|
Discussion
P
a
per
|
Discussion
P
a
per
|
Discussion
P
a
per
|
Table 1.a∗wNandLgfvalues for glint correction.
Wavelength (nm) awN Lgf
412 0.0310 1.3349 443 0.0468 1.5756 488 0.0940 2.0042 531 0.4418 2.5224 547 0.5952 2.7477 667 3.2599 5.2200 678 3.6052 5.5363 748 6.3206 8.0499 869 13.948 15.374
∗From Pope and Fry (1997), extrapolated to NIR
OSD
11, 2791–2829, 2014A robust method for removal of glint effects from satellite ocean colour imagery
R. K. Singh and P. Shanmugam
Title Page
Abstract Introduction
Conclusions References
Tables Figures
◭ ◮
◭ ◮
Back Close
Full Screen / Esc
Printer-friendly Version Interactive Discussion
Discussion
P
a
per
|
Discussion
P
a
per
|
Discussion
P
a
per
|
Discussion
P
a
per
|
Table 2.Error statistics for the SGC and NGC algorithms with glint and without glint conditions. Without or with low glint (n=35) With Glint (n=4)
Root Mean Square Error Mean Relative Error Root Mean Square Error Mean Relative Error
Wavelength (nm) SGC NGC SGC NGC SGC NGC SGC NGC
412 0.564 0.443 −0.598 −0.26 0.429 0.289 −0.712 −0.311 443 0.688 0.603 −0.495 −0.327 0.393 0.291 −0.538 −0.389 488 0.969 0.89 −0.45 −0.344 0.383 0.281 −0.451 −0.345 531 0.866 0.797 −0.395 −0.277 0.298 0.174 −0.389 −0.194 547 0.952 0.886 −0.399 −0.286 0.332 0.184 −0.397 −0.212 667 0.223 0.233 −0.418 −0.297 0.057 0.028 −0.387 −0.147