Sunny Prospects for Tomorrow?
Casper Frederik Stadel & Antonia Remmerbach
(#34045; #33849)
A Project carried out on the Master in Finance Program, under the supervision of:
Filipa Frade de Castro
Abstract
This equity research report intends to determine the target price of Beiersdorf
AG as of January 6, 2020 to issue a buy, hold or sell
recommendation relative to the current share price.
German-based Beiersdorf is a leading European consumer
goods company. The determination of Beiersdorf’s share
price is based on a profound intrinsic (DCF) and relative
(Comparable Companies) valuation including an in-depth
company, competitor and market analysis. The valuation
results in a target share price of EUR 108.42. Compared to
a closing share price of EUR 105.10 a hold
recommendation is issued.
Keywords
• Equity Research Report
• Consumer Goods Industry
• Beiersdorf AG
• Hold Recommendation
This work used infrastructure and resources funded by Fundação para a Ciência e a Tecnologia
(UID/ECO/00124/2013, UID/ECO/00124/2019 and Social Sciences DataLab, Project 22209), POR
Lisboa (LISBOA-01-0145-FEDER-007722 and Social Sciences DataLab, Project 22209) and POR Norte
(Social Sciences DataLab, Project 22209).
THIS REPORT WAS PREPARED EXCLUSIVELY FOR ACADEMIC PURPOSES BY CASPER FREDERIK STADEL AND ANTONIA REMMERBACH,
MASTER IN FINANCE STUDENTS OF THE NOVA SCHOOL OF BUSINESS AND ECONOMICS.THE REPORT WAS SUPERVISED BY A NOVA
SBE FACULTY MEMBER, ACTING IN A MERE ACADEMIC CAPACITY, WHO REVIEWED THE VALUATION METHODOLOGY AND THE FINANCIAL MODEL.
(PLEASE REFER TO THE DISCLOSURES AND DISCLAIMERS AT END OF THE DOCUMENT)
▪ We issue a HOLD recommendation for Beiersdorf AG with
the target share price of EUR 108.42, lying just slightly above the current share price of EUR 105.10. With an expected dividend per share of EUR 0.70 in 2019, shareholders receive a total return of 3.82%.
▪ Beiersdorf profits from sustainable growth in the past, in
the beauty and personal care as well as in the adhesives market, with sales growing at a CAGR of 2.61% between 2012 and 2018. Group sales are expected to continue this trend at a CAGR of +2.64% from 2019 to 2025.
▪ While the beauty and personal care markets in Europe and
North America are saturated, emerging markets represent high growth opportunities. A favourable adhesives market provides various possibilities for the brand tesa to strengthen its market positioning.
▪ Acquiring a share of Beiersdorf’s capital is attractive for
investors who are looking for a secure investment, even during economic downturns. The company’s solid financial structure indicates its strong balance sheet, characterized by a superior net liquidity position of above EUR 4 bn.
Company description
Beiersdorf AG is a globally operating German consumer products company, generating most of its sales in the Consumer segment (81% in 2018), offering beauty and personal care products through renowned brands, such as NIVEA and La Prairie. With its adhesive segment, Beiersdorf provides self-adhesive systems and product solutions mainly to industrial customers.
BEIERSDORF
AG
C
OMPANY
R
EPORT
C
ONSUMERG
OODS 06JANUARY 2020S
TUDENT:
C
ASPER S.
AND ANTONIA R.
34045/33849@novasbe.pt
Sunny Prospects for Tomorrow?
Beiersdorf facing the challenge of sustaining past organic growth levels in a dynamic market
Recommendation: HOLD
Vs Previous Recommendation HOLD
Price Target FY20: 108.42 €
Vs Previous Price Target n.a.
Price (as of 6-Jan-20) 105.10 €
Reuters: BEIG.DE, Bloomberg: BEI:GR
52-week range (€) 80.60-117.55
Market Cap (€bn) 26.536
Outstanding Shares (m) 252.0
Source: Bloomberg, Annual Report
Source: Bloomberg
(Values in € millions) 2018 2019E 2020F
Revenues 7,233 7.491 7.746 Gross Profit 4,158 4.299 4.472 EBITDA 1.268 1.147 1.178 EBIT 1.100 994 1.020 Operating Margin 15,2% 13,3% 13,2% Net Income 730 725 746 DPS 0.70 0.70 0.70 EPS 3.22 3.13 3.22 ROIC 14,4% 12% 10,9% FCF 532 557 679 EV / EBITDA 12.8x 18,4x 19.4x
Table of Contents
1. Executive Summary ... 2
2. Company Overview ... 3
2.1. Company Description ... 3 2.2. Shareholder Structure... 4 2.3. C.A.R.E.+ ... 53. Market Analysis ... 7
3.1. Beauty and Personal Care ... 7
3.1.1. Value Drivers... 10 3.2. Adhesive Technologies ... 12 3.2.1. Value Drivers... 13
4. Valuation ... 14
4.1. Financials ... 14 4.1.1. Revenues ... 144.1.2. Cost of Goods Sold ... 17
4.1.3. Operating Result ... 17
4.1.4. Financing Structure ... 18
4.1.5. CAPEX and Goodwill ... 19
4.1.6. Tangible Assets ... 19
4.1.7. Intangible Assets ... 20
4.2. Relative Valuation ... 20
4.2.1. Comparable Company Valuation ... 20
4.3. Intrinsic Valuation ... 21
4.3.1. Explicit Forecast Period ... 21
4.3.2. Cost of Capital ... 21
4.3.3. Terminal Growth Rate and Equity Bridge ... 22
4.3.4. Sensitivity Analysis ... 23
5. Appendix... 24
1. Executive Summary
The purpose of the following equity research report is to determine the fair value per share for Beiersdorf AG, an internationally operating German consumer goods company. Beiersdorf is operating in the beauty and personal care market (Consumer segment) as well as in the adhesives technologies market (tesa). The outcome of this analysis is a recommendation for investors whether to buy, hold or sell the Beiersdorf stock.
To arrive at the target price an in-depth analysis of the company, the competitors and the markets Beiersdorf is serving has been conducted. Past data as well as expected future performance have been incorporated in the analysis. The most important aspects investors need to consider are the following: With its Consumer segment, Beiersdorf is operating in a market characterized by changing consumer preferences, lowering barriers to entry and digital disruption. In order for Beiersdorf to gain market share and compete with digital-native beauty brands, the company needs to invest heavily. Not only in R&D and marketing but also in M&A activities. The new strategic direction set out in C.A.R.E.+ is a good start but current financials do not indicate that the objectives of the strategy will be achieved. Also, the market for adhesive technologies is in disruption with a growing demand for bio-based adhesives. Beiersdorf needs to strengthen its position in this segment with its ecoLogo products. For Beiersdorf, the year 2019 stood in the spirit of transformation: new CEO, new CFO, new strategic direction. Whether this change was only superficial remains to be seen in the coming years. What can be observed, however, is that Beiersdorf’s core issues have not changed for more than a decade. The shareholding structure is built in a way that the majority shareholder, maxingvest, is able to interfere with the company’s most important decisions and minority shareholders are neglected, manifested in the same payout ratio since 2007. Furthermore, the NIVEA brand still dominates the group and the company’s financing structure with net cash of more than EUR 4 bn is suboptimal. Taking these future developments into account, an intrinsic as well as a relative valuation were performed, leading to a more accurate estimation of Beiersdorf’s actual share price. The DCF-analysis is accompanied by a relative comparable company analysis (CCA). Three common trading-forward multiples were considered, namely EV/Sales, EV/EBITDA and EV/EBIT. Finally, the DCF method is considered as the primary method to determine Beiersdorf’s current share
Purpose
price, as it factors in the company’s main value drivers, being cost of capital, ROIC, and the terminal growth rate.
The intrinsic valuation yields a target price of EUR 108.42 for Beiersdorf’s share, corresponding to a HOLD recommendation for investors.
2. Company Overview
2.1. Company Description
Beiersdorf AG was founded in 1882 in Hamburg, Germany, where the company is still headquartered. Beiersdorf is a leading European consumer goods company, focusing on two independently operating business segments: Consumer and tesa. The Consumer business segment represents the core of Beiersdorf’s business, offering high-quality skin and body care products through 13 brands (Figure 1).
The Consumer division generated 81.42% of total sales in 2018 (EUR 7.23 bn), mostly through its iconic NIVEA brand (above 70% of the division’s sales). The hair care brands SLEK and Maestro are especially designed for the Asian market. However, due to poor performance of SLEK, Beiersdorf divested the brand in August 2019 (FWHK, 2019). Since this year, the U.S. sun care brand Coppertone is part of Beiersdorf’s product portfolio. In August, Beiersdorf acquired the brand from Bayer to strengthen its position in the underserved North American sun care market (Beiersdorf AG, 2019, August 30). The largest market for Beiersdorf’s Consumer business is Europe (49.94% of Consumer sales in 2018), followed by Africa/Asia/Australia (32.23%) and the Americas (17.83%) (Figure 2).
The company distributes its consumer products through five different channels: food and general goods retailers (high-quality retailers and discounters), drugstores, pharmacies, e-Commerce and a few own stores. Beiersdorf does not operate an own web shop but rather sells its products via global e-Commerce retailers such as Amazon, Walmart and Alibaba. Beiersdorf’s few physical stores are serving as flagship stores rather than being considered a main distribution channel.
Since 2001, the tesa business is an independently operating part of the Beiersdorf group that develops high-quality self-adhesive systems and product solutions for industry (electronics, automotive, construction and printing industries), craft business, and consumers. Tesa SE is a fully Figure 1: Brand Portfolio
Source: BEI Website
49,94%
17,83% 32,23%
Europe Americas Africa / Asia / Australia
Figure 2: Revenue Split Consumer by Geography
Source: BEI Annual Report
Figure 3: Revenue Split tesa by Geography
54,46%
16,15% 29,39%
Europe Americas Africa / Asia / Australia
Source: BEI Annual Report
owned subsidiary of Beiersdorf AG. Sales generated by the tesa division account for the remaining 18.58% of total sales in 2018. Tesa’s sales in 2018 split 54.46% in Europe, 29.39% in Africa/Asia/Australia and 16.15% in the Americas (Figure 3).
Tesa is serving two different segments: Direct Industries, which handles business directly with industrial customers, and the Trade Market segment, which sells products to intermediate trading partners, who resell tesa’s products through diverse distribution channels (Figure 4).
2.2. Shareholder Structure
Beiersdorf has been publicly listed since 1928 with the ticker BEI. Its stocks were traded for the first time on the Stock Exchange in Hamburg. Since December 2008, the company is part of the German stock index DAX, which includes 30 major German companies and trades on the Frankfurt Stock Exchange. For the past eight years up until today, Beiersdorf has 252.0 million shares outstanding. Beiersdorf AG holds 9.99% (25.18 million) of its own shares. These shares are no-par-value shares and do not have voting or dividend rights. As of December 31, 2018, the costs of Beiersdorf’s own treasury shares amounted to EUR 955 million. Beiersdorf’s biggest shareholder, owning 51.01% of share capital, is the family holding company maxingvest Group controlled by the German Herz family. The remaining 39% are free float (Figure 5).
In 2003, after a takeover battle with the American giant Procter & Gamble, the maxingvest Group acquired 19.6% of Beiersdorf’s share capital from Allianz SE and hence increased its stake from 30.3% to 49.9%. During the same time, the city of Hamburg's investment arm, the Hamburger Gesellschaft für Beteiligungsverwaltung, also acquired 10% of the company from Allianz. Together, the maxingvest Group and the City of Hamburg ensured that Beiersdorf is staying in the city and preserved almost 5,000 jobs (Deutsche Welle, 2003).
The Herz family is considered an active shareholder, interfering in important strategic decisions, obstructing the company’s decision-making process and causing a negligence of minority shareholders (Kapalschinski, 2016). The dividend policy, for example, has not changed for 10 years and the pay-out ratio lies well below its industry peers (Figure 6). Therefore, one cannot expect the company to raise dividend pay-out in the coming years despite increasing profits.
59,69% 40,31%
Direct Industries Trade Markets
Figure 4: Revenue Split tesa by Division
Source: BEI Annual Report
9,99%
51,01% 39,00%
Beiersdorf maxingvest Group Free Float
Figure 5: Shareholder Structure
Source: BEI Annual Report
Source: Morningstar Figure 6: Beiersdorf’s Payout Ratio compared to Peer Group
2.3. C.A.R.E.+
Deeply embedded in Beiersdorf’s business model are the company’s four core values. Namely, care, simplicity, courage and trust. These principles have been at the heart of Beiersdorf’s strategy for the last 140 years. In 2019 the company developed a new strategy in order to face the challenges of today’s uncertain market environment and increasing customer demand for sustainability and natural products. The new corporate strategy, C.A.R.E.+, is based on Beiersdorf’s strong commitment, five strategic priorities and the ambition to create more value for the people and the society. C.A.R.E.+ stands for Courage, Aspiration,
Responsibility and Empathy and complements the company’s core values
well. To achieve competitive sustainable growth in the future, Beiersdorf wants to harness digitalization in order to get closer to the customer, gain market share in growth markets (especially in Asia), enhance and increase its skin care product offering by leveraging on margin enhancing innovation. Further, the company aims at an increase in productivity by building a simple and fast organizational structure and create value for the society by relying on renewable electricity and socially supporting families in developing countries. In financial terms, this translates into ambitious goals, especially for the Consumer segment. Until 2023, Beiersdorf’s Consumer business is expected to outperform the market with medium-term growth of 4-6% (Figure 7). The investments for growth are planned for 2019 onwards and are expected to lead to EBIT margin improvements of 150-200 bps by 2023 (16-17%) (Figure 8). As of December 31, 2018, Beiersdorf is achieving an EBIT margin of 15.17%. Furthermore, C.A.R.E.+ aims to ensure organizational efficiencies, upskill the workforce and achieve cost discipline. Combined, the margin improvement and improved organizational efficiencies, will lead to savings of 250-350 bps, helping Beiersdorf to stabilize its capital expenditures at 4% of group sales, EUR 250 - 350 million per year (2019 - 2023) (Figure 9). Lastly, the new strategy should enable Beiersdorf’s Consumer segment to steadily decrease its working capital until 2023 by more than 50 bps per year. Currently, working capital in the Consumer segment amounts to 9.9% of Consumer sales (Figure 10). For the tesa business, C.A.R.E.+ stipulates outperformance of the market by 2% per year and investments to build new capabilities and maintain the EBIT margin above 15%.
Future M&A deals are an important component of the C.A.R.E.+ strategy. With a new CEO as of 2019, Stefan de Loecker, EUR 4.4 bn net liquidity (Figure 11) and Beiersdorf’s most recent acquisition of Coppertone, one Source: Beiersdorf Equity Story
Figure 7: Consumer Growth Ambition
Source: Beiersdorf Equity Story Figure 8: Planned Margin
Evolution
Source: Beiersdorf Equity Story Figure 9: CAPEX in EUR million
and as % of Group Sales
Source: Beiersdorf Equity Story Figure 10: Working Capital as %
might come to think that the strategic direction regarding M&A of the company has changed already and will change further in the future. However, Beiersdorf’s controlling shareholder, the Herz family, has an emotional bond towards Beiersdorf and Hamburg and interferes with the management’s expansion plans.
Even though Beiersdorf’s last CEO, Stefan Heidenreich, recognized the necessity of acquisitions to expand and diversify the company's product offerings and had the means to do so, no acquisitions in the consumer segment were made during his tenure. “[The money] has to go back into the business, where it came from, including via acquisitions,'' Stefan Heidenreich said at the annual general meeting on April 4th, 2017. “[These acquisitions] cost very, very much money” (Reuters, 2017).
Beiersdorf’s new CEO was eager to pursue M&A targets but realized relatively quickly that this has already been the ambition of the management before. During a press conference in February 2019, he presented Beiersdorf’s new strategic direction (C.A.R.E.+) and identified M&A opportunities as key enabler for further growth in the dynamic consumer goods industry. According to his statement, the company has been actively looking for potential targets (Spiegel Online, 2019). During the same presentation, de Loecker admitted that his message regarding M&A activities is not that new (Beiersdorf AG, 2019, February 26).
Since a strong financial position seems to be the utmost goal for Beiersdorf, statements regarding future M&A activities are paired with assurance of financial health. “With net liquidity of EUR 4.4 billion and a robust balance sheet, we are able to comfortably shoulder the planned investment and growth plans under the C.A.R.E.+ program. We will no doubt maintain our traditionally high financial discipline” says Dessi Temperley, CFO of Beiersdorf (Beiersdorf AG, 2019, February 26).
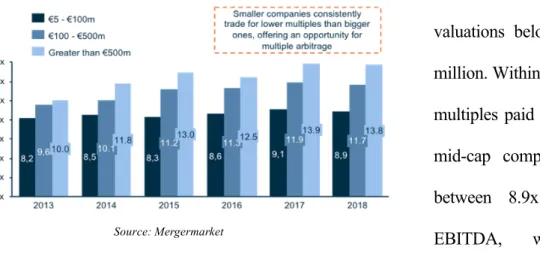
Furthermore, the acquisition multiples for smaller beauty and personal care brands have been climbing in recent years, exceeding what Beiersdorf is willing to spend. Peers like Unilever, L’Oreal, P&G and Estee Lauder recognize that these small companies are the main growth driver for incumbent consumer goods firms and compete for acquisitions, driving up multiples (Table 1). This limits Beiersdorf’s acquisition targets to under-invested brands, that can be bought for a good price and turned around, just like Coppertone. Whether Beiersdorf is able to turn around the company, which reported declining sales and decreasing market share for the past five years and is operating in a highly seasonal market, remains to be seen. Generally, one should remain sceptical with regards to the achievement of the highly optimistic C.A.R.E.+ goals.
Source: Beiersdorf Equity Story Figure 11: Net Liquidity Evolution (EUR million)
Skincare Asset Buyer Sales Multiple EBITDA Multiple Date
philosophy COTY 4.5x 12.5x Nov 10
GlamGlow Estee Lauder 3.5x n/a Dec 14
dermalogica Unilever 4.0x 13.3x Jun 15
Paula's Choice TA Associates (PE) 3.7x 14.3x Mar 16
Carver Korea Unilever 7.1x 16.6x Sep 17
First Aid Procter & Gamble 5.0x n/a Jul 18 Dr.Ci:Labo Johnson & Johnson 5.2x 25.6x Oct 18
Elemis L'Occitane 6.9x 26.6x Jan 19
Tatcha Unilever 7.1x n/a Jun 19
Source: S&P Capital IQ Table 1: Most Recent M&A
3. Market Analysis
Beiersdorf is operating in two main industries, the Beauty and Personal Care market as well as the Adhesive Technologies market. Over the past five years (2014 - 2018) the global market volume of beauty and personal care products has been growing moderately at a CAGR of 2.90% (Euromonitor International, 2019), while the global adhesive technologies market has exhibited much faster growth at a CAGR of 4.4% (Adhesive & Sealants Industry, 2018).
3.1. Beauty and Personal Care
The beauty and personal care market belongs to the overall Consumer Goods industry and ranks sixth in market volume after among others Packaged Goods (> EUR 2 tn in 2018), Apparel and Footwear (> EUR 1,5 tn), and Home and Garden (> EUR 1 tn) (Figure 12). In 2018, the global
beauty and personal care market reached a volume of EUR 414 bn1
(Euromonitor International, 2019). Current figures show that the market
further grew in 2019, potentially reaching a market value of EUR 437 bn1
(+ 5.57 % y-o-y growth) at the end of the year (Euromonitor International, 2019). The market is characterized by ongoing innovations and continuous changes in consumer preferences. In recent years, especially the importance of social media and digital-native beauty brands, the rise of e-Commerce as well as the increasing level of disposable income worldwide let the industry thrive (Euromonitor International, 2019; Statista Consumer Market Outlook, 2019).
The increasing importance of e-Commerce channels has fundamentally disrupted the traditional way of trading goods and led to a shift in the retail landscape. Of the global population, 51% shop online on a regular basis (Statista Consumer Market Outlook, 2019, p.24). The e-Commerce share of global retail sales grew from 7.40% in 2015 to 12.20% in 2018 (CAGR of 13.31%) (Figure 13). The penetration of online sales is expected to continue in the future with the e-Commerce share reaching 22.00% in 2023 (eMarketer, 2019). According to Statista’s Digital Market Outlook, the more generic a product is, the greater the willingness of consumers to buy that product online instead of in a retail store (Statista, 2017). Therefore, beauty and personal care products are particularly suitable for e-Commerce. The share of e-Commerce sales in the global beauty and personal care market amounted to more than 15% in 2018 (Statista Consumer Market Outlook, 2019).
1 y-o-y exchange rate (USD / EUR) according to Euromonitor International
0 500 1.000 1.500 2.000 Pack aged Food Appa rel a nd F ootw ear Hom e and Gar den Alco holic Drin ks Soft Drin ks Beau ty an d Per sona l Car e Cons umer App lianc es Toys and Gam es Tissu es a nd H ygie ne Hom e Car e Hot D rinks Pet C are
Source: Euromonitor International, 2019 Figure 12: Consumer Goods Industry (Size in USD billion)
0% 5% 10% 15% 20% 25% 0.000 1.000 2.000 3.000 4.000 5.000 6.000 7.000 2015 2016 2017 2018 2019 2020* 2021* 2022* 2023* Sal es Share of global retail sales
Source: eMarketer, 2019 Figure 13: Retail e-Commerce
Asia is the largest region regarding internet retailing of beauty and personal care products (Statista Consumer Market Outlook, 2019) (Figure 14). The growth is mainly driven by the aggressive expansion of internet giants like JD.com or Alibaba and a continuously urbanising millennial population in e-Commerce markets like China, South Korea and India.
The total beauty and personal care market can be divided into four main segments: skin care, personal care, cosmetics and fragrances. Among the four, the personal care segment made up the largest share with 44% of total market volume in 2018 (Figure 15) (Statista Consumer Market Outlook, 2019). The cosmetics segment, one of the fastest growing segments, is expected to grow at a 5-year CAGR of 4.33% until 2023 (Euromonitor International, 2019). Most of the growth in this segment comes from the increasing demand for premium cosmetics. Between 2014 and 2019, the premium segment grew annually by an average rate of 6.17%, accounting for nearly 40% of the total growth in this market segment (Figure 16) (Coresight Research, 2019). Current data shows that the market is expected to grow by 7.74% in 2019 (Euromonitor International, 2019). The increasing demand for luxury cosmetics compared to mass-market beauty labels is among others propelled by rising-middle class population, growth of the high-income class especially in Asia and increasing female working population (Arienti, 2019; Thorat, Bhandalkar & Deshmukh, 2019). Furthermore, the advancing consciousness about personal appearance in Asian Pacific countries such as China and Japan, is contributing to the growth of premium cosmetics (Statista Consumer Market Outlook, 2019).
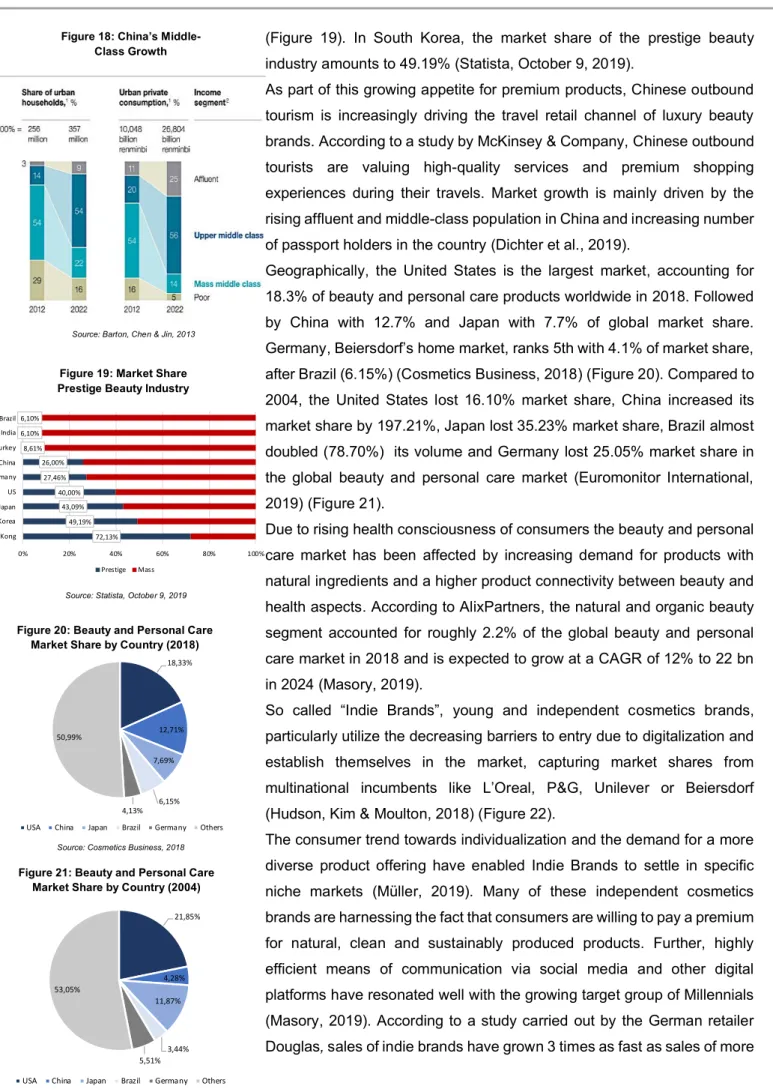
Generally, a shift towards premiumisation in the overall beauty and personal care market (not only cosmetics) can be identified. The market volume of premium products grew faster than the market volume of mass market products from 2014 onwards. Figure 17 shows that the growth gap is expected to diminish in the future (Euromonitor International, 2019). This might be due to the change in perception of premium. Mass brands, by focusing on health aspects and ethical claims, are likely to be perceived as premium brands in a different way. The largest consumer group of premium beauty products are Chinese (Statista Consumer Market Outlook, 2019), resulting from the enormous upper middle-class growth in the past years (Figure 18) (Barton, Chen & Jin, 2013).
The shift from mass market labels to premium beauty products has been enormous in most Asian Pacific countries. In 2019, the prestige beauty industry in Hong Kong accounts for 72.13% of the total beauty market
Cosmetics 18% Skin Care 27% Personal Care 44% Fragrances 11%
Figure 15: Worldwide Revenue Share by Product Category
(2018)
Source: Statista Consumer Market Outlook, 2019
0% 1% 2% 3% 4% 5% 6% 7% 8% 2014 2015 2016 2017 2018 2019
Figure 16: Annual Growth Prestige Beauty Industry
Source: Coresight Research, 2019
-3% -1% 1% 3% 5% 7% 9% 11% 13% 15% 2010 2012 2014 2016 2018 2020 2022 Mass Premi um
Figure 17: Annual Growth Prestige Beauty Industry vs. Mass Market
labels
Source: Euromonitor International, 2019 Figure 14: Beauty and Personal
Care Online Share
Source: Statista Consumer Market Outlook, 2019
15% 16% 18% 19% 19% 20% 20% 8% 9% 10% 11% 11% 12% 12% 2017 2018 2019 2020 2021 2022 2023 Asia Europe
(Figure 19). In South Korea, the market share of the prestige beauty industry amounts to 49.19% (Statista, October 9, 2019).
As part of this growing appetite for premium products, Chinese outbound tourism is increasingly driving the travel retail channel of luxury beauty brands. According to a study by McKinsey & Company, Chinese outbound tourists are valuing high-quality services and premium shopping experiences during their travels. Market growth is mainly driven by the rising affluent and middle-class population in China and increasing number of passport holders in the country (Dichter et al., 2019).
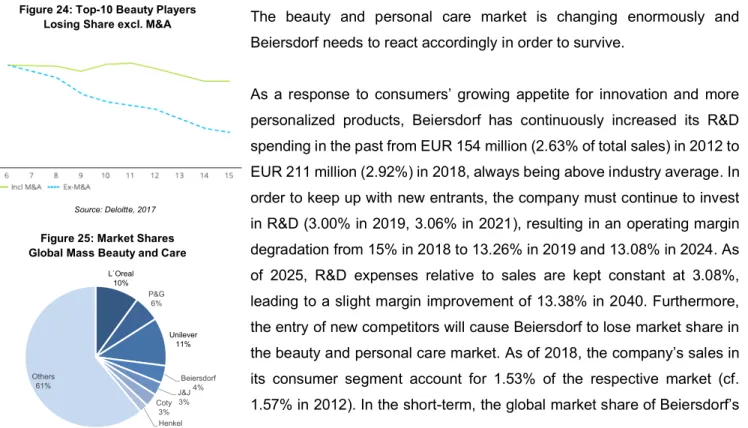
Geographically, the United States is the largest market, accounting for 18.3% of beauty and personal care products worldwide in 2018. Followed by China with 12.7% and Japan with 7.7% of global market share. Germany, Beiersdorf’s home market, ranks 5th with 4.1% of market share,
after Brazil (6.15%) (Cosmetics Business, 2018) (Figure 20).Compared to
2004, the United States lost 16.10% market share, China increased its market share by 197.21%, Japan lost 35.23% market share, Brazil almost doubled (78.70%) its volume and Germany lost 25.05% market share in the global beauty and personal care market (Euromonitor International, 2019) (Figure 21).
Due to rising health consciousness of consumers the beauty and personal care market has been affected by increasing demand for products with natural ingredients and a higher product connectivity between beauty and health aspects. According to AlixPartners, the natural and organic beauty segment accounted for roughly 2.2% of the global beauty and personal care market in 2018 and is expected to grow at a CAGR of 12% to 22 bn in 2024 (Masory, 2019).
So called “Indie Brands”, young and independent cosmetics brands, particularly utilize the decreasing barriers to entry due to digitalization and establish themselves in the market, capturing market shares from multinational incumbents like L’Oreal, P&G, Unilever or Beiersdorf (Hudson, Kim & Moulton, 2018) (Figure 22).
The consumer trend towards individualization and the demand for a more diverse product offering have enabled Indie Brands to settle in specific niche markets (Müller, 2019). Many of these independent cosmetics brands are harnessing the fact that consumers are willing to pay a premium for natural, clean and sustainably produced products. Further, highly efficient means of communication via social media and other digital platforms have resonated well with the growing target group of Millennials (Masory, 2019). According to a study carried out by the German retailer Douglas, sales of indie brands have grown 3 times as fast as sales of more Figure 18: China’s
Middle-Class Growth
Source: Barton, Chen & Jin, 2013
72,13% 49,19% 43,09% 40,00% 27,46% 26,00% 8,61% 6,10% 6,10% 0% 20% 40% 60% 80% 100% Hong Kong South Korea Japan US Germany China Turkey India Brazil Prestige Mass
Figure 19: Market Share Prestige Beauty Industry
Source: Statista, October 9, 2019
18,33% 12,71% 7,69% 6,15% 4,13% 50,99%
USA China Japan Brazil Germany Others
Figure 20: Beauty and Personal Care Market Share by Country (2018)
Source: Cosmetics Business, 2018
21,85% 4,28% 11,87% 3,44% 5,51% 53,05%
USA China Japan Brazil Germany Others
Figure 21: Beauty and Personal Care Market Share by Country (2004)
established brands since 2012 (Müller, 2019). Especially in the skin care segment, a clear shift towards higher health awareness and consequently towards derma cosmetics can be detected in recent years (Euromonitor International, 2018) (Figure 23).
In past years many leading beauty and personal care players have increasingly engaged in M&A activity to seek new customers, enter new markets or develop innovative strategies or products. Since sources of organic growth seem to be gradually exhausted or exclusively available to smaller players, large manufacturers increasingly rely on acquisitions for future growth (Figure 24). Several Indie brands have already joined large corporations. Estée Lauder bought the makeup brand Too Faced (2016), while the brands Dermalogica and Hourglass now belong to Unilever (2015 and 2017, respectively). Colgate acquired the French premium care manufacturer Laboratoires Filorga Cosmetiques for an estimated purchase price of USD 1,7 billion in July 2019 (Estee Lauder, 2016; Unilever, 2015; Unilever, 2017, June 19; Faucher & Spiller, 2019).
In the beauty and personal care market, Beiersdorf is facing fierce competition from large multinational players, offering mass-market cosmetics brands. According to Euromonitor International (2019), nearly 40% of the global beauty and personal care market is occupied by 7 major players, among them Unilever, L’Oreal and Procter & Gamble (Figure 25).
3.1.1. Value Drivers
The beauty and personal care market is changing enormously and Beiersdorf needs to react accordingly in order to survive.
As a response to consumers’ growing appetite for innovation and more personalized products, Beiersdorf has continuously increased its R&D spending in the past from EUR 154 million (2.63% of total sales) in 2012 to EUR 211 million (2.92%) in 2018, always being above industry average. In order to keep up with new entrants, the company must continue to invest in R&D (3.00% in 2019, 3.06% in 2021), resulting in an operating margin degradation from 15% in 2018 to 13.26% in 2019 and 13.08% in 2024. As of 2025, R&D expenses relative to sales are kept constant at 3.08%, leading to a slight margin improvement of 13.38% in 2040. Furthermore, the entry of new competitors will cause Beiersdorf to lose market share in the beauty and personal care market. As of 2018, the company’s sales in its consumer segment account for 1.53% of the respective market (cf. 1.57% in 2012). In the short-term, the global market share of Beiersdorf’s Figure 24: Top-10 Beauty Players
Losing Share excl. M&A
Source: Deloitte, 2017 Figure 22: Growth of Challenger /
Indie Brands
Source: Hudson, Kim & Moulton, 2018 25 18 24 39 11 16 26 2 6 10
2008 2016 Global Market S hare % Other Legacy Mass Legacy Pr estige Challenger
Figure 23: Total Global Sales from 2007 to 2022e (USD billion)
Source: Euromonitor International, 2018
L`Oreal 10% P&G 6% Unilever 11% Beiersdorf 4% J&J 3% Coty 3% Henkel 2% Others 61%
Figure 25: Market Shares Global Mass Beauty and Care
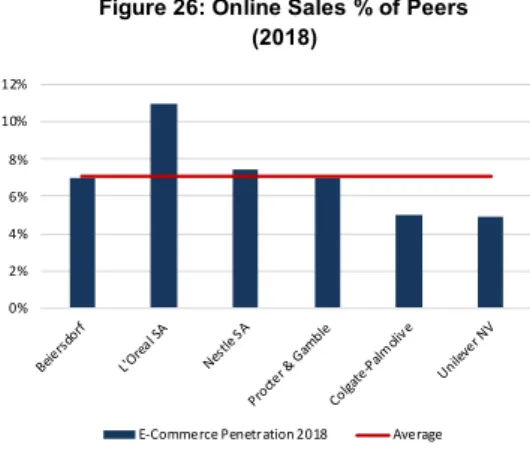
consumer segment is expected to decrease by up to 0.03% in 2025. From there onwards, market share is expected to increase until 2040 to 1.52%. As mentioned above, consumers are willing to pay a premium for natural and clean beauty products. In this context Eucerin belongs to the top brands in the derma cosmetics segment. The newly launched Eucerin Anti-Pigment hyperpigmentation product range is based on Thiamidol, an anti-pigment ingredient developed and patented by Beiersdorf. Since Eucerin products are sold at higher prices than products from other Beiersdorf brands (e.g. Nivea), this product series will contribute to a gross margin improvement in the long run from 57.49% in 2018 to 58.08% as of 2033. Beiersdorf has doubled its online share during the past five years, reaching 7% of total sales in 2018, the industry average (Figure 26). In the coming five years the company aims to double its online share again, reaching 14% in 2023. To achieve the online sales target, Beiersdorf needs to invest heavily in digital marketing to promote its e-Commerce channels. When analysing spending on digital marketing as a percentage of total marketing expenses, one finds Beiersdorf significantly under-indexed, compared to its industry peers with only 25% allocated to digital marketing (Table 2). The C.A.R.E.+ strategy provides elevated spending on digital marketing, reaching 50% of marketing spend in the next couple of years (J. Geissler, personal communication, December 20, 2019). Whether the company achieves this ambitious goal remains doubtful. However, Beiersdorf is expected to increase its spending on digital marketing anyhow and hence gain market share in the Asia / Africa / Australia region through penetration of the fast-growing e-Commerce channel.
Beiersdorf’s luxury skin care brand LaPrairie is serving the growing premium beauty market successfully, with sales growing much faster than the industry (Figure 27). Most of Beiersdorf’s past revenue growth was attributable to the LaPrairie brand. The past growth of LaPrairie’s sales cannot be expected to be sustainable and continue at the same level in the future. Therefore, Beiersdorf needs to focus not only on the global luxury cosmetics market but also more intensively on the growing Chinese travel retail channel (Figure 28 and 29). Even though it is implausible to assume that LaPrairie’s growth rates can be sustained at its current level for long, the focus on the Chinese travel retail market will contribute to market share gain in the Asia / Africa / Australia region.
As seen before, sources of organic growth for incumbents like Beiersdorf are exhausted. Stefan De Loecker takes a clear stand on this matter,
Company Digital marketing %
L’Oreal 47%
Procter & Gamble 42%
Unilever 40% Reckitt Benckiser 40% Beiersdorf 25% 0% 2% 4% 6% 8% 10% 12% Beie rsdo rf L'Ore al SA Nest le SA Proc ter & Gam ble Colga te-P almoli ve Unile ver N V
E-Commerce Penetration 2018 Average
Figure 26: Online Sales % of Peers (2018)
Source: Company Information Table 2: Allocation of Marketing Spend to Digital Marketing (2018)
Source: Company Information
Figure 27: Organic Sales Growth Consumer Segment vs. LaPrairie vs. Market
Source: BEI Annual Report 0% 5% 10% 15% 20% 25% 30% 35% 40% 2014 2015 2016 2017 2018 Q3 2019
Consumer segment La Prairi e Prestige beauty industry
242 237 250
277 295
315
2015 2016 2017 2018 2019 2020
Source: Dichter et al., 2018 Figure 28: Chinese Outbound Trip
pointing out that strategic acquisitions are a key source of future growth (Spiegel Online, 2019). This is evident in Beiersdorf’s recent acquisition of Coppertone for EUR 550 million (2.6x FY18 sales). The strategic acquisition should help Beiersdorf to build scale in the underpenetrated North American sun care market, results have not been quantified yet. With a net cash balance of 22.7% Beiersdorf has the highest liquidity among its peers (Figure 30). Thus, the company is in a good financial position for further acquisitions in order to gain market share in underserved regions.
3.2. Adhesive Technologies
Tesa SE, a wholly owned subsidiary of Beiersdorf, manufactures adhesive tapes and self-adhesive solutions for direct industries, selling directly to industrial clients as well as trade markets, where tesa supplies consumers and craftsmen via DIY stores, superstores and other retail-like partners. Tesa supplies industrial customers from the automotive industry, the electronics sector (e.g. smartphones and tablets), the building and construction industry and from the printing and paper industry (Tesa SE, 2018). The demand for adhesives is increasing due to the various areas of application in different industries. For example, the use of adhesives in the manufacturing of cars and aircrafts is growing due to the weight reduction compared to screws, rivets and other connecting pieces as well as fuel efficiency advantages.
The recent decline in vehicle production due to the difficult situation in the automotive industry had a negative impact on tesa’s sales, as the current figures from Beiersdorf reveal. Even though industry experts expect the lean period to continue for several years, Beiersdorf's new CEO believes that there are several opportunities in the automotive industry for tesa. For example, the production and use of electric cars is increasing in the future (Hamburger Abendblatt, 2019) (Figure 31). For batteries, motors and other components of electric cars, special adhesives are needed, which tesa as a manufacturer has to offer.
The consumer electronics market has been growing continuously since 2014 and is expected to further do so in the future (Figure 32). The emerging segments, including wearables such as fitness trackers and smart watches, are more dynamic and allow for new market participants and innovative products or features.
The paper and printing industry, especially magazines, has been declining in the past, mainly due to ongoing digitalization. The packaging segment,
37,60
16,50
4,40
Asia Europe North America
Worldwide No. Battery Electric Vehicles 2018 3,29 57
117
160
2010 2015 2020e
Source: Dichter et al., 2018
Figure 29: Number of China’s Outbound Trips (million) 22,7% 18,9% 14,2%13,6% 9,8% 9,8% 9,6% 8,8% 8,4% 7,5% 7,1% 4,4% 3,2% 2,7% 2,0% Beie rsdo rf Este e La uder Avon Kao P&G J&J Shise ido Henk el L'Ore al Unile ver Colga te RB Clor ox Essit y Coty
Figure 30: Cash Balance of Beiersdorf’s Peer Group
Source: Company Information
Source: IHS Markit, 2018
Figure 31: Electric Vehicles Production in 2030 by Region (million units)
Figure 32: Industry Revenue of “Manufacturing” in China (USD billion)
however, has been positively affected by a general increase in purchasing power and rising e-Commerce sales figures (Reports and Data, 2019). The global construction industry showed a positive development in the past, affected by increasing household income. Especially, the demand for prefabricated construction solutions, for which adhesive tapes are used, has been increasing due to the shortage of construction workers (Smithers, 2019) (Figure 33).
On a global scale the market for adhesive technologies is expected to grow by 62.68% from 2016 to 2025, reaching a market value of USD 55.8 bn in 2025 (Adhesives & Sealants Industry, 2018) (Figure 34). In terms of geography, the Asian Pacific region is projected to deliver the highest revenue growth at a CAGR of above 7% from 2019 to 2025. The main growth drivers in Asia are the growing manufacturing sector and strong GDP growth. The demand for adhesives and sealants in Asia Pacific is expected to reach 10.7 million metric tons in 2019, representing by far the largest market (Adhesives & Sealants Industry, 2016) (Figure 35). By setting up its new Chinese manufacturing facilities in Suzhou (close to Shanghai), which will start production in 2020, tesa is already investing heavily into its further penetration in Asia’s growing market (Fingerhut, 2019). Being closer to the global hub of consumer- and automotive electronics manufacturing will help tesa to better serve the demand with local producers and increase its market share in the Asian region. The second largest market for adhesives and sealants is North America, reaching a demand of 3,570 thousand metric tons in 2019, followed by Western Europe with a demand of 3,090 thousand metric tons in 2019 (Adhesives & Sealants Industry, 2016) (Figure 35).
3.2.1. Value Drivers
In the coming years, the biggest growth opportunities for the application area of adhesives and sealants are in the building and construction industry. As mentioned above, the use of adhesives and sealants in this segment has increased tremendously in the past years and will continue to do so in the future. Today, adhesives and sealants are important components of many building complexes and as the construction industry is expected to be characterised by innovative, fast and sustainable construction forms in the future, new areas of application for adhesives will be created. According to Smithers, the global adhesives and sealants market in the building and construction industry is expected to reach a value of EUR 12.33 bn in 2023, representing significant growth
2.839 2.600 5.739 599 710 573 3.102 2.738 8.010 701 840 754 3.570 3.090 10.650 838 1.025 977 0 2.000 4.000 6.000 8.000 10.000 12.000 North America Western Europe Asia-Pacific Central & South America Eastern Europe Africa/Mideast
Demand in thousand metric tons 2019 2014 2009
Source: Adhesives & Sealants Industry, 2016 Figure 35: Adhesives and Sealant Demand
by Region (2009-2019) Figure 34: Global Market Value of
Adhesives (USD billion)
Source: Adhesives & Sealants Industry, 2018 Figure 33: Adhesives and Sealants for
Construction by Value (USD million)
opportunities for adhesives and sealants companies like tesa (Smithers, 2019).
Another significant growth driver for adhesive companies is the increasing demand for bio-based and recycled adhesives, fuelled by growing environmental consciousness. The use of bio-based adhesives is not limited to a single end-user industry but can rather be applied in various industries, such as building and construction, paper and packaging, healthcare and personal care.
The global bio-based adhesives market is expected to grow at a CAGR of 10% from 2019 to 2024 (Figure 36) (Businesswire, 2019). While Europe and North America account for the highest demand for bio-based adhesives, the biggest future growth in this segment is projected to come from the Asian region, due to health awareness and technological developments especially in China and Japan.
As mentioned above, the packaging industry is currently exhibiting enormous growth due to the rise of online sales. In this industry, bio-based adhesives can be applied from box construction and lamination to packaging materials used for all types of products. In the past years tesa has invested into sustainable manufacturing and environmentally friendly products. With the “EcoLogo”-range tesa represents one of the first adhesives manufacturers to constantly introduce innovative adhesives made from recycled or bio-based materials, moving away from the use of synthetics (Figure 37).
4. Valuation
4.1. Financials
4.1.1. Revenues
In the financial year 2018, Beiersdorf continued the growth trend of recent years, reaching a historical revenue record at Group level of EUR 7,233 million, which is equitable to a YoY-growth rate of +2.51% (Figure 38). When looking at the two business segments separately, revenues in both segments have been steadily increasing since 2012. Especially tesa’s sales have been growing rapidly at a CAGR of 4.44% from 2012 (EUR 992 million) to 2018 (EUR 1,344 million), driven by the internal innovation initiative (organic growth) as well as increased M&A activity in recent years Only in 2018, tesa successfully acquired the Twinlock division of
5.048 5.103 5.209 5.546 5.606 5.799 5.889 992 1.038 1.076 1.140 1.146 1.257 1.344 0 1.000 2.000 3.000 4.000 5.000 6.000 7.000 2012 2013 2014 2015 2016 2017 2018
Total Consumer Sales Total tesa Sales Source: BEI Annual Report
Figure 38: Sales Development Beiersdorf 2012 – 2018 (EUR million)
Source: Businesswire, 2019 Figure 36: Global Market Value of
Bio-Adhesives (USD billion)
Source: tesa Website
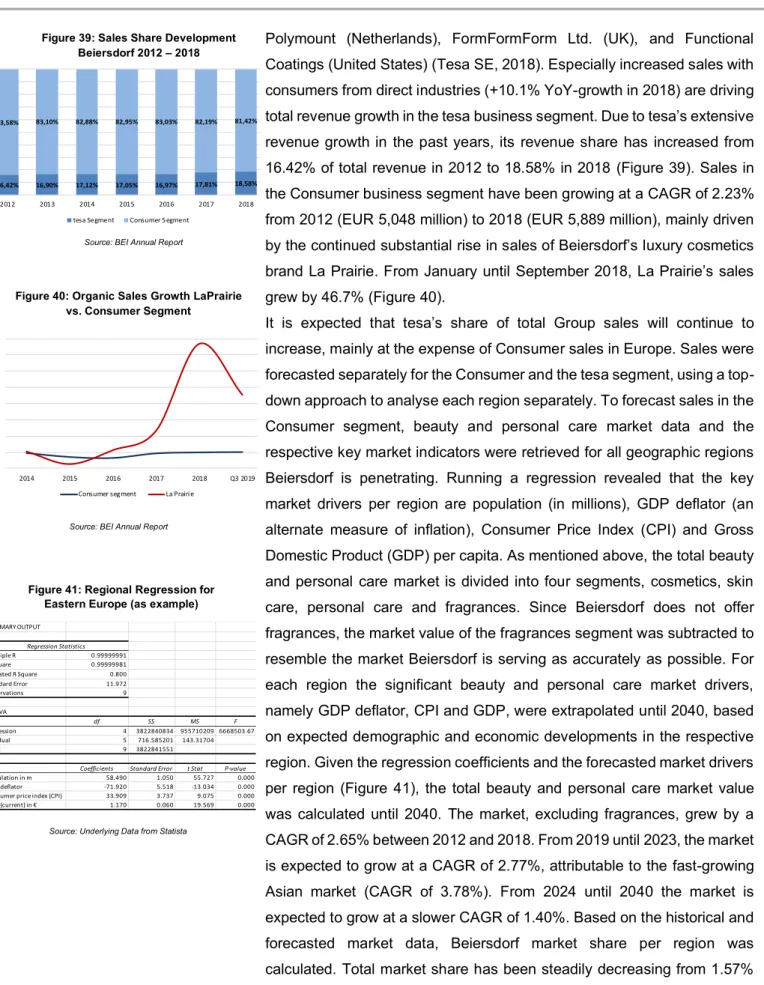
Polymount (Netherlands), FormFormForm Ltd. (UK), and Functional Coatings (United States) (Tesa SE, 2018). Especially increased sales with consumers from direct industries (+10.1% YoY-growth in 2018) are driving total revenue growth in the tesa business segment. Due to tesa’s extensive revenue growth in the past years, its revenue share has increased from 16.42% of total revenue in 2012 to 18.58% in 2018 (Figure 39). Sales in the Consumer business segment have been growing at a CAGR of 2.23% from 2012 (EUR 5,048 million) to 2018 (EUR 5,889 million), mainly driven by the continued substantial rise in sales of Beiersdorf’s luxury cosmetics brand La Prairie. From January until September 2018, La Prairie’s sales grew by 46.7% (Figure 40).
It is expected that tesa’s share of total Group sales will continue to increase, mainly at the expense of Consumer sales in Europe. Sales were forecasted separately for the Consumer and the tesa segment, using a top-down approach to analyse each region separately. To forecast sales in the Consumer segment, beauty and personal care market data and the respective key market indicators were retrieved for all geographic regions Beiersdorf is penetrating. Running a regression revealed that the key market drivers per region are population (in millions), GDP deflator (an alternate measure of inflation), Consumer Price Index (CPI) and Gross Domestic Product (GDP) per capita. As mentioned above, the total beauty and personal care market is divided into four segments, cosmetics, skin care, personal care and fragrances. Since Beiersdorf does not offer fragrances, the market value of the fragrances segment was subtracted to resemble the market Beiersdorf is serving as accurately as possible. For each region the significant beauty and personal care market drivers, namely GDP deflator, CPI and GDP, were extrapolated until 2040, based on expected demographic and economic developments in the respective region. Given the regression coefficients and the forecasted market drivers per region (Figure 41), the total beauty and personal care market value was calculated until 2040. The market, excluding fragrances, grew by a CAGR of 2.65% between 2012 and 2018. From 2019 until 2023, the market is expected to grow at a CAGR of 2.77%, attributable to the fast-growing Asian market (CAGR of 3.78%). From 2024 until 2040 the market is expected to grow at a slower CAGR of 1.40%. Based on the historical and forecasted market data, Beiersdorf market share per region was calculated. Total market share has been steadily decreasing from 1.57% in 2012 to 1.53% in 2018 (CAGR -0.42%). Most of the market share was lost in Latin America (CAGR of -4.19%). Since this sharp drop in market share is resulting from negative exchange rate effects, the negative
16,42% 16,90% 17,12% 17,05% 16,97% 17,81% 18,58%
83,58% 83,10% 82,88% 82,95% 83,03% 82,19% 81,42%
2012 2013 2014 2015 2016 2017 2018
tesa Segment Consumer S egment Source: BEI Annual Report
Figure 39: Sales Share Development Beiersdorf 2012 – 2018 0% 5% 10% 15% 20% 25% 30% 35% 40% 2014 2015 2016 2017 2018 Q3 2019
Consumer segment La Prairi e
Source: BEI Annual Report
Figure 40: Organic Sales Growth LaPrairie vs. Consumer Segment SUMMARY OUTPUT Regression Statistics Multiple R 0.99999991 R Square 0.99999981 Adjusted R Square 0.800 Standard Error 11.972 Observations 9 ANOVA df SS MS F Regression 4 3822840834 955710209 6668503.67 Residual 5 716.585201 143.31704 Total 9 3822841551
Coefficients Standard Error t Stat P-value
Population in m 58.490 1.050 55.727 0.000 GDP deflator -71.920 5.518 -13.034 0.000 Consumer price index (CPI) 33.909 3.737 9.075 0.000 GDP (current) in € 1.170 0.060 19.569 0.000
Source: Underlying Data from Statista Figure 41: Regional Regression for
development in this region is not expected to continue in the future. Generally, since the market is being disrupted by small, innovative and digital-native beauty and personal care companies, Beiersdorf will continue to lose market share. In 2040, Beiersdorf’s total market share is estimated at 1.51%, hence decreasing at a CAGR of -0.05% from 2019 to 2040 (Figure 42). The company is forfeiting most of its market share from 2019 to 2040 in Eastern Europe (CAGR of -0.51% from 3.36% to 3.00%), reaching a steady state in 2032, followed by a decreasing market share at -0.48% CAGR in the fast growing Latin American beauty and personal care market (from 1.96% to 1.77%). It is anticipated that Beiersdorf will gain market share in North America (+0.37 CAGR), driven by the acquisition of Coppertone, and Asia (+0.55% CAGR), driven by the expected penetration of developing markets (Figure 43). By projecting the total relevant beauty and personal care market value and Beiersdorf’s market share per region, revenues of the Consumer segments were derived. Beiersdorf total consumer sales are expected to increase at a moderate CAGR of 1.83% from 2019 (EUR 6,067 million) to 2040 (EUR 9,051 million), a decrease compared to the past 7-year CAGR of 2.23%.
Due to limited resources, no market data for the global adhesives technologies and sealants market could be retrieved. Based on the identified value drivers (see 3.2.1.), future revenue growth rates per region for the tesa segment were estimated. The tesa segment exhibited high top-line growth in the last 7 years. Revenues increased at a CAGR of 4.43% and an average YoY-growth rate of 5.23%. It is expected that tesa’s sales continue to grow at a CAGR of 2.36% from EUR 1,419 million in 2019 to EUR 2,369 million in 2040 (avg. YoY-growth rate of 2.61%) (Figure 44), resulting in a share of total sales increase from 18.95% (2019) to 20.75% (2040). Most of tesa’s sales growth is expected to come from sales in Africa/Asia/Australia with a CAGR of +3.74%, a significant decrease compared to the past 7-year CAGR of +7.06%. Sales in the Americas are expected to grow moderately at a CAGR of +2.97%. The European market for adhesives technologies and sealants does not provide comparable growth opportunities for tesa. Hence, sales in this region are only expected to grow at a CAGR of 1.10% from 2019 (EUR 755 million) until 2024 (EUR 960 million).
Combined, the Beiersdorf Group is continuing the positive top-line growth of the past years at a slowing rate. Group sales are expected to increase from EUR 7,486 million in 2019 to EUR 11,420 million 2040, corresponding to a CAGR of +1.94%, a moderate decrease compared to the past 7-year
1,53% 1,52% 1,52% 1,51% 1,51% 1,51% 1,50% 1,50% 1,52% 1,40% 1,45% 1,50% 1,55% 1,60% 0 1 2 3 4 5 6 7 8 9 2018 2019 FC 2020 FC 2021 FC 2022 FC 2023 FC 2024 FC 2025 FC 2040 FC Europe Americas A/A/A Market Share
Source: Own Forecast
Figure 42: Sales Forecast for Beiersdorf’s Consumer Segment (EUR billion)
5,56% 4,64% 4,05% 3,54% 3,06% 2,59% 2,48% 2,15% 0,00% 1,00% 2,00% 3,00% 4,00% 5,00% 6,00% 0,0 0,5 1,0 1,5 2,0 2,5 2018 2019 FC 2020 FC 2021 FC 2022 FC 2023 FC 2024 FC 2025 FC 2040 FC
Europe Americas A/A/A Growth
Source: Own Forecast
Figure 44: Sales Forecast (EUR billion) and y-o-y Sales Growth - tesa
3,39% 3,36% 3,33% 3,30% 3,27% 3,24% 3,21% 3,18% 3,00% 3,09% 3,09% 3,08% 3,07% 3,07% 3,06% 3,06% 3,05% 3,05% 0,58% 0,58% 0,58% 0,59% 0,59% 0,59% 0,60% 0,60% 0,63% 1,98% 1,98% 1,98% 1,98% 1,98% 1,98% 1,98% 1,98% 1,98% 1,02% 1,03% 1,04% 1,05% 1,06% 1,06% 1,07% 1,08% 1,17% 2018 2019 FC 2020 FC 2021 FC 2022 FC 2023 FC 2024 FC 2025 FC 2040 FC Eastern Europe Western Europe North Ameri ca Latin America A / A / A
Figure 43: Regional Market Share Development – Consumer Segment
CAGR of +2.61%. Generally, Beiersdorf’s geographical focus, both in the Consumer and the tesa segment, is shifting from mature and saturated markets towards emerging markets. This shift has become evident in recent years and will continue in the future. The Asian/African/Australian market is expected to replace Europe as the largest market for Beiersdorf in 2040, representing 41.66% of total sales, while sales in Europe decrease from 49.26% (2019) to 40.88% (2040) of total sales (Figure 45).
4.1.2. Cost of Goods Sold
Costs of Goods Sold (COGS) are primarily attributable to internally produced goods (material, direct labour, energy) and capture a large portion of expenditures as Beiersdorf’s products are mainly manufactured internally. At Group level, COGS grew from 36.87% (EUR 2,077 million) in 2011 to 42.51% (EUR 3,075 million) of revenues in 2018, because as of 2014 direct expenses for distribution logistics were reclassified from Marketing & Selling expenses to COGS in the Consumer segment. Moreover, the relocation of tesa’s headquarters and production facilities led to a further increase in COGS from 2015 onwards (Figure 46).
In 2018, Beiersdorf reported a Gross Margin of 57.49%, corresponding to a Gross Profit of EUR 4,158 million. Due to the relative increase in COGS, gross margin has been decreasing from 2011 (63.13%) to 2018 (57.49%). The decrease in gross margin is most visible in the Consumer segment, with a decrease of 663 bps from 2011 (66.99%) to 2018 (60.37%). As mentioned above, one of the main growth drivers in the Consumer segment is the extensive sales growth of Beiersdorf’s luxurious cosmetics brand La Prairie. Premium cosmetics are less price sensitive than mass-market labels and hence have higher margins. Since La Prairie’s growth period is expected to continue in the future and the newly launched Eucerin anti-pigment series is sold at higher prices as well, gross margin in the consumer segment will slowly increase, positively affecting the Group’s gross margin from 2019 (57.39%) to 2040 (58.08%).
4.1.3. Operating Result
Analogous to the steady growth in sales, the Group-EBIT increased simultaneously with a CAGR of 12.39% from 2011 (EUR 431 million) to 2018 (EUR 1,097 million). Thereby, Beiersdorf managed to improve its operating margin from 11.36% (2012) to 15.0% (2018), mainly coming from margin expansion in the Consumer segment from 11.43% in 2011 to 15.04% in 2018. Consumer operating margin is slowly converging to industry levels (L’Oreal: 2018 Operating Margin of 18.3%; Procter &
51% 49% 49% 49% 48% 47% 47% 46% 41%
17,5% 17,9% 17,9% 17,6% 17,7% 17,7% 17,7% 17,7% 17,9% 31,7% 32,9% 33,5% 33,5% 34,2% 35,0% 35,6% 36,2% 41,2%
2018 2019 FC 2020 FC 2021 FC 2022 FC 2023 FC 2024 FC 2025 FC 2040 FC Europe Americas A/A/A
Source: Own Forecast Figure 45: Regional Sales Share
Development Group Level
54,8% 52,7% 47,7% 46,7% 46,5% 45,9% 45,0% 36,7% 36,7% 42,5% 41,7% 41,1% 41,2% 42,5% 25% 30% 35% 40% 45% 50% 55% 60% 5.400 5.600 5.800 6.000 6.200 6.400 6.600 6.800 7.000 7.200 7.400 2012 2013 2014 2015 2016 2017 2018
Total Revenue OPEX % of Sales COGS % of Sales Source: BEI Annual Report
Figure 46: Cost Development at Group Level (EUR million)
32,3% 32,9% 33,3% 33,4% 33,5% 33,6% 33,6% 33,6% 33,6% 2,9% 3,0% 3,0% 3,1% 3,1% 3,1% 3,1% 3,1% 3,1% 0,00% 5,00% 10,00% 15,00% 20,00% 25,00% 30,00% 35,00% 40,00% 45,00% 50,00% 0 2.000 4.000 6.000 8.000 10.000 12.000 2018 2019 FC 2020 FC 2021 FC 2022 FC 2023 FC 2024 FC 2025 FC 2040 FC Sal es Marketing Expenses R&D Expenses
Source: Own Forecast
Figure 47: Future R&D and Marketing Spend Development (EUR million)
Gamble: 2018 Operating Margin of 20.5%). The operating margin improvement has been a consequence of cuts in marketing and selling expenses.
C.A.R.E.+ stipulates a margin expansion in the Consumer segment. Investors expected most of the incremental investment (EUR 70 - 80 million) to be allocated to marketing. However, Beiersdorf’s half year report reveals that marketing expenses as % of sales further decreased to 34.14% compared to the first 2 quarters of 2018 (34.54%). Further, profit margin decreased from 11.26% to 10.87%. Beiersdorf needs to increase operating expenditures in the future to achieve the C.A.R.E. + goals. Especially, marketing and selling as well as R&D expenses need to increase in the future (Figure 47). Given a long-term increase of marketing expenses as % of sales towards 33.59% (full-year basis) as of 2026, operating margin is decreasing and reaching a level of roughly 13.4% in the long-run (Figure 48). Profit margins, however, are increasing in the long run (Figure 49).
4.1.4. Financing Structure
The financing structure of Beiersdorf reveals its strong financing position. As of December 31, 2018, 63.66% of total assets were financed internally with equity (62.42% in 2017). Non-current liabilities (EUR 874 million) made up 9.85% (10.48% in 2017) of total assets. Current liabilities (EUR 2,350 million) made up the remaining 26.49% (27.06% in 2017) of Beiersdorf’s financing structure (Figure 50).
Interest-bearing liabilities, short-term bank loans, other short-term financial obligations and long-term financial liabilities, amount to only 0.94% (1.38% in 2017) of total equity and liabilities and substantiate Beiersdorf’s healthy financial position.
Furthermore, the company maintains a positive net liquidity position of EUR 4,402 million (EUR 4,189 million in 2017) (see Figure 11). While current liabilities to banks only amount to EUR 18 million (EUR 14 million in 2017), Beiersdorf reports cash, cash equivalents, long- and short-term securities of EUR 4,421 million (EUR 4,203 million). Thereby, cash and cash equivalents include bank balances and very short-term liquid investments (money market funds). Securities, amounting to EUR 3,502 million in 2018 (EUR 3,302 million in 2017) comprise listed government and corporate bonds, equities, and commercial papers.
Due to the high cash balance and large amount of securities, that the company reports as of December 31, 2018, Beiersdorf is (currently) not exposed to any liquidity risk.
64% 10%
26%
Equity Non-current liabilities Current liabilities
Figure 50: Beiersdorf’s Financing Structure in 2018
Source: BEI Annual Report 2018 10,06% 9,44% 10,51% 8,80% 9,00% 9,20% 9,40% 9,60% 9,80% 10,00% 10,20% 10,40% 10,60% 2018 2019 FC 2020 FC 2021 FC 2022 FC 2023 FC 2024 FC 2025 FC 2040 FC Source: Own Forecast
Figure 49: Future Profit Margin (Net Income / Sales) Development 15,0% 13,3% 13,2% 13,1% 13,1% 13,1% 13,1% 13,3% 13,4% 12,0% 12,5% 13,0% 13,5% 14,0% 14,5% 15,0% 15,5% 0 200 400 600 800 1.000 1.200 1.400 1.600 1.800 2018 2019 FC 2020 FC 2021 FC 2022 FC 2023 FC 2024 FC 2025 FC 2040 FC EBIT Operating Margin
Figure 48: Future Operating Margin Development (EUR million)
As a result of the implementation of IFRS 16 (as of January 1, 2019), lease expenses related to operating leases will be transferred from operating expenses to current (+ EUR 55 million) and non-current (+ EUR 123 million) financial liabilities, increasing financial debt in the long run. Hence, the debt to equity ratio will rise from 1.47% in 2018 to 4.99% in 2019 (Figure 51). Beiersdorf exercises the option not to recognize low-value and short-term leases under financial liabilities but will continue to recognize these under operating expenses. Since Beiersdorf always had a strong cash balance, the higher debt to capital ratio will not have a significant effect on the company’s strong financial position nor will it impose any liquidity risk.
4.1.5. CAPEX and Goodwill
Capital expenditures as a percentage of sales fluctuated in the past. Especially in 2018, CAPEX increased by 219 bps to 4.95% relative to sales, resulting from tesa’s three acquisitions in 2018. Consequently, Goodwill increased sharply by 64.06% from EUR 64 million (2017) to EUR 105 million (2018). For valuation and modelling purposes, Goodwill is kept constant at the 2018 level.
4.1.6. Tangible Assets
Tangible assets make up 28.81% (prior year: 26.13%) of non-current assets and 13.97% (12.50%) of total assets in 2018. Beiersdorf’s Property, Plant and Equipment (PPE) is carried at cost and reduced by straight-line depreciation over the assets’ expected useful lives. Since Beiersdorf began building new headquarters and a research centre in Hamburg in April 2018, the costs of advance payments and assets under construction increased by 10.83% to EUR 273 million in 2018. In general, net PPE increased at a CAGR of 8.84% from 2011 to 2018. Relative to total sales, PPE grew from 11.34% in 2011 to 17.13% in 2018. The new headquarters is expected to be opened in 2021. As of then, most of the costs reported under advance payments and assets under construction will be shifted to land, land rights and buildings. Beiersdorf’s leases include real estate, company cars and IT equipment. The new accounting standard IFRS 16 provides for the assets to be recognized on the lessee’s balance sheet. Therefore, PPE increases in 2019 by EUR 180 million to EUR 1,462 million. Consequently, also D&A increases (Figure 52).
3,10% 3,20% 3,74% 2,62% 2,33% 2,20% 1,47% 4,99% 2012 2013 2014 2015 2016 2017 2018 2019 FC
Figure 51: Debt-to-Equity Ratio Development
Source: BEI Annual Report
0% 2% 4% 6% 8% 10% 12% 14% 16% 18% 20% 0 500 1.000 1.500 2.000 2.500 2012 2018 2019 FC 2025 FC 2040 FC
PPE, net CAPEX Depreciation % PPE
Figure 52: PPE, Depreciation and CAPEX Development (EUR million)
4.1.7. Intangible Assets
Beiersdorf’s intangible assets can be divided into amortizable intangible assets and non-amortizable intangibles. Together, they make up 4.91% (prior year: 3.57%) of non-current assets and 2.38% (1.71%) of total assets in 2018.
Indefinite-lived intangible assets include the Chinese hair care brands Maestro and SLEK, that were acquired when the shares of the Beiersdorf Hair Care Group China were purchased. The Chinese hair care brands have been recognized as indefinite-lived intangible assets, since Beiersdorf plans to utilize them for an unlimited period. The annual impairment testing in 2018 resulted in a write-down of EUR 16 million in the carrying amount of the trademarks (to EUR 5 million), because SLEK performed poorly. Due to persistent poor performance of this brand, Beiersdorf divested SLEK in August 2019. Since most of the brand’s value has been impaired in the past years, the carrying amount of intangible assets is expected to stay constant in the future.
4.2. Relative Valuation
4.2.1. Comparable Company Valuation
Since company trading multiples vary between industries, the selected peer group for Beiersdorf was divided into peers from the consumer segment and peers from the adhesive technologies market (tesa).
In the process of selecting an appropriate set of comparable companies a long list of publicly traded companies from the same industry with similar global revenue breakdowns was compiled. Hereafter, players were mainly ruled out due to their difference in size, growth, operational focus or product offering (see detailed selection criteria in “Peers Long List” in excel file). Finally, this left a peer group of 11 companies for the Consumer segment and five for the tesa segment (Figure 53).
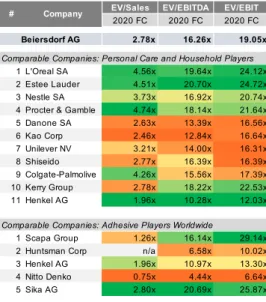
For the comparable company valuation, the three most widely used multiples were selected, being EV/Revenue, EV/EBITDA and EV/EBIT (Figure 54). The estimates used for the peer valuation are all based on forward looking numbers, rather than historical or trailing ones. This is consistent with the principles of valuation that a company’s present value is equal to its discounted future cash flows. Consequently, the estimates for 2020 were used for the valuation. After obtaining the median, mean, as well as the lower and upper bounds for the two segments, the multiples were applied to Beiersdorf’s financials. The overall EV was determined by Figure 53: Short List of Comparable
Companies
EV/Sales EV/EBITDA EV/EBIT
2020 FC 2020 FC 2020 FC
2.78x 16.26x 19.05x
Comparable Companies: Personal Care and Household Players
1 L'Oreal SA 4.56x 19.64x 24.12x
2 Estee Lauder 4.51x 20.70x 24.72x
3 Nestle SA 3.73x 16.92x 20.74x
4 Procter & Gamble 4.74x 18.14x 21.64x
5 Danone SA 2.63x 13.39x 16.56x 6 Kao Corp 2.46x 12.84x 16.64x 7 Unilever NV 3.21x 14.00x 16.31x 8 Shiseido 2.77x 16.39x 16.39x 9 Colgate-Palmolive 4.26x 15.56x 17.39x 10 Kerry Group 2.78x 18.22x 22.53x 11 Henkel AG 1.96x 10.28x 12.03x
Comparable Companies: Adhesive Players Worldwide
1 Scapa Group 1.26x 16.14x 29.14x
2 Huntsman Corp n/a 6.58x 10.02x
3 Henkel AG 1.96x 10.97x 13.30x 4 Nitto Denko 0.75x 4.44x 6.64x 5 Sika AG 2.80x 20.69x 25.87x Beiersdorf AG Company # Source: Bloomberg
using a weighting Revenue, EBIT and EBITDA according to their respective Consumer / tesa segment.
The projected 2020 Group sales EV/Sales yielded an overall share price of EUR 114.26. Beiersdorf’s share price derived from the relative median EV/EBITDA-multiple amounts to EUR 94.55 and EUR 89.83 for the projected 2020 EV/EBIT-multiple (See Appendix 5.5.).
4.3. Intrinsic Valuation
4.3.1. Explicit Forecast Period
As mentioned in the previous section, the main growth driver is the expected increase in sales and operations in emerging markets. Especially the beauty and personal care market is experiencing a radical change, which Beiersdorf needs to react upon. Furthermore, the new accounting standard imposes some significant changes to Beiersdorf financial statements, prolonging the time until Depreciation & Amortization (D&A) and Trade Working Capital reach constant ratios to sales. Therefore, the medium- to long-term explicit forecast period is set to 22 years, from 2019 to 2040.
4.3.2. Cost of Capital
In order to discount Beiersdorf’s unlevered FCFs, an appropriate weighted average cost of capital has to be determined. As an adequate proxy for the risk-free rate the yield for 3-year German Government Bunds is applicable, as this is the same currency in which the majority of Beiersdorf’s shareholders measure their return.
In order to find the Beiersdorf’s beta, the historical monthly returns of Beiersdorf’s stock were regressed against the excess monthly return of the MSCI World index over the horizon of five years. This yields an overall Beta of 0.48. After applying a 95% Confidence Interval to the obtained Beta the upper and lower bounds were found at 0.21 and 0.83, respectively. To find a more accurate estimate for the company’s systematic risk, a 5-year rolling Beta over the historical period of 15 years was calculated (Figure 55). Since the obtained rolling Beta showed a high degree of volatility, with values ranging between 0.37 and 0.99, the Beta of Beiersdorf’s comparable companies were computed. To find a further implication of Beiersdorf’s true unlevered Beta, a peer Beta was derived using a bottom-up approach. Another reason for doing so is that a Beta’s standard error is significantly smaller when averaging multiple regressions than the standard error of a beta obtained through a single regression (Damodaran,
0,00x 5,00x 10,00x 15,00x 20,00x 25,00x 2019 2020 FC 2021 FC 2019 2020 FC 2021 FC 2019 2020 FC 2021 FC EV/Sales EV/EBITDA EV/EBIT
Beiersdorf Consumer Goods Adhesives
Figure 54: Median Peer-Valuations 2019-2021FC Source: Bloomberg 0,00 0,20 0,40 0,60 0,80 1,00 1,20 2009 2010 2011 2012 2013 2014 2015 2016 2017 2018 2019 Rolling Beta Median
Figure 55: 5-year Rolling Beta of Beiersdorf