Nova School of Business & Economics
EBS B
USINESSS
CHOOLEBS U
NIVERSITÄT FÜRW
IRTSCHAFT UNDR
ECHTThesis
to obtain the academic degree Master of Science
Main Differences in Strategic Decisions between Sharing
Economy Platforms and Collaborative Consumption
Platforms
Submitted by: Bruno Eusebio
Submitted to: Prof. Dr. Markus Kreutzer Prof. Dr. Irem Demirci
Abstract
Literature on sharing economy is still very limited and lacks clear boundaries to which businesses should and should not be included in its sphere. The present study defines the differences and similarities between the business models of pure sharing economy platforms, such as Turo, and collaborative consumption platforms, such as DriveNow, as both are frequently included in the sharing economy sphere. Using the business model canvas framework to compare each of the nine elements that constitute both business models, results show that the customer interface is the only similarity between the two business models while the value proposition, infrastructure management and financial aspects differ significantly between sharing economy and collaborative consumption platforms. Based on these results, it is clear that pure sharing economy platforms and collaborative consumption platforms should not be treated indifferently as part of the sharing economy sphere as generalizations would lead to wrong conclusions based on incorrect assumptions.
Table of Contents
TABLE OF FIGURES ... IV
INTRODUCTION ... 1
PROBLEM STATEMENT & PURPOSE OF THE STUDY ... 2
LITERATURE REVIEW ... 2
METHODOLOGY & RESEARCH DESIGN ... 6
DATA COLLECTION & ANALYSIS ... 7
BUSINESS MODEL CANVAS ... 7
VALUE PROPOSITIONS ... 8 CUSTOMER INTERFACE ... 9 INFRASTRUCTURE MANAGEMENT ... 12 FINANCIAL ASPECTS ... 17 RESULTS ... 19 SAMPLE ... 19 VALUE PROPOSITIONS: ... 24 CUSTOMER INTERFACE ... 31 INFRASTRUCTURE MANAGEMENT ... 38 FINANCIAL ASPECTS ... 45 DISCUSSION: ... 51 CONCLUSION: ... 55 REFERENCES ... 55
TABLE OF FIGURES
FIGURE 1: BUSINESS MODEL CANVAS ... 8
FIGURE 2: VALUE FRONTIER ... 8
FIGURE 3: CUSTOMER INTERFACE ... 10
FIGURE 4: INFRASTRUCTURE MANAGEMENT ... 14
FIGURE 5: FINANCIAL ASPECTS ... 17
FIGURE 6: NUMBER OF CAR SHARING VEHICLES IN SELECTED EUROPEAN CITIES IN 2016 ... 20
FIGURE 7:FRANCE CAR SHARING PROVIDERS USED IN THE PAST 12 MONTHS ... 20
FIGURE 8: UK - CAR SHARING PROVIDERS USED IN THE PAST 12 MONTHS ... 21
FIGURE 9: GERMANY - CAR SHARING PROVIDERS USED IN THE PAST 12 MONTHS ... 21
FIGURE 10: ITALY - CAR SHARING PROVIDERS USED IN THE PAST 12 MONTHS ... 22
FIGURE 11: SPAIN - CAR SHARING PROVIDERS USED IN THE PAST 12 MONTHS ... 22
FIGURE 12: SAMPLE LIST OF CAR SHARING ORGANIZATIONS ... 23
FIGURE 13: TOP PRIMARY SERVICE PROVIDERS OF CLOUD SERVICES IN ORGANIZATIONS WORLDWIDE AS OF 2019 ... 23
FIGURE 14: SAMPLE LIST OF FILE SHARING ORGANIZATIONS ... 24
FIGURE 15: DESCRIPTIVE ANALYSIS OF THE TOTAL SAMPLE ... 24
FIGURE 16: SHIFTS VS EXTENDS THE VALUE FRONTIER BY INDUSTRY ... 25
FIGURE 17: AVERAGE NUMBER OF VALUE PROPOSITION REFERENCES PER INDUSTRY AND BUSINESS MODEL ... 25
FIGURE 18: INNOVATION PER INDUSTRY DISTRIBUTED ... 26
FIGURE 19:INNOVATION PER BUSINESS MODEL ... 27
FIGURE 20: INNOVATION PER BUSINESS MODEL WITHIN CAR SHARING INDUSTRY ... 27
FIGURE 21: INNOVATION PER BUSINESS MODEL WITHIN FILE SHARING INDUSTRY DISTRIBUTED ... 28
FIGURE 22: PRICE LEVEL PER INDUSTRY ... 29
FIGURE 23: PRICE LEVEL PER BUSINESS MODEL ... 29
FIGURE 24: PRICE LEVEL PER BUSINESS MODEL IN THE CAR SHARING INDUSTRY ... 30
FIGURE 25: PRICE LEVEL PER BUSINESS MODEL IN THE FILE SHARING INDUSTRY ... 31
FIGURE 26: BUSINESS RELATION TYPE PER BUSINESS MODEL ... 31
FIGURE 27: BUSINESS RELATIONSHIP TYPE PER INDUSTRY FOR COLLABORATIVE CONSUMPTION PLATFORMS ... 32
FIGURE 28: CUSTOMER SEGMENT PER INDUSTRY ... 32
FIGURE 29: CUSTOMER SEGMENT PER BUSINESS MODEL ... 33
FIGURE 30: AVERAGE NUMBER OF CHANNELS USED BY BUSINESS MODEL AND INDUSTRY ... 34
FIGURE 31: CHANNEL TYPES USED PER BUSINESS MODEL ... 34
FIGURE 32: CHANNEL TYPES USED PER INDUSTRY ... 35 FIGURE 33: AVERAGE NUMBER OF CUSTOMER RELATIONSHIP MECHANISMS USED PER INDUSTRY AND
FIGURE 34: CUSTOMER RELATIONSHIP MECHANISM PURPOSES PER BUSINESS MODEL ... 36
FIGURE 35: CUSTOMER RELATIONSHIP MECHANISM FUNCTION PER INDUSTRY ... 37
FIGURE 36: CUSTOMER RELATIONSHIP MECHANISM PURPOSES PER INDUSTRY ... 37
FIGURE 37: CUSTOMER RELATIONSHIP MECHANISM FUNCTION PER INDUSTRY ... 38
FIGURE 38: AVERAGE NUMBER OF KEY RESOURCES PER INDUSTRY AND BUSINESS MODEL ... 38
FIGURE 39: KEY RESOURCES PER BUSINESS MODEL ... 39
FIGURE 40: KEY RESOURCES PER INDUSTRY ... 40
FIGURE 41: AVERAGE NUMBER OF KEY ACTIVITIES PER INDUSTRY AND BUSINESS MODEL ... 40
FIGURE 42: KEY ACTIVITIES PER BUSINESS MODEL ... 41
FIGURE 43: KEY ACTIVITIES PER INDUSTRY ... 42
FIGURE 44: AVERAGE NUMBER OF KEY PARTNERS PER INDUSTRY AND BUSINESS MODEL ... 42
FIGURE 45: KEY PARTNERS' INDUSTRIES PER BUSINESS MODEL ... 43
FIGURE 46: KEY PARTNERS' INDUSTRIES PER INDUSTRY ... 44
FIGURE 47: PARTNERSHIPS REASONING PER BUSINESS MODEL ... 44
FIGURE 48: PARTNERSHIPS REASONING PER INDUSTRY ... 45
FIGURE 49: AVERAGE NUMBER OF REVENUE STREAMS BY INDUSTRY AND BUSINESS MODEL ... 46
FIGURE 50: REVENUE STREAMS NATURE BY BUSINESS MODEL ... 46
FIGURE 51: REVENUE STREAM TYPES BY BUSINESS MODEL ... 47
FIGURE 52: REVENUE STREAMS NATURE PER INDUSTRY ... 48
FIGURE 53: REVENUE STREAM TYPE PER INDUSTRY ... 48
FIGURE 54: AVERAGE NUMBER OF COST REFERENCES PER INDUSTRY AND BUSINESS MODEL ... 49
FIGURE 55: COST STRUCTURE REFERENCES PER INDUSTRY ... 50
Introduction
In the last decade, enabled by the fast technology development registered, a wide range of platforms arose worldwide with companies as different as Amazon, Airbnb, and BMW leveraging the new resources available to offer innovative services worldwide (Caillaud & Jullien, 2003). Although even Multi-Sided Platforms (MSPs) have been around for centuries in different forms, such as local markets where farmers meet consumers, the development of information technology in the recent decades “has tremendously increased the opportunities for building larger, more valuable and powerful platforms” (Hagiu, 2007a).
It was precisely this technology development that allowed the creation of such a wide range of platforms as we have today, with so many different business models and purposes. From one-sided platforms, such as a farmer’s website that only offers his own products to the end-consumer, to MSPs, such as Amazon where multiple third-party sellers sell directly to end-consumers, today one can even find several differentiators within these segments. Driven by this trend, as a sub-category of MSPs, a significant rise of companies entitled as “Sharing Economy Platforms” have taken place in the last decade (Davis, 2016), led by companies such as Airbnb and Uber. The expected growth of such a market is such that, according to Price Waterhouse Coopers (2016), the platforms’ revenues in the European sharing economy are expected to reach €80 billion by 2025, compared to the €4 billion market size registered in 2015.
As the trend towards sharing economy grows, while supporters praise its promotion of sustainable consumption (Martin, 2016) that will decrease the unsustainable practices of over-consumption registered on the past decades by enabling a consumer shift from owning to sharing assets (Bicrel, 2012), opponents describe it as “purely an economic opportunity” (Martin, 2016) that have been affecting the profitability and employment of big industries such as accommodation (impacted by Airbnb-alike platforms) and car rental (affected by Uber and Drive Now-alike platforms). Furthermore, studies reveal an increasing number of people who were public transportation users, are now preferring these services driven by their low prices, which is not as environmentally friendly as public transportation (Graehler, Mucci, & Erhardt, 2019).
On the other hand, and partly based on the sharing economy sustainable consumption practices, collaborative consumption one-sided platforms appeared, such as Drive Now, a car-sharing BMW subsidiary, which literature does not differentiate from the sharing
economy, although they “rely on specially dedicated capacity” (Gerwe & Silva, 2018). Given the often required high investment to provide collaborative consumption services, very often such innovative platforms are created by industry incubators who are servitizing their products as a response to new sharing economy competitors (Constantiou, Marton, & Tuunainen, 2017).
Although it is well known that sharing economy and collaborative consumption platforms share a significant number of key features, such as the short-rental offers to users, it is also clear that each value delivery model differs significantly, which might lead to significantly different strategic decisions through each’s value chain. In fact, while Airbnb has been subsidizing hosts since the very beginning to increase the number of listings on the platform, DriveNow owns its own fleet and have been focusing its efforts on attracting users. On the other hand, while Airbnb has systematically relied on the word-of-mouth to expand its reach both for hosts and guests, DriveNow often invests in special offers for local events and activities, which improves its customer awareness.
Given that collaborative consumption platforms are frequently included in the sharing economy literature where special emphasis has been given to the importance of cross-sided network effects while such effect can only, by definition, occur in multi-cross-sided platforms, which collaborative consumption platforms are not, it is clear that the boundaries that define sharing economy platforms need to be more clear.
Problem Statement & Purpose of the Study
Given the increasing presence of sharing economy and collaborative consumption platforms, their fast growth, and the wide range of products/services and respective business models, the present study aims to not only contribute to the current academic effort to better understand the key features and strategic decisions of these platforms, but also to understand the main similarities and differences between them. Afterall, the present study aims to answer the following research question:
1. How are the main strategic decisions different between sharing economy platforms and collaborative consumption platforms?
Literature Review
Although there is a considerable amount of literature around the management, value drivers and features of MSPs, due to the very recent appearance and rise of the sharing economy and its “wide range of diverse platforms, business models, and transactions”
(Gerwe & Silva, 2018), there is still privation of literature about its concept and features (Cheng, 2016), while the same applies to the amount of literature on Collaborative Consumption.
As five of the current top ten most valued companies worldwide create much of their value through MSPs (Hagiu & Altman, 2017), there is already considerable literature about the main features and specifications of its business models.
Nowadays, MSPs “play an important role throughout the economy by minimizing transactions costs between entities that can benefit from getting together” (Evans, 2011). According to literature, the minimization of the transaction costs may be divided into two subcategories: reduction of search costs and shared costs.
As such platforms often act as intermediaries among different parties, MSPs create value by reducing the so-called search costs by facilitating the acquisition of information by consumers about the sellers’ offers. Such significant reduction of search costs offered by MSPs benefit consumers by “reducing the ability of sellers to extract monopolistic profits while increasing the ability of markets to optimally allocate productive resources” (Bakos, 1997). Once the match between two parties is reached, MSPs also contribute to the reduction of costs during the transaction itself, which frequently comprises transportation costs and payment fees, leveraging on achieved economies of scale and scope (Hagiu, 2007b). As the value created by MSPs mostly relies on those two cost reductions, literature evaluates as of crucial importance for each platform to differentiate the decisions taken to improve each of them, given that for platforms such as Google and Facebook, where the search costs reduction for advertisers is of much value, attention should be paid for such decisions to not deteriorate the user experience (Hagiu, 2007b)
Besides that, the literature on MSPs has given a particular focus to network effects (Jr, Parker, & Tan, 2014). As network effects are defined by the impact that the interaction within users have on their platform usage, the literature has found four main types of network effects, even though the presence, effect, and importance of each varies significantly among business models and industries.
Same-side or direct network effects are present when there is “a direct physical effect of the number of purchasers on the quality of the product” (Katz & Shapiro, 1994) and are commonly present in communication platforms, such as Facebook as “the more Facebook friends you have in your network, the more likely you are to attract additional friends through your friends’ connections” (Zhu & Iansiti, 2019), increasing Facebook’s
the platform value for one user group increases with the increment on the number of users of a different user group (Shapiro & Varian, 1999). These effects “occur when, for example, advertisers become attracted to the Google search engine or to Facebook because of the large number of users” (Gawer & Cusumano, 2014).In specific cases, the very same user may impact both same- and cross-side network effects, as it is the case in eBay, when sometimes he may use the platform as a buyer, while other times as a seller. Literature has also given emphasis to the presence of common network externalities, which “occurs when both groups benefit, possibly with different intensities, from an increase in the size of one group and from a decrease in the size of the other”, where the presence can be noticed in the health-care sector, as “hospitals compete for patients on one side and providers on the other side; health-care quality is frequently related to the provider/patient ratio” (Bardey, Cremer, & Lozachmeur, 2014). Finally, Belleflamme and Toulemonde (2009) and Kurucu (2007) also reported negative intra-group network externalities, where one side values more the platform as the number of members of the other group increases and the number of same-sided members is reduced. That is the case in platforms such as job-matching and matrimonial-matching, where competition is not welcome.
As literature has systematically reported the importance of network effects for MSPs success, it is key for platform managers to understand what type(s) of network effect(s) apply to their business model and industry, so they may leverage them and invest their generally scarce resources in the right value drivers.
Given the importance of network effects for MSPs growth, as well as the high inherent risk early-users face and the not-so-high value platforms offer in the early days, platforms’ managers often invest in tools to wisely attract users. One of the most used tools is subsidies, which serve the purpose of “subsidize users on one side to attract users on the other side” (Wang, He, Yang, & Oliver Gao, 2016). However, as MSPs, by definition, have more than one side involved, managers often subsidize the most price-sensitive user group, while recovering the loss on other user groups (Caillaud & Jullien, 2003).
Finally, as MSPs grow to advanced stages of development, literature debates two other essential management tools for MSPs to retain value: Multi-homing avoidance and risk of disintermediation.
and transactions, it faces an increased risk of disintermediation” (Gu & Zhu, 2018), which oftentimes collide with MSPs’ business models that rely on transaction fees. To protect themselves from such threats, platforms’ manager has two options available according to (Zhu & Iansiti, 2019): 1) disable users from exchanging contact information, 2) enhance in-platform transaction value by offering additional services, such as insurance.
On the other hand, as competition rises in some industries, especially in labor platforms, such ride-hailing service, where product or service differentiation is not as high as in other marketplaces, network members might be tempted to use multiple platforms to increase its exposure to consumers. This challenge is called multi-homing, and it might “reap maximal network benefits” (Choi, 2010).
Despite the recent impressive rise of platforms self-entitled as sharing economy in our economy with companies such as Uber and Airbnb, literature still lacks conceptual clarity of the topic and its boundaries (Cheng, 2016). In fact, while some literature sets monetary compensation as a boundary of the sharing economy definition, where platforms such as Wikipedia would be included, while others such as Airbnb would be excluded (Belk, 2014), others, such as Botsman (2013), include in the sharing economy sphere all platforms that enable the sharing of the underutilized assets that can range from physical assets to skills, regardless of the monetary compensation. Furthermore, other authors are more restrict in regard to the asset nature as only include platforms that focus on the short-term access to under-utilized physical goods (Frenken & Schor, 2017). In platforms like Airbnb would be included if the infrastructure was not bought only for the purpose of renting, while platforms like TaskRabbit would be excluded given that it is not a transaction of physical goods, but skills. Finally, (Gerwe & Silva, 2018) recently reviewed the literature about the boundaries of the sharing economy environment, and came out with a well-substantiated definition that combines parts of various contradictory views. This definition, that will be the one used in the present study, includes all the platforms that enable offline transaction between private individuals of underutilized assets that can range from physical to non-physical, such as time and skills.
Furthermore, the literature on the specific management of sharing economy platforms is still in the nascent state (Martin et al., 2015). Despite that, as the willingness to share private assets is still in the development stage in today’s society, platforms often times experience supply shortages, creating “strong incentives to encourage sharing via subsidies” (Fang, Huang, & Wierman, 2016).
The literature also mentions that there are two features that define a specific sharing economy platform: money-based or not and capital or labor platforms. “The combination of transaction type and asset type has direct implications for consumers, providers, and platforms” (Gerwe & Silva, 2018). In fact, money-based platforms usually emphasize the economic benefits of sharing, while non-money-based platforms focus on social benefits. Furthermore, asset-based platforms will need to convince asset-owners to provide access to their private assets, which is usually done through subsidies and brand trust, while labor-based platforms attract peers more easily.
As this business model is becoming increasingly popular with the rise of technologic services such as Netflix, Amazon’s AWS cloud service, and car-, bicycle-, and scooter-sharing services, the literature describes collaborative consumption as “a middle ground between sharing and marketplace exchange, with elements of both” (Belk, 2014).
With the essence of access to goods rather than its ownership, the collaborative consumption has been benefitting from global trends such as “global warming, rising fuel and raw materials prices, and growing pollution” (Belk, 2014)
In contrast to peer-to-peer platforms, literature does not provide meaningful insights about the importance of trust between peers and the importance of the intermediary on it about collaborative consumption platforms, given that the provider is usually a well-reputed company who assures the presence and quality of the service. On the other hand, literature has also covered the importance of platform governance in collaborative consumption platforms as (Hartl, Hofmann, & Kirchler, 2016) show that peers increase collaboration if sanctions are applied in the case of late asset returns, for example.
Methodology & Research Design
In order to analyze and take valid conclusions on a systematic manner about the similarities and differences of the strategic decisions between sharing and collaborative consumption platforms, the present study will use the business model canvas framework as a guidance, where, first the sharing economy platforms, and then collaborative consumption platforms, will be individually analyzed by each of the framework’s elements. After that, an in-depth comparison will be performed to summarize the main similarities and differences of the strategic decisions of the two platform types, from where the main conclusions will be confronted with existing strategy literature to understand the root causes for the found conclusions.
The business model canvas framework was chosen as it is “the most popular framework for business models” (Meertens et al., 2012). In fact, there are adaptations of the framework that add layers and dimensions and could better fit the analysis of platform businesses, such as the service business model canvas by (Zolnowski, Weiss, & Bohmann, 2014). However, that would add complexity to the analysis unnecessarily as it is not the primary purpose of the current study to compare different business models on its full extent, but to analyze the strategic decisions of sharing and collaborative consumption platforms that derive from the business model of the platforms itself, for which the original framework serves the purpose accurately, and the literature well praises it.
Data Collection & Analysis
Although the existing literature on sharing economy and collaborative consumption platforms is still limited and extremely focused on specific aspects, such as network effects, environmental and social effects, and subsidies, the present study will use the existing high-quality literature to answer as many elements of each business model canvas as possible. Furthermore, given the deep, but also wide, scope of the framework used and the limited existing literature available, the literature will be complemented by high-quality consulting and businesses articles and reports whenever necessary.
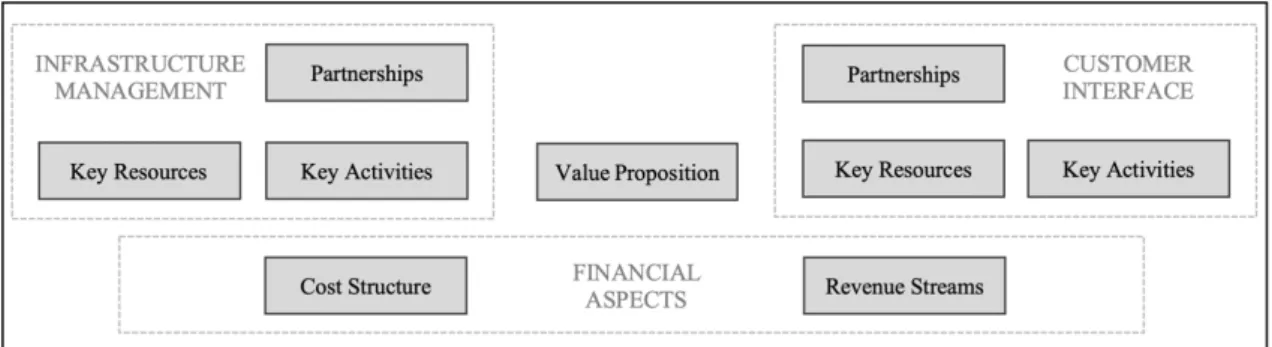
Business Model Canvas
The present study will use the Business Model Canvas framework as the basis for the analysis as it enables the comparison of core constructs such as Key Partners, Cost
Structure, and Value Propositions. This section defines each of the nine constructs
comprised in the framework.
Figure 1: Business Model Canvas Value Propositions
“A Value Proposition is an overall view of a company’s bundle of products and services that are of value to the customer” (Osterwalder, 2004). By providing specific value to a given customer segment, this analysis describes the customers’ choice for the purchase to one company versus its competitors. In fact, a systematic study of one’s value proposition facilitates value innovation and comparison to competition’s offering. Furthermore, such an analysis is a crucial success factor for companies in today’s fast-changing competitive environment as “market leaders escape the commoditization trap of their industry by either extending and reinventing the value frontier, or by radically shifting the frontier” (Kambil, 1997). As extending the value frontier can be achieved by providing either a better performance product/service for a higher price or a worse performance product/service for a lower price than the existing offers in the market, reinventing the value frontier can be achieved either by proving the better performance product/service for a given price or by charging a lower price for a given product/service performance than the existing offers in the market, which would eventually create a temporary competitive advantage while competitors struggle to meet the new offering.
On the other hand, (Kim & Mauborgne, 1997) defend that value innovation is based on the different management mind-set that does not follow the tentative rivals matching and beating, but that is entirely focused on the customer needs and preferences. Using the Bert Claeys company example who has been in the fast-declining Belgium movie theaters business, the company did not follow its competitors’ moves to offer city-center located multicomplexes. Contrarily, it offered the world’s first megaplex instead with much better infrastructure located at not so prime locations with large parking slots for clients. Such a disruption in the value offered did not lead to an increment in prices given the economies of scale enabled by the size and the cheaper location. Furthermore, the company did not have to invest significantly in advertising as the innovative value proposition generated high levels of word-of-mouth. As rivals took time to catch up with this reinvention of the value frontier, Bert Claeys was able to take 50% of the Brussels market in the first year and expanded the market by 40%.
The present study will complement the analysis presented just above with the value proposition framework presented by (Osterwalder, 2004). In this framework, the value proposition is firstly decomposed into a set of elementary offerings, which is a specific product/service feature that satisfies one or more customer’s needs. Each elementary offering is then analyzed separately based on the following attributes: REASONING, VALUE LEVEL, and PRICE LEVEL. The REASONING section explains the underlying reasoning for the belief of the value offered, which typically comes either from use (e.g. getting transported from A to B), customer’s risk reduction (fear of driver doesn’t show up), and customer’s effort reduction (ride hire via the app versus calling the taxi call center). In VALUE LEVEL section, each elementary offering’s value is compared to competitors’ offering, regardless prices, and ranked according to the following scale: Me-too (equal to competitor), Innovative imitation (offer adds innovative elements to competitor’s offering), Excellence (better value than competitors), and Innovation (blue-market strategy by offering a completely new product or service). The PRICE LEVEL section compares an elementary offering’s price level to competitors’ and it is ranked from Free over Economy (low-cost offers) and Market (average market price level) to High-end.
Following the presented analysis structure, the value proposition construct will outline the various key factors of sharing economy and collaborative consumption platforms’ value proposition. Given that sharing economy platforms are, by definition, MSPs, this
Airbnb, are the hosts who rent their properties through the company’s platform. Finally, as several platforms compete with traditional businesses in specific industries, the present study will not only draw comparison within platforms but also between platforms and traditional businesses.
Customer Interface
This pillar of the business model will cover all the aspects related to Customer Relationship Management (CRM). As such pillar is a key success factor for companies to communicate their value proposition to consumers, and a good customer interface strategy might enable a company to deliver the right product at the right time to the right customer, it becomes essential for companies to deliberate the different aspects involved in the customer relationship that this study will separate in Customer Segments, Channels, and Customer Relationship.
Figure 3: Customer Interface Customer Segments
In this construct, the study will analyze the customer segmentation as it “enables a company to allocate investment resources to target customers that will be most attracted by its value proposition” (Osterwalder, 2004). In such a complex environment, the most basic customer segmentation is between business (B2B) and business-to-customer (B2C), but companies have to define much more in detail their target business-to-customers to invest their scarce resources in those who enable the largest returns. In fact, according to (Weinstein, 2006), by having well-defined product/service offerings, firms will be able to target customers more effectively, improving its capability of owning customers, which is key to create a competitive advantage. Moreover, as pure sharing economy platforms
are analyzed in the present study, Customer-to-Customer (C2C) transaction are also expected to occur.
Channels
Channels are the bridge between the value proposition and the customer segment, as it “describes how a company gets in touch with its customers” (Osterwalder, 2004). This element of the business model is crucial as it defines how well a company offers the correct products and services on the right quantities at the right place, at the right time to the right people (Pitt & Berthon, 1999). Given its importance, companies tend to use several customer touchpoints to better apply marketing resources by reaching the right client at the right time. The different tools used, such as company website and physical stores, are called LINKS and have specific objectives within the company marketing strategy. As, nowadays, great companies differentiate themselves by innovative customer approaches as it is the case of Amazon’s marketplace that offers a user-friendly, fast, and secure online purchasing, companies’ channels might and might not integrate the value proposition.
Different companies use multiple different links, from more traditional customer contact channels, such as call centers and physical locations, to more advanced channels enabled by the internet, such as mobile applications and chatbots. Given such diversity, customer touchpoints nowadays contain a wide variety of forms that serve different purposes and customer approaches, such that most industries have been “reorganizing channel flows […] to explore multichannel marketing programs to strengthen relationships with its customers” (Rangaswamy & Bruggen, 2005). In order to understand the number, types, and purpose of links used by sharing economy and collaborative consumption platforms, the present study will firstly outline the main links used by each platform type, then analyze how each link affects the Customer Buying Cycle (Awareness, Evaluation, Purchase, and After Sales), and finally how platform’s links inter-relate with each other. These findings will be placed and summarized in a matrix with the different phases of the customer buying cycle on top and the different platform links on the left, using arrows to link the relationship between a specific link’s role to the next step of the customer buying cycle.
Customer Relationship
“The customer relationship element refers to the way a firm goes to market, how it actually reaches its customers and how it interacts with them” (Osterwalder, 2004). To interact with customers, firms make use of an increasing number of relationship mechanisms that serve different purposes as the lower cost and higher customization and value of new technological communication tools opened a whole new range of possibilities to the point where a simple smartphone notification is enough to inform the customer of a special discount. In fact, although there is a wide range of relationship mechanism available for firms to use, the firm’s objective in every point of contact is limited to at least one of the following: acquire a new customer, retain a customer or to upsell to existing customers. Although every single company in the world has to acquire a customer at some point in time, generally it becomes much more expensive to attract a new customer than to extend the relationship with an existing customer, which forces companies to use loyalty mechanisms to retain existing clients, such as frequent-flyer-miles offered by airlines.
Besides the ultimate firm’s objective of every mechanism, each one has its function, i.e, each mechanism has an effect on the customer that can either be relationship personalization, customer trust-building, or brand building. In fact, although innovative technology has enabled a new range of customer relationship mechanisms, this new reality has been increasingly taking the place of more traditional in-person relations that were fully personalized as each client received a different treatment according to his/her needs, while the sending of an SMS to a firm’s customer base notifying of a new price discount, although it gets broad and instant exposure and does not require much financial and time effort from the firm, it might not discriminate each client’s interest in it. On the other hand, more advanced and complex client databases include detailed information about each client and their preferences, which enable firms to use cheap technological relationship mechanisms to contact the right clients at the right time with the right information, creating a sense of personalization, as it is the case of TripAdvisor who uses the client’s smartphone real-time location to give gastronomic advice around the client’s area when near to a shopping center at lunch time. On the other hand, providing such personalized services based on the client’s information might increase the overall concern over data privacy.
Furthermore, as customer interactions have been changing over the decades to a more virtual reality, it has become key for companies to incorporate trust mechanisms. In fact, “Without social cues and personal interaction such as body language, the observation of other buyers, and the ability to feel, touch, and inspect products, customers can perceive online business as riskier in nature” (Siau & Shen, 2003). In today’s platforms, where most of the transactions occur online, different types of trust mechanisms have been created to assure more confidence to both the end consumer and the provider, when applicable. As MSPs, such as Airbnb, that take the role of booking intermediator and charge a commission out of every booking rely on the providers’ offering success, it is of the platform’s best interest to build trust mechanisms, such as host and guest reviews, for both the provider and the end-consumer to feel comfortable using the platform. As a platform gains traction over successful years with the use of trust mechanisms and each stakeholder adapts to a set of expected behaviors guided by the mechanisms applied, the mechanisms’ importance decreases, given that “the relationship between trust and behaviour between economic partners is also dynamic because it changes over time” (Holland & Lockett, 1998).
Finally, the third and last function of relationship mechanisms is to build the equity brand. As a brand is what distinguishes one product/service from its rivals via its logo or name (Aaker, 1991), “brand-loyal consumers may be willing to pay more for a brand because they perceive some unique value in the brand that no alternative can provide” (Chaudhuri & Holbrook, 2001). Given its importance, companies should clearly define their values and identity in order to communicate it consistently to consumers who will hopefully get personally identified with the brands’ actions and beliefs. As so, firms use specific relationship mechanisms to communicate their brand value to consumers.
The present study will identify and categorize the different relationship mechanisms used by sharing economy and collaborative consumption platforms according to their primary objective (customer acquisition, retention, or add-on selling) and identify its function (personalization, trust, or brand building).
Infrastructure Management
The infrastructure management describes how the firm delivers the value proposition to customers, which comprises all the complex and key resources a firm uses to create the
product/service, all the key activities the firm has to perform using the resources, and the
key partnerships that complement the in-house resources and activities to deliver the
value proposition to consumers.
Figure 4: Infrastructure Management Key Resources and Capabilities
Key resources and capabilities contain all the significant physical and immaterial resources and capabilities, which are either built or acquired in-house or outsourced to business partners, that are necessary to deliver the value proposition to clients. Business capabilities “describes the ability to execute a repeatable pattern of actions” (Osterwalder, 2004) that enable the company to deliver the value proposition using the resources available. A great example of that is the Ryanair’s capability to consistently fill airplanes with high air time enabled by efficient logistics at the airports. Resources are the inputs necessary to make use of the capabilities to deliver the value proposition and can either tangible, intangible, or human-skills. Tangible skills comprise assets such as airplanes and cash reserves. Intangible assets include assets such as patents and brand. Human-skills are the company’s employees who use tangible and intangible assets to deliver value to consumers.
In this section, the study will analyze the different nature of resources and capabilities sharing economy and collaborative consumption platforms have in place to deliver value to customers successfully.
Key Activities (value configuration)
Just as different companies provide different products and services, their process to create, market, and sell consequentially differ from each other. Such process is composed by different activities which are defined as “the actions that a company performs in order
to create, market, and deliver value propositions to its customers and make profit out of them” (Muhtaroglu, Demir, Obali, & Girgin, 2013). Although the right process chain is dependent on the company’s offering, (Osterwalder, 2004) defends that every process chain is composed by one of the three main types of value configuration: Value chain, developed by [Porter,2001], Value Shop, and Value Network, developed by [Stabell and Fjeldstad, 1998]. The valuechain model is mainly used in the more traditional businesses based on the transformation of inputs into products through the performance of a set of specific activities, such as logistics, operations, marketing, sales, and service. On the other hand, [Stabell and Fjeldstad, 1998] defend that service provisioning follows a different process chain, which led to the creation of value shop that suggests that services, such as consulting, do not go through the logistics and operations as traditional businesses do. In fact, value shop indicates that servicing businesses aim to produce solutions to customers’ problems in a cyclical and not sequential logic, which means that value shop logic involves activities such as figuring out customers’ needs, delivering value on those needs, verify the customers’ needs saturation, and the process repetition, eventually. Finally, value network is present in companies that operate as business intermediaries, such as market makers, who deliver value by developing a network and a platform that matches business providers with customers. In this case, the logic is nor consequential nor cyclical, but mediating, as such process chain involves activities such as network promotion, contract promotion, and infrastructure operations.
This study will analyze what typology of value configuration and respective activities sharing economy and collaborative consumption platforms apply to their business models.
Key Partners (partnership)
As products and service delivery become increasingly complex over the years, and the highly competitive environment forces companies to speed up their go-to-market timing, successful firms have found on partnerships a key vehicle to deliver value to customers. As “a partnership is a voluntarily initiated cooperative agreement formed between two or more independent companies in order to carry out a project or specific activity jointly by coordinating the necessary capabilities, resources and activities” (Osterwalder, 2004), just like most business decisions, it comes with pros and cons. In fact, as a company delivers one part of the process to an outside actor with more resources and capabilities
for the job, the company may be able to focus on the core activities of its businesses where it has developed competitive advantages to deliver a great value proposition. Besides that, by developing a product or service together with a complementary partner, the knowledge sharing involved might benefit the companies entailed. On the other hand, partnership agreements with outside players lowers a firm’s control over resources, which explains the importance of developing the key components and activities in-house.
As partnerships serve different purposes and reasonings according to the activity and industry involved, literature has found four main valid reasons to settle a partnership.
The first reasoning is based on the transaction cost economics (TCE) that defends that companies should not take decisions only based on the production costs on its own, but should also consider all the corresponding managing costs involved, such as personal hiring, product testing, and market screening. Based on this theory, a company should make a partnership if it becomes cheaper than producing the desired product itself internally, taking into consideration all the setting up and managing costs involved in both options. Usually, such theory applies to non-core parts of a company’s business.
Other relevant reason for creating a partnership is explained by the resource-based view that suggests that a company should do a partnership to get access to an important resource that does not process at the moment. In fact, firms should evaluate what key resources would be needed to deliver the aimed value proposition. Once a list is performed, the firm should evaluate its procession in-house according to VRIN criteria (Valuable, Rare, Imperfectly Imitable, and Non-substitutable) and, finally, arrange partnerships with outside actors who process the resources that do not fulfill the VRIN criteria in-house.
An alternative valid reason to form an alliance, according to the literature, is to “wish to acquire knowledge and learn new skills and capabilities” (Hitt, Dacin, Levitas, Arregle, & Borza, 2000) from working together with partners with different experiences. Such alliances perspectives are common in the automotive industry when two or more multi-national brands with different skills and capabilities work together to both profit from the partnership by leveraging on the partners’ skills. More specifically, it is common practice for a company with strong manufacturing expertise to partner with company with strong market expertise as they are both key success factors and the knowledge might be transferable.
bargaining power over the companies’ stakeholders, economies of scale, risk sharing on high risk and investment operations, and formulation of industry standards. In fact, now-a-days major technology competitors, such as Apple, Google, and Samsung, and suppliers, such as Qualcomm, are working together in the Wireless Power Consortium (WPC) to develop standards for a variety of different wireless power applications.
The present study analysis the typologies, the reasons, and with whom sharing economy and collaborative consumption platforms usually partner with.
Financial Aspects
As a result of all other previously mentioned elements, financial aspects element comes as the last pillar to be analyzed, even though it comprises the ultimate goal of most companies. In this element, this study analysis sharing economy and collaborative consumption platforms’ revenue models and cost structures, as they determine every firm’s bottom line.
Figure 5: Financial Aspects Revenue Models
Given its traditional role as the primary contributor to a company’s profits, most companies’ operations aim to increase revenues as much as possible taking into consideration all the respective implications by making use of numerous tools available. In fact, “the revenue model describes the way a company makes money [and] it can be composed of one or several revenue stream and pricing elements” (Osterwalder, 2004). As a company might enlarge and diversify its revenue streams by offering a broad range of products and/or services, even within one product/service category, it might use numerous pricing elements to reach different customer targets, i.e., create different bundles of products/services with singular pricing to satisfy each customer target preferences and, ultimately, maximize its sales. Moreover, the technology advancement has enabled companies to offer a wider pricing range based on a large amount of customer
information available, to the point that companies can explore each customer’s willingness to pay to the maximum by applying different prices.
Based on today’s numerous business models existent worldwide, companies practice different types of economic activities to generate revenue streams. In fact, while most firms generate income by selling, others increasingly use different stream types, such as “lending or licensing a product or service, taking a cut of a transaction or relying on different sources of advertising” (Osterwalder, 2004). As selling occurs when a firm exchanges a product or service for money and gives away the rights over it from the transaction date on, lending is the activity of providing the rights to use a product to someone for a given period of time. On the other hand, licensing occurs when the owner of something permits someone to do or use it for a specific period and use limitations (e.g. patents). A different type of revenue stream is used when a firm takes a cut of a transaction that happened due to its intermediation and facilitation, which fee may be charged either in the form of percentage or a pre-determined amount. Finally, advertising is a revenue stream increasingly used by business, such as social media platforms, who charge company partners to use their platforms strategically to address target customers with partners’ own message.
Furthermore, companies apply one of the three main types of pricing mechanisms, which are fixed pricing, differential pricing and market pricing. Companies who apply fixed pricing mechanisms determinate a given unitary price and do not negotiate it according to volume or customers’ preferences. On the other hand, differential pricing mechanisms do alter unitary prices either based on customers’ preferences or are volume dependent, but do not alter according to real-time market conditions. Finally, market pricing stands for prices based on real-time market condition that comprise occurrences like bargaining, yield management (frequent on the sale of perishable assets, driven by inventory) and auctions.
The present study analyses how sharing economy and collaborative consumption platforms differ on the nature and type of revenue streams applied.
Cost Structure
Typically, different business models and industries differ on cost metric standards and profitability as software businesses, in general, experience larger profit margins and are
less capital intensive than the traditional retail industry as the process of expanding to a new market requires large investments related to new facilities, logistics, partnerships, and personal hires, contrasting with software businesses with easier to scale products and services. This element measures all the costs the firm incurs in order to create, market and deliver value to its customers” (Osterwalder, 2004). Typically, such costs comprise investments like the assets purchase, the management of partners networks, and the interests paid to capital lenders. The present study analysis how the many aspects of the cost infrastructure differ between sharing economy and collaborative consumption platforms.
Results
Sample
In order to analyze the differences and similarities between sharing economy and collaborative consumption platforms, this study will focus on platforms that act in the very same industries to minimize as much as possible external effects that could blurry the results. Unfortunately, as the literature on both platforms is limited, especially on collaborative consumption platforms, there are no references to actual companies that apply the collaborative consumption business model and respective industry. In fact, companies which the present study defines as collaborative consumption platforms, are occasionally mentioned in sharing economy literature and business reports. In result, to find examples of companies that apply such business model, the present study selected examples of companies that are referred to as sharing economy but that fit the present study definition of collaborative consumption platforms.
From such selection, examples of collaborative consumption platforms that compete with sharing economy platforms were found in two industries: (1) Car Sharing and (2) File Sharing.
(1) Car Sharing Industry
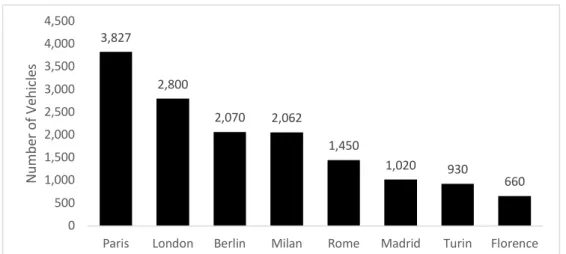
Within the car sharing industry, as multiple players were found applying both business models, the present study is focused on the European respective countries from the cities that use these services the most, which, according to Statista (2016) were France (Paris),
UK (London), Germany (Berlin), Italy (Milan, Rome, Turin, and Florence), and Spain (Madrid).
Figure 6: Number of car sharing vehicles in selected European cities in 2016
Within each of the selected countries, the main car sharing players were analyzed based on a European study performed by Statista in March 2019 about which car sharing services customers had used in the past twelve months for each country (all respondents had used at least one car sharing provider in the respective country in the past year), and a clear pattern of two main player in each country was clearly identified.
In France, the two main players were Ouicar and Drivy, with 40% and 32%, respectively, of customers reporting the usage (Statista, 2019a).
Figure 7:France Car sharing providers used in the past 12 months
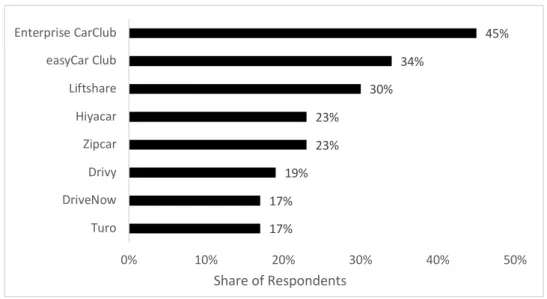
In the UK, the two main players were the Enterprise CarClub and easyCar Club (recently acquired by Turo), with 45% and 34% respectively, of customers reporting the
3,827 2,800 2,070 2,062 1,450 1,020 930 660 0 500 1,000 1,500 2,000 2,500 3,000 3,500 4,000 4,500
Paris London Berlin Milan Rome Madrid Turin Florence
Nu m be r o f V eh ic le s 40% 32% 17% 17% 13% 13% 11% 11% 0% 10% 20% 30% 40% 50% OuiCar Drivy Koolicar Renault Mobility Communauto Zipcar City Roul` Izzie Share of Respondents
usage (Statista, 2019b). Liftshare, the third most used car sharing provider in the UK according to the Statista study, is a ride sharing platform that do not comply with the present study requirements as, in contrast with others, it includes the driver in the service.
Figure 8: UK - Car sharing providers used in the past 12 months
In Germany, the two main car sharing players are car2go and DriveNow, with 54% and 33% respectively, of customers reporting the usage (Statista, 2019c).
Figure 9: Germany - Car sharing providers used in the past 12 months
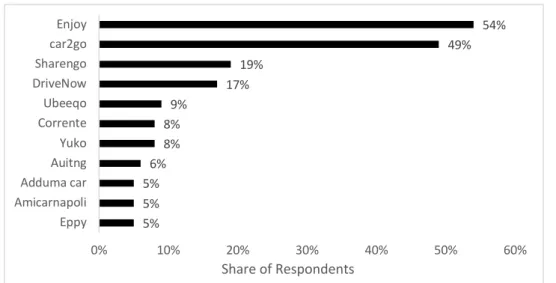
In Italy, the two main car sharing players were Enjoy and car2go, with 54% and 49% respectively, of customers reporting the usage (Statista, 2019d).
54% 33% 16% 14% 14% 13% 13% 12% 11% 7% 0% 10% 20% 30% 40% 50% 60% car2go DriveNow Free2Move cambio carsharing Drivy Flinkster Ford Carsharing SnappCar App2druve Oply Carsharing Share of respondents 45% 34% 30% 23% 23% 19% 17% 17% 0% 10% 20% 30% 40% 50% Enterprise CarClub easyCar Club Liftshare Hiyacar Zipcar Drivy DriveNow Turo Share of Respondents
Figure 10: Italy - Car sharing providers used in the past 12 months
In Spain, the market is extremely fragmented and the Statista study could not take clear conclusions on the main industry players as 43% of respondents answered other and the second most reported answer had only 21% (Statista, 2019e). As the study cannot provide clear and reliable conclusions on the main players, the present study does not select any player from the Spanish market.
Figure 11: Spain - Car sharing providers used in the past 12 months
All in all, the present study will cover the following companies regarding the car sharing industry (that apply the following business model): (1) DriveNow (collaborative consumption), (2) Enterprise CarClub (collaborative consumption), (3) Car2Go (collaborative consumption), (4) Enjoy (collaborative consumption), (5) Drivy (sharing economy), (6) Turo (sharing economy), and (7) OuiCar (sharing economy).
54% 49% 19% 17% 9% 8% 8% 6% 5% 5% 5% 0% 10% 20% 30% 40% 50% 60% Enjoy car2go Sharengo DriveNow Ubeeqo Corrente Yuko Auitng Adduma car Amicarnapoli Eppy Share of Respondents 43% 21% 20% 17% 11% 7% 0% 10% 20% 30% 40% 50% other Amovens Socialcar Carsharing Drivy Bipi Share of respondents
Figure 12: Sample List of Car Sharing Organizations (2) File Sharing
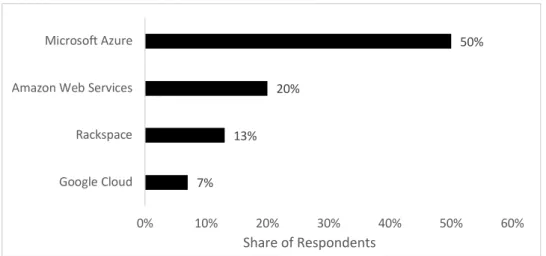
The file sharing industry comprises all organizations who enable individuals and organizations to upload and download content online. Within these companies, the present study found organizations who apply the sharing economy and others that apply the collaborative consumption business model, even though the market of collaborative consumption platforms is considerably more fragmented than the sharing economy’s. In fact, according to a study performed by Stata, Microsoft Corporation ranked as the top provider of cloud services around the world with its Microsoft Azure offer, serving as the primary service provider for around half of all organizations as of 2019. With significant distance to the Amazon Web Services (AWS) that reaches about 20% of the organizations worldwide.
Figure 13: Top primary service providers of cloud services in organizations worldwide as of 2019
On the other hand, the present study found peer-to-peer file sharing service providers that compete with those presented above, as they provide alternatives to transfer content
Company Business Model
DriveNow Collaborative Consumption Enterprise Car Club Collaborative Consumption
Car2Go Collaborative Consumption
Enjoy Collaborative Consumption
Drivy Sharing Economy
Turo Sharing Economy
OuiCar Sharing Economy
50% 20% 13% 7% 0% 10% 20% 30% 40% 50% 60% Microsoft Azure
Amazon Web Services Rackspace Google Cloud
online to other users. In contrast to the collaborative consumption platforms in this industry, the peer-to-peer market is not fragmented. In fact, BitTorrent represents 97% of the peer-to-peer file sharing market (Ramchandani, 2018). Given its supremacy in its market, the present study will use BitTorrent as the only example of sharing economy in the file sharing industry.
All in all, the present study will cover the following companies regarding the file sharing industry: (1) Microsoft Azure, (2) Amazon Web Services, and (3) BitTorrent.
Company Business Model Bittorrent File Sharing Windows Azure File Sharing
AWS File Sharing
Figure 14: Sample List of File Sharing Organizations Descriptive Analysis:
In the end, the present study will cover seven companies in the car sharing industry and three in the file sharing industry, totaling ten companies. Within the car sharing industry, three organizations apply the sharing economy business model and four organizations apply the collaborative consumption business model. On the other hand, within the file sharing industry, one company applies the sharing economy business model, while two companies apply the collaborative consumption business model. In total, forty percent of the observations apply the sharing economy business models, while the remaining apply the collaborative consumption business model.
# of Observations % of Total Observations
Sharing Economy 4 40%
Collaborative Consumption 6 60%
Total 10 100%
Figure 15: Descriptive Analysis of the Total Sample Value Propositions:
In the sample used, all of both car and file sharing companies shifted the frontier by either providing a better-quality service for the same price or by providing the same quality service for a reduced price.
As an example, free floating services such as car2go and DriveNow allow individuals to commute within most city locations as Taxis do, although for a much lower service price. Similarly, peer-to-peer car sharing companies, such as Turo, provide car rental to individuals for reduced prices in comparison to traditional rent-a-car services.
Figure 16: Shifts vs Extends the Value Frontier by Industry
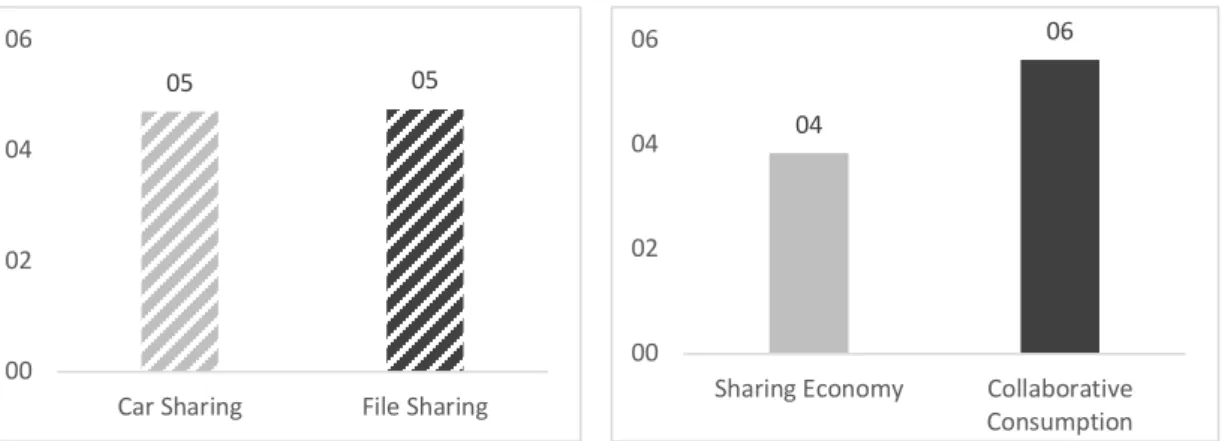
Although the number of value proposition references per company is similar between car and file sharing industries, significant discrepancies appear between sharing economy and collaborative consumption business models. In fact, the average number of value proposition references is of four point seven and of four point eight in the car and file sharing industry, respectively. On the other hand, the average number of value proposition references in sharing economy platforms is of three point eight, while it is of five point six in collaborative consumption platforms.
Figure 17: Average Number of Value Proposition References per Industry and Business Model 04 06 00 02 04 06
Sharing Economy Collaborative Consumption
Shifts Extends Total
Car Sharing 100% 0% 100% File Sharing 100% 0% 100% 05 05 00 02 04 06
Although the present study covers two recent and innovative business models, the results show that discrepancies exist within the sample used. The results show that the file sharing industry provides more value proposition references with more innovative values than the car sharing industry does. In fact, although the value proposition references of both industries score high innovation values with an average of 26% of the references scoring me-too level, the file sharing industry provides relatively more value proposition references that score excellence in innovation (43% vs 6%), while car sharing providers provide more me-too value proposition references (46% vs 7%).
Figure 18: Innovation per Industry Distributed
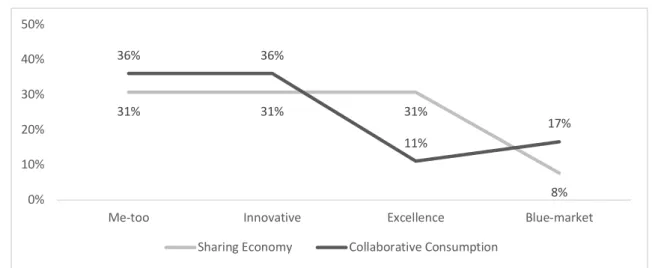
Although clear conclusions might be taken of the innovation level differences between industries, the same does not occur between business models. Even though the sharing economy and collaborative consumptions platforms have different innovation level distributions on their value proposition references, the fact is that the differences offset among each other. As collaborative consumption platforms score slightly higher in
me-too, innovative, and blue-market with an accumulated positive difference of nineteen
percentual points, the sharing economy scores twenty percentual points above the collaborative consumption platforms in excellence.
46% 34% 6% 14% 7% 36% 43% 14% 0% 10% 20% 30% 40% 50%
Me-too Innovative Excellence Blue-market Car Sharing File Sharing
Figure 19:Innovation per Business Model
As the results presented above refer to the entire sample, the present study found that the differences on innovation between sharing economy and collaborative consumption platforms differ within each industry. In fact, by focusing solely on the car sharing industry, the results show that sharing economy platforms provide relatively more value proposition references with higher innovation level than collaborative consumption platforms do as the first scores 25% in excellence and 13% in blue-market, while collaborative consumption platforms score zero percent and 15%, respectively.
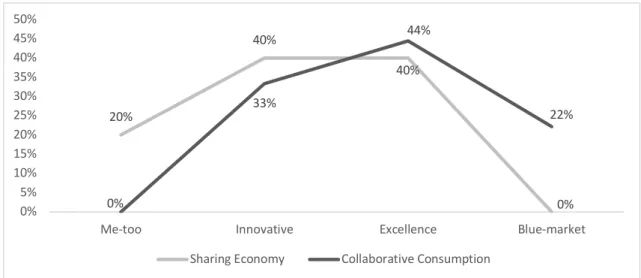
Figure 20: Innovation per Business Model within Car Sharing Industry On the other hand, by focusing only in the file sharing industry, results show that, in contrast with the car sharing industry, collaborative consumption platforms provide relatively more value proposition references with higher innovation level than sharing economy platforms do as the first scores 44% in excellence and 22% in blue-market,
31% 31% 31% 8% 36% 36% 11% 17% 0% 10% 20% 30% 40% 50%
Me-too Innovative Excellence Blue-market Sharing Economy Collaborative Consumption
38% 25% 25% 13% 48% 37% 0% 15% 0% 5% 10% 15% 20% 25% 30% 35% 40% 45% 50%
Me-too Innovative Excellence Blue-market Sharing Economy Collaborative Consumption
Figure 21: Innovation per Business Model within File Sharing Industry Distributed Regarding the price level of value proposition references, the results clearly show the low-cost service that both car and file sharing industries provide relative to former and existing alternatives. In fact, car sharing providers enable individuals to commute within city locations cheaply in comparison to taxis and other car hailing companies, such as Uber, and provide a wide range of value proposition references for free, such as free parking and environmentally friendly alternative. Moreover, the file sharing industry is reportedly provides better alternatives for cheaper prices than corporations would instead be able to build by themselves, due to large economies of scale. Besides that, file sharing providers provide, on average, more expensive value proposition references to clients relative to alternatives than car sharing providers do. In fact, both industry providers do not offer any high-end priced value proposition reference, while 21% of file sharing providers’ value proposition references are market prices and car sharing providers still do not provide any market priced value proposition reference.
20% 40% 40% 0% 0% 33% 44% 22% 0% 5% 10% 15% 20% 25% 30% 35% 40% 45% 50%
Me-too Innovative Excellence Blue-market Sharing Economy Collaborative Consumption
Figure 22: Price Level per Industry
Regarding the comparison between sharing economy and collaborative consumption business models, on average, the second charges higher prices per value proposition reference than sharing economy platforms do. In fact, none of them charge high-end prices and none of the sharing economy platforms charge market prices, neither. On the other hand, collaborative consumption platforms charge market prices in eight percent of the value proposition references. Additionally, the former also charges economy prices in 28% of the value proposition references, while sharing economy platforms only do it in 23% of the references.
Figure 23: Price Level per Business Model 77% 23% 0% 64% 28% 8% 0% 0% 10% 20% 30% 40% 50% 60% 70% 80% 90%
Free Economy Market High-end
Sharing Economy Collaborative Consumption 74% 26% 0% 0% 50% 29% 21% 0% 10% 20% 30% 40% 50% 60% 70% 80%
Free Economy Market High-end
Even though collaborative consumption platforms charge, on average higher prices than sharing consumption platforms taking the all sample into consideration, the fact is that the same rationale does not apply in the car sharing industry specific case. Although the differences between the pricing of both business models do not differ largely, and, in fact, none of them charge nor market nor high-end prices, sharing economy platforms charge economy prices in 23% of the value proposition references, while collaborative consumption platforms do it in 17% of the references.
Figure 24: Price Level per Business Model in the Car Sharing Industry Logically, the opposite occurs in the file sharing industry, where, on average, collaborative consumption platforms charge higher prices per value proposition reference than sharing economy platforms do. In fact, sharing economy platforms do not charge users anything in none of its value proposition references, while collaborative consumption platforms charge market prices in 33% and economy prices in 44% of the references. 38% 23% 0% 0% 58% 17% 0% 10% 20% 30% 40% 50% 60% 70%
Free Economy Market High-end
Figure 25: Price Level per Business Model in the File Sharing Industry Customer Interface
Customer Segments
As the present study covers business of different natures regarding both business model and industry, it is expected that the type of business relation between the service provider and the user differs within the sample used. The results show that 20% of the sample has, most of the times, a B2B relation with the clients, while 40% of the corporations have a B2C relation and the remaining 40% have a C2C relation. Moreover, as it was expected, 100% of the sharing economy platforms have a C2C business relation and none of the collaborative consumption platforms have a C2C business relation, given the fact that the provider is, by definition, a corporation. Within the collaborative consumption platforms, results show that 33% have mainly a B2B relation, while the remaining 67% have a B2C relation.
B2B B2C C2C Total
Sharing Economy 0% 0% 100% 100%
Collaborative Consumption 33% 67% 0% 100%
Figure 26: Business Relation Type per Business Model
Furthermore, although the study already proved that sharing economy platforms use C2C relations regardless of the industry that they are in, collaborative consumption platforms have an opposite behavior as all the platforms with such business model in the car sharing industry have a B2C relation while all that are present in the file sharing industry have mostly a B2B relation.
100% 0% 0% 0% 22% 44% 33% 0% 10% 20% 30% 40% 50% 60% 70% 80% 90% 100%
Free Economy Market High-end
B2B B2C
Car Sharing 0% 100%
File Sharing 100% 0%
Figure 27: Business Relationship Type per Industry for Collaborative Consumption Platforms
As it was expected, car and file sharing industries target different customer segments, as it is clearly perceived from the analysis of graphic bellow. Furthermore, within the car sharing industry, millennials represent 43% of the target customer segments and it is the most targeted customer segment, while the second largest are travelers (21%), followed by corporate clients (14%) and product providers (14%). On the other hand, the most targeted customer segment within the file sharing industry are corporations which represent 33% of the targeted customer segments list, followed by government entities (22%). Besides that, from the analysis of the graphic it is clear that sharing economy platforms target a wider range of customer segments than collaborative consumption platforms do
Figure 28: Customer Segment per Industry
Regarding the differences in the customer segmentation between sharing economy and collaborative consumption platforms, it is also clear that sharing economy platforms target a wider range of customers than collaborative consumption platforms, with the first
43% 7% 21% 14% 14% 0% 0% 0% 0% 11% 0% 0% 0% 11% 33% 11% 11% 22% 0% 5% 10% 15% 20% 25% 30% 35% 40% 45% Mi lle nn ia ls Sm al l Sa ve rs Tr av el er s Co rp ora te Cl ie nt s Pr od uc t Pr ov id er s Co rp ora tio ns Co ns um er E le tro ni cs Ma nu fa ct ur er s He av y Da ta U se rs Go ve rn m en t
targeting seven different customer groups and the former targeting four different customer groups. Moreover, both business models have millennials as the most frequently targeted customer segment as it is the case in 40% for collaborative consumption platforms and 23% for sharing economy platforms, although the same percentage applies to the former for travelers and product providers. Regarding collaborative consumption platforms, the three other targeted consumer segments (corporate clients, corporations, and government institutions) appear 20% of the times, each.
Figure 29: Customer Segment per Business Model Channels
As companies use different types of channels to reach different clients at different times for different purposes, results show that the average number of channels types used by sharing economy and collaborative consumption platforms do not differ largely (3,7 and
23% 8% 23% 0% 23% 8% 8% 8% 0% 40% 0% 0% 20% 0% 20% 0% 0% 20% 0% 5% 10% 15% 20% 25% 30% 35% 40% 45% Mi lle nn ia ls Sm al l Sa ve rs Tr av el er s Co rp ora te Cl ie nt s Pr od uc t Pr ov id er s Co rp ora tio ns Co ns um er E le tro ni cs Ma nu fa ct ur er s He av y Da ta U se rs Go ve rn m en t