The impact of health consciousness on consumers’
purchase intention and the mediating effect of
ingredients’ awareness
An analysis on Chocolate
Dissertation by
Gabriela Oliveira Andrade
Student Number: 152116283
Dissertation written under the supervision of
Prof. Paulo Romeiro
Dissertation submitted in partial fulfilment of requirements for the MSc in Management with Specialization in Strategy and Entrepreneurship at CATÓLICA-LISBON School of Business &
Economics
ABSTRACT
Title: The impact of health consciousness on consumers’ purchase intention and the mediating
effect of ingredients’ awareness: An analysis on Chocolate
Author: Gabriela Oliveira Andrade
Over the past few years a dramatic move has taken place in the food industry and people become more and more concerned about their own health. Following this trend, retailers are also taking actions, not just by creating areas in the supermarket dedicated to healthy food products but also having, on the same shelf, the healthy option of the same product.
This entire study consists on an investigation about if the health consciousness impacts or not the purchase intention, giving a special attention to the role of the ingredients’ awareness, going deep on sugars. The pushback against sugar comes as, in general, consumers have begun to take a greater interest in what makes up their food and diets. The health conscious took umbrage with not only how much sugar was put into processed food, but also how many products included added sugars.
The methodology used for this investigation includes both primary and secondary data, encompassing one survey.
Results obtained with this study suggest that Purchase Intention is explained by Health Consciousness as well as by the Ingredients’ Awareness. In addition, Ingredients’ Awareness plays a key role in mediating some of these relationships.
SUMÁRIO
Título: O impacto da consciência de saúde na intenção de compra dos consumidores e o efeito
mediador da perceção dos ingredientes: Uma análise ao chocolate.
Autor: Gabriela Oliveira Andrade
Ao longo dos últimos anos ocorreu um novo e importante movimento na indústria alimentar, com os consumidores a tornarem-se crescentemente preocupados com a sua saúde. Respondendo a esta tendência, os grandes retalhistas têm vindo a tomar medidas, não só começando a apresentar num mesmo linear as opções standard e mais saudáveis para um mesmo tipo de produto, como inclusivamente criando nas lojas áreas específicas e perfeitamente individualizadas, dedicadas a produtos alimentares saudáveis.
Todo este estudo consiste numa investigação sobre se, e em que medida, a consciência da saúde por parte dos consumidores afeta a sua intenção de compra, dando especial relevo ao papel da perceção que os mesmos têm relativamente aos ingredientes, particularmente e com maior profundidade no que respeita aos açúcares.
Em geral, a repulsa pelo açúcar decorre, da crescente atenção dos consumidores relativamente à composição dos seus alimentos e dietas. A consciência da saúde surge assim em consonância não só com o teor de açúcar adicionado aos alimentos processados, mas também com a quantidade de produtos aos quais foram adicionados açúcares.
A metodologia utilizada para esta investigação inclui dados primários e secundários,
envolvendo um questionário.
Os resultados obtidos com este estudo sugerem que a Intenção de Compra é explicada pela Consciência da Saúde, bem como pela Perceção dos Ingredientes, desempenhando esta um papel chave na mediação de algumas dessas relações.
ACKNOWLEDGEMENTS
In first place, to my family, saying thank you is not enough to express all the gratitude I feel for them. They always have my back, they support me in every choice I make and without them I would not be able to get my Master degree, from the bottom of my heart, thank you for being always with me.
Additionally, a special thanks to my colleagues at Danone Group for sharing their valuable knowledge with me during my summer internship in 2017 and whose work, in part, was an inspiration for the development of this thesis, it was a pleasure for me to work with them, especially with João Pedro Rego.
Also, I would like to show my appreciation to my supervisor, Professor Paulo Romeiro, for all his patience, insightful advice, and constructive feedback during the entire period of research work.
Last but not least, to my boyfriend and all my amazing friends who are always by my side and always try to make things easier than they are, I am so grateful to have all of you.
TABLE OF CONTENTS
ABSTRACT ... III SUMÁRIO ... IV ACKNOWLEDGEMENTS ... V TABLE OF CONTENTS ... VI TABLE OF FIGURES ... VIII TABLE OF TABLES ... IX CHAPTER 1: INTRODUCTION ... 1 1.1BACKGROUND ... 1 1.2PROBLEM STATEMENT ... 2 1.3RELEVANCE ... 2 1.4RESEARCH METHODS ... 3 1.5DISSERTATION OUTLINE ... 3
CHAPTER 2: LITERATURE REVIEW AND CONCEPTUAL FRAMEWORK ... 4
2.1. AWARENESS ... 4
2.1.1. Ingredients’ awareness ... 4
2.2. PRODUCT INGREDIENTS ... 5
2.2.1. Added sugar vs. Natural occurring sugar ... 5
2.2.2. Sugar substitute: Stevia ... 6
2.3. HEALTH CONSCIOUSNESS ... 7
2.3.1. Health consciousness and Ingredients’ awareness ... 7
2.3.2 Health consciousness and Purchase intention ... 8
2.4. ATTITUDE AND PURCHASE INTENTION... 8
CHAPTER 3: METHODOLOGY ... 10
3.1REVIEW OF CONCEPTUAL MODEL AND RESEARCH APPROACH ... 10
3.2SECONDARY DATA ... 10
3.3PRIMARY DATA ... 10
3.3.1 Data Collection ... 11
3.3.2 Measurement / Indicators ... 11
3.3.3 Data Analysis ... 13
CHAPTER 4: RESULTS AND DISCUSSION ... 14
4.1SAMPLE CHARACTERIZATION ... 14
4.2MEASURES RELIABILITY ... 23
4.3RESULTS FROM THE HYPOTHESIS TESTING ... 24
4.3.1 Hypothesis 1: The ingredients’ awareness will affect the purchase intention. ... 24
4.3.2 Hypothesis 1a: The awareness of higher Cocoa % in chocolates affects the purchase intention for consumers that are high health consciousness. ... 25
4.3.3 Hypothesis 1b: The awareness of different types of sugar affects differently the purchase intention. ... 25
4.3.4 Hypothesis 1c: The awareness of "No added sugar" has a higher impact than "With Stevia" on consumers’ purchase intention. ... 26 4.3.5 Hypothesis 2: Health consciousness impacts positively the ingredients’ awareness. ... 27 4.3.6 Hypothesis 3: Health consciousness positively impacts the purchase intention. ... 27 4.3.7 Hypothesis 4: Ingredients’ awareness mediates the relationship between health
consciousness and purchase intention. ... 28 CHAPTER 5: CONCLUSIONS AND LIMITATIONS ... 31
5.1MAIN FINDINGS &CONCLUSIONS ... 31
(H4): Ingredients’ awareness mediates the relationship between health consciousness and purchase intention ... 33
5.2ACADEMIC/MANAGERIAL IMPLICATIONS ... 34 5.3LIMITATIONS AND FURTHER RESEARCH ... 34 REFERENCE LIST ... I
APPENDICES... V APPENDIX 1-SURVEY (ENGLISH VERSION –ORIGINAL) ... V APPENDIX 2–SPSSOUTPUT –DEMOGRAPHIC ... XIII APPENDIX 3–SPSSOUTPUT –MEASURE VARIABLES ... XV APPENDIX 4–SPSSOUTPUT –INFERENTIAL STATISTICS ... XVII APPENDIX 5–SPSSOUTPUT –MEDIATION ... XXV
TABLE OF FIGURES
Figure 1: Conceptual Framework ... 9
Figure 2: Relationship with chocolate (n = 768) ... 14
Figure 3: Health consciousness (classification) (n = 701) ... 18
Figure 4: Ingredients' awareness (classification) (n = 701) ... 20
Figure 5: Sugars' awareness (classification) (n = 701) ... 20
Figure 6: Purchase intention (classification) (n = 701) ... 23
Figure 7: Variable Relationship for total sample (H1) ... 24
Figure 8: Variable Relationship for consumers that are high health consciousness (H1a) ... 25
Figure 9: Variable Relationship for total sample (H1b and H1c) ... 26
Figure 10: Variable Relationship for total sample (H2) ... 27
Figure 11: Variable Relationship for total sample (H3) ... 28
Figure 12: The mediating role of ingredients’ awareness on the relationship between health consciousness and purchase intention for total sample (H4) ... 30
TABLE OF TABLES
Table 1: Proposed constructs, number of scale items and relevant literature source ... 12
Table 2: Demographic characteristics (n = 701) ... 15
Table 3: Chocolate characteristics ... 16
Table 4: Chocolate characteristics (continuation) ... 17
Table 5: Health consciousness (n = 701) ... 18
Table 6: Ingredients' awareness (n = 701) ... 19
Table 7: Chocolate “No added sugars” (n = 701) ... 21
Table 8: Ranking of how natural the ingredients are (n = 701) ... 21
Table 9: Purchase a chocolate that has the following ingredients (n = 701) ... 22
Table 10: Purchase intention (n = 701) ... 22
Table 11: Survey items’ reliabilities ... 24
CHAPTER 1: INTRODUCTION
1.1 Background
Over the years, consumption patterns have been changing rapidly and consumers have become increasingly concerned about factors directly related with health (Moorman & Matulich, 1993). Issues related with food safety such as genetic modification, hormones, pesticide residue limit and food additives have been contributing to the concerns regarding food consumption and, as a consequence, consumers are more aware about the importance of the foods that are healthier, nutritious, environmentally-friendly and safe for them when they are making purchase decisions on food (J. Paul & Rana, 2017). With all these concerns, consumers are taking measures avoiding the consumption of added sugar foods and high-calorie foods in order to decrease the possibility to become obese and to have related disorders such as heart disease or diabetes (Frost & Sullivan, 2007). According to Diplock et al, 1999, it is understood by functional foods the foods that give beneficial effects to the human body, beyond adequate nutritional effects, in a way that is relevant to either an improved state of health and well-being and/or reduction of risk of diseases. Particularly, the added sugar on foods is the major calories source with no additional nutritional value and it has been related to several metabolic abnormalities and other health problems, such as cardiovascular diseases and diabetes as mentioned before (Lustig, Schmidt, & Brindis, 2012). It is important to know that our ancestors only had access to sugar as fruit at certain times of the year (harvest time), or as honey, kept by bees. But over the years, sugar has been added to about all processed foods and consumer choice has been limited (Lustig et al., 2012). So, I have decided to take a trip to the supermarket to see what is happening regarding the sugar, and I have realized that the industries are really making an effort to take off sugar in several products. I was investigating and I took a look on breakfast cereals, beverages, chocolate bars, bread, gums and so on, and it is becoming real, I saw, in some packages, that they are concerned about the claims that they are advertising on the front of pack: “less 30% of sugar”, “Naturally occurring sugar” or “Non added sugar”. In particularly, on chocolate bars and on beverages, like fruit juices, they are even substitute the sugar by natural sugar like Stevia. After this, I have decided to approach chocolate bars because it was one category that aroused my interest and lately it is a very popular topic at a world-wide level. I felt that the chocolate’s industry is becoming aware about the harms of the sugar on chocolate bars and as Torri et al, 2016 exposed on their study, the demand for reduced and zero-sugar food products containing cocoa has expanded constantly. So, the industries are turning them a
little bit healthier for the consumers, starting by having chocolate without added sugar or even substitute the sugar by natural substitutes like Stevia. In order to see the impact that this change, to the substitute of sugar – Stevia and the non-added sugar on the products has on the purchase intention, this dissertation propose to study the impact of the non-added sugar and the natural substitute of sugar have on the purchase intention of chocolate.
1.2 Problem Statement
The aim of this research is to understand the level of health consciousness the consumers have regarding the ingredients’ awareness and how this impacts the purchase intention, in other words, if the ingredients’ awareness can explain the relationships between consumer health consciousness and purchase intention for chocolate.
This problem statement it substantiates itself in the following research questions: RQ1: What is the effect of the ingredients’ awareness on the purchase intention? RQ2: Are the consumers willing to switch to the healthy substitutes of sugar? RQ3: Can Stevia keep the purchase intention?
RQ4: What is the relationship between Health Consciousness and Purchase Intention?
1.3 Relevance
Sugar is a current issue that has been infiltrated over the years in our diet without us even realizing it. We can find it in almost all the foods we consume every day, making it almost impossible to avoid it. Despite the fact that there are people concerned about the problems related with the sugar, there are still many people who do not care about this but the US Department of Agriculture (USDA) and the European Food Safety Authority believe that “attention should be turned to the ‘added sugar’” (Lustig et al., 2012) and so I believe that is important to study how aware are the consumers about the sugar and how do people react to the lack of sugar on goods or the substitution of sugar by natural sweeteners as stevia if they are informed about the health malfunctions of sugar. Overall, my wish is that companies realize that is necessary to cut back on sugar or replace it with natural substances so that they can reduce the disease rates caused by too much sugar consumption.
1.4 Research methods
With the purpose of getting answers to the research questions, mostly primary data will be used. A survey will be developed and it will be distributed via online. After obtaining enough answers, that data will be treated quantitatively applying frequencies (absolute and percentages), measures of central tendency (arithmetic mean and median), measures of dispersion or variability (minimum value, maximum value and standard deviation), coefficients (Cronbach’s and Pearson’s Alpha) and statistical tests (Pearson's correlation coefficient significance test, ANOVA test and Sobel test) and simple linear regression.
This method can be very effective because it does not require an interviewer, i.e. respondents will be more willing to share the information that will be needed, it is convenient for them, because they can answer wherever they are, there are no costs involved for the researcher and it can be accessed in real time.
1.5 Dissertation outline
The next chapter will guide the study by presenting a literature review and the corresponding hypothesis. The literature review will explain and describe how relevant and impactful each of the variables are for the purchase intention for Chocolates. The third chapter will answer to the hypothesis that will be studied through the methodology used by the construction of a questionnaire where important data can be obtained. On the fourth chapter, and looking at the results of the questionnaire, an analysis will be done and some insights will come. Lastly, the fifth chapter is where some conclusions will be drawn as well as its limitations and some advices for further investigations on this area of study.
CHAPTER 2: LITERATURE REVIEW AND CONCEPTUAL FRAMEWORK
Throughout this chapter some important concepts will be approached to achieve the main goals of this research and to know what some authors have discovered so far. Firstly and with the purpose to go further, it will be important to talk about the awareness of the ingredients. Further ahead, and more specific about the sugar, a comparison will be done between the added sugar, the natural occurring sugar and the natural substitute of sugar – Stevia. Additionally, it will be approached the different levels of health consciousness of consumers and the attitude related with the purchase intention.
Lastly, from what previous authors have discovered, some hypothesis will be formulated.
2.1. Awareness
2.1.1. Ingredients’ awareness
When brand awareness is not present on consumers’ mind they cannot form intention to buy (Rossiter, J. R. & Percy, 1987). According to (Bornkessel, Bröring, Omta, & van Trijp, 2014), the consumer awareness of the ingredients on functional foods is important for healthy food choices and it is a precondition that is necessary for general knowledge (P. J. Paul, Olson, & Grunert, 1999). In this circumstance, ingredient awareness involves consumers’ familiarity with some ingredients whereas the following steps from ingredient awareness coming to knowledge might be the understanding of the underlying health benefits of certain food ingredients. Also, the acceptance and the consumers’ perception of functional foods are influenced by the ingredient awareness (Pounis et al, 2011). In this sense, functional foods can be interpreted as the carrier for functional ingredients that brings certain health benefits. Thus, the term ingredient awareness has the focus on the antecedents of knowledge about food ingredients themselves. As Howlett, Burton, Bates, & Huggins, 2009 demonstrated, the provision of nutrient information can affect consumers' purchase intentions, more specifically, “higher motivation to process nutrition information was positively related to repurchase intentions”. Also, according to Howlett, Burton, Bates, & Huggins, 2009, after the exposure to the nutrition information, repurchase intentions should increase or remain stable. Finally, also supported by DiPietro, Remar, & Parsa, 2016, “the awareness of ingredients was found to be a statistically significant predictor of purchase behavior”. Which allows to predict the following:
Cocoa (Theobroma Cocoa L.) is one of the most appreciated foods in the world, it is a tree, a tropical one, from which the dry beans are the raw material of chocolate (Loureiro et al., 2017). It is considered from high quality, in terms of health benefits, if a baking chocolate contains 70% or more of raw cocoa (Jr., Forehand, & Angle, 2014). In every chocolate the manufacturers are obliged to declare the cocoa content, which is a good way to evaluate the quality of chocolate by the consumers (FSA, 2009). According to Sokolov, Pavlova, Klosterhalfen, & Enck, 2013, the high percentage of cocoa in chocolates contribute to good health maintenance due to phenolic compounds. So it can be stated that this high percentage of cocoa in chocolates will positively impact the purchase intention for consumers that are high health consciousness:
Hypothesis 1a: The awareness of higher Cocoa % in chocolates positively impacts the
purchase intention for consumers that are high health consciousness.
2.2. Product ingredients
2.2.1. Added sugar vs. Natural occurring sugar
Sugars can naturally occur in some foods and beverages or added as ingredients in others. Fundamentally, the flavor is the reason why sugar is added to beverages and foods but it can also have a technical function by enhancing the texture, the color and can help to ensure a proper fermentation and preservation. The 2015–2020 Dietary Guidelines (DGA) refer to added sugars as “syrups and other caloric sweeteners used as a sweetener in other food products”. U.S. Food and Drug Administration (FDA) established the official definition of added sugars as sugars that are, besides other things, packaged as a bag of sugar, added during the production process and present on syrups, honey, concentrated fruit or vegetable juices. On this definition the FDA does not include the concentrated juices of fruits or vegetables from 100 percent juice, also is considered containing naturally-occurring sugars when present to whole foods that contain lactose (from milk), sucrose, glucose or fructose (from fruit). Other sweeteners such as low-calorie sweeteners (e.g. aspartame) and no-low-calorie natural sweeteners (e.g., stevia leaf extract, honey and fruit sugar) are also not considered added sugars.
The innate preference for sweetness does not necessarily leads to obesity or other diet-related diseases because if the foods contain natural-occurring sugars this tend to be highly nutritious. But the main problem occurs when sugars are concentrated, refined and consumed in large amounts (Ludwig, 2009). The use of products that are reduced in added sugars are a good strategy for weight control (Fitch, Keim, & Academy of Nutrition and Dietetics, 2012).
The DGA and FDA want to keep consumers informed about the problems that come with the added sugars and so, they want to maintain healthful dietary practices by increasing the awareness of the amount of added sugars in foods and beverages.
The reality is that there is a wide market of consumers who demand for sugar-free chocolates related to their concerns about diabetes, for being one of the fastest-growing chronic diseases. Also the US Department of Agriculture (USDA) and the European Food Safety Authority believe that “attention should be turned to added sugar”. And so, to meet this demand, some alternatives, as low calorie sweeteners, have to be implemented on chocolates (Rodriguez Furlán, Baracco, Lecot, Zaritzky, & Campderrós, 2017), but here the main challenge is related to the changes in product texture and flavor, which can compromise the success in the marketplace due to the reduction of sugar content (Raaij, Joop van, Hendriksen, Marieke, Verhagen, 2009).
Then, this leads to predict the following:
Hypothesis 1b: The awareness of different types of sugar, impacts differently the purchase
intention of chocolate.
2.2.2. Sugar substitute: Stevia
To increase sugar-added reduction it is important to approach other sweeteners but, at the same time, the consumer has to have the perception that the liking and the sweet taste were kept (Li, Lopetcharat, & Drake, 2015). A greater than 30% sugar reduction affects the liking of a certain product because sweet taste is a driver of liking for several foods such as chocolates (de Melo, Bolini, & Efraim, 2009).
Stevia rebaudiana Bertoni, generally known as Stevia, is an ancient sweet herb native to Paraguay. The plant, more specifically the leaves, can have a sweetening effect until 300 times sweeter than saccharose (Kamarulzaman, Jamal, Vijayan, & Ab. Jalil, 2014) and can be predominantly helpful to those suffering from diabetes, obesity, heart disease and even dental caries (Ghanta, S., Banerjee, A., Poddar, A., & Chattopadhyay, 2007) or, on the other hand, it can be used by consumers wishing to reduce the daily calorie intake (Azevedo, Ferreira, Luccas, & Bolini, 2016). In order to address consumers’ demands about reducing sugar intake through chocolate, sugar is increasingly substituted by sweeteners. However, for long-term consumption of low-calorie chocolate, it must be examine about the consumer-acceptance of low-calorie sweeteners (Li et al., 2015).
According to the research of Patterson, Sadler, & Cooper, 2012, with the “no added sugar” claim, consumers expect a similar and meaningful reduction on calories equal to the level of the sugar that would be taken off from the good. From the way that consumers see, they prefer “no added sugar” by thinking that is more “natural” than “taking something out” because the most of the consumers associate this second with a replacement of the same quantity that were taken off by something that is not considered to be natural. And this way this would negatively impact the purchase intention, which allows to predict the following:
Hypothesis 1c: The awareness of “No added sugar” has a higher impact than “with Stevia”
on consumers’ purchase intention.
2.3. Health consciousness
2.3.1. Health consciousness and Ingredients’ awareness
Health consciousness refers to the degree to which health concerns are incorporated into a person's daily activities (Jayanti & Burns, 1998).
Moorman & Matulich noted in 1993 that high health consciousness consumers perform consistent health behaviors (healthy food choices), and Mai & Hoffmann realized, in 2012, that people with high health consciousness pay more attention to nutrition facts, such as information about sugar content, than people with low health consciousness. Also supported by Gould, 1988, he correlates health consciousness with healthful dietary behaviors, indicating that health-conscious people are more likely to consume vitamins and avoid high calorie foods, like the ones with added sugars, than those who are not health conscious. According to Park, Yoon, Cho, & Haugtvedt, 2013, high health consciousness consumers are more disposed to actively seek out nutritional knowledge or enhanced knowledge about nutrition, which leads to healthy choices like low-fat alternatives, vegetables and fruits compared to those individuals with low health consciousness. Also Jayanti & Burns, 1998 found that consumers who have high health consciousness tend to take preventative health behaviors and so the availability of ingredients’ information will also influence purchase behavior (Zhang, H. Y., & Wang, 2009). It was stated by Gould, 1988; Bellisle & Drewnowski, 2007; Ludwig, 2009; Anderson, Foreyt, Sigman-Grant, & Allison, 2012 and Gardner et al., 2012 that to manage the body weight, the sugar intake has to be lower, which leads to the replacement of this sugars by the low-calorie sweeteners. For the current study, high health conscious consumers are defined as the ones that: have “healthful dietary behaviors”; avoid “high calorie foods, like the ones with added sugars”;
give “preference to foods that are superior-quality” and take “preventive health behaviors”. According to Kraft, 1993, a consumer who is not stimulated by preventive behaviors (=Low health consciousness) is less likely to read the ingredients’ composition on food labels and so he is not aware about the ingredients that the product has. This is also supported by Mai & Hoffmann, 2012 where they stated that consumers with low health consciousness are more likely to make decisions based on heuristic cues, such as promotion signals, product country of origin , website interactivity or price and not on the ingredients’ composition on food labels. Which leads to the following hypothesis:
Hypothesis 2: Health consciousness positively impacts the ingredients’ awareness.
2.3.2 Health consciousness and Purchase intention
Loebnitz & Grunert, 2017 reached the conclusion that consumers with high level of health consciousness only purchase hedonic food products if the product benefit is explicit through the nutrition claims.
Results showed that health consciousness is a significant predictor of purchase decisions (DiPietro et al., 2016). Kumar, 2014 states that health-conscious people give preference to foods that are superior-quality and as a consequence they are willing to pay a higher price for those products. Therefore the following hypothesis can be formulated:
Hypothesis 3: Health consciousness positively impacts the purchase intention.
2.4. Attitude and Purchase intention
According to Baron, Robert & Byrne, Donn & Griffitt, 1974, an attitude is a lasting, general evaluation of people (including one-self) toward an object, an advertisement, or an issue. Allport, 1935 said that an attitude is "a mental and neural state of readiness, organized through experience, exerting a directive or dynamic influence upon the individual's response to all objects and situations with which it is related".
It is important what people think about the product features, and this is having to do with the personal values, they create a favorable or unfavorable attitude towards a certain good or a service. The final decision of buying or not buying is influenced by people's beliefs regarding a brand or even a product (Kahle, Beatty, & Homer, 1986).
Consumer’s purchase intention is influenced by the attitude which frequently form the basis for consumer behavior and actions (Goldsmith, Lafferty, & Newell, 2000; Keller, 2003). Several research studies have proven that purchase behavior is predicted by the strength of the attitude (Fishbein & Ajzen, 1975), the more positive the attitude towards a product, the higher the buying intentions will be (Chiu & Leng, 2016). Previous research revealed that health consciousness fosters purchase intentions (Lockie, Lyons, Lawrence, & Mummery, 2002).
Hypothesis 4: Ingredients’ awareness mediates the relationship between health
consciousness and purchase intention.
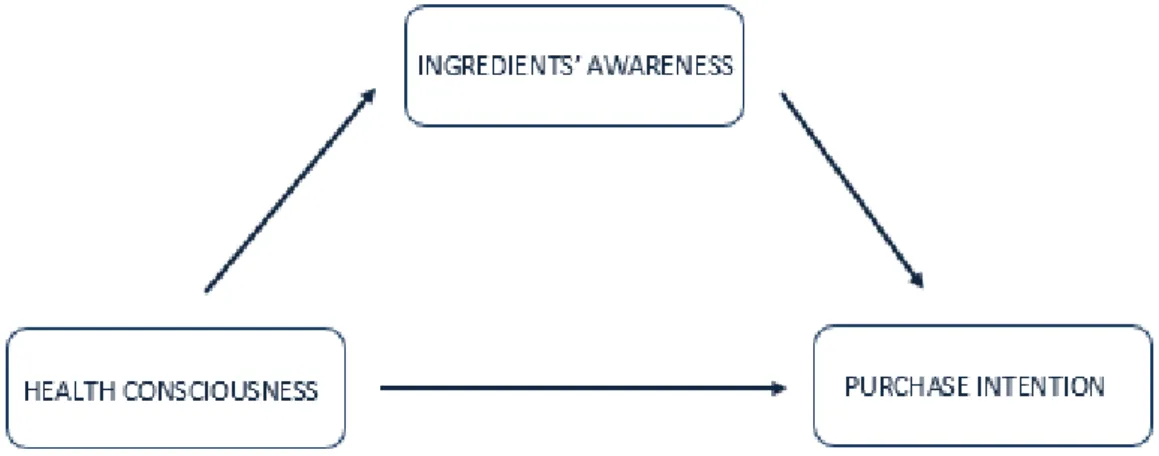
In order to better understand the present study, figure 1 shows the conceptual framework where the variables of the study, the relationship between them and the hypothesis that will be tested are visually better explained. The model illustrates the effect of health consciousness on consumers’ purchase intention. The mediating effects of ingredients’ awareness are also investigated. All the constructs presented in the model have been previously studied.
CHAPTER 3: METHODOLOGY
Followed by the literature review, the methodology chapter will describe the exact steps that will be undertaken to address the hypothesis done in previous chapter, more specifically, through which techniques the data will be collected and the statistical tests that will be more suitable to test the research hypothesis previously proposed.
3.1 Review of Conceptual Model and Research Approach
As already explained in the first chapter, the conceptual framework of this dissertation has two levels of health consciousness of the consumer, High and Low, and it is predicted that the ingredients’ awareness mediate the relationship between the level of health consciousness and the purchase intention of chocolate.
In 2013, Creswell has defined three different kinds of research approach: Qualitative, quantitative and a mix of both. The author described qualitative research as a way to explore and understand the meaning individuals or groups ascribe to a social or human problem and quantitative research as a way to test objective theories by examining the relationship among variables to posteriorly being analyzed using statistical procedures. Hereupon, and in order to accomplish the proposed objectives of this dissertation, the quantitative approach is the one that most applies to it. Moreover, by adopting a qualitative approach, this could be misleading by not allowing us to generalize the results (Creswell, 2013).
One key way to gather some quantitative data is through a survey/questionnaire, which rely on asking the same question in the same way to a large number of people and obtaining a lot of responses to test the specific hypothesis. These responses are then analyzed using statistical techniques to obtain information that can be generalized about the whole population and so this was the technique that most applied to approach this research.
3.2 Secondary Data
In the previous chapter, the secondary data were collected as a literature review from top journals and academic articles. Here some data and information were gathered in order to gain a more in-depth understanding about each one of the variables and then the relationship that exists between them.
3.3 Primary Data
For the purpose of this research, primary data were collected, leading to the formulation of the hypothesis, and then analyzed through the statistical software – SPSS.
3.3.1 Data Collection
In order to invite as many respondents as possible an online survey was shared on Facebook and delivered by email. The only mandatory requirement is that the participant has to be part of the population that consumes and/or purchases chocolates, since other people who do not fit in any of these conditions do not have perception about the product that was subject of study.
According to Marktest, 2016, in 2015, 67.5% of the Portuguese residents over 15 years old, refer they have eaten chocolate in the previous twelve months (chocolate bars or individual chocolates).
In order to obtain data just from people that consumes and/or purchases chocolates, an initial question was made to perceive if the respondent consumes and/or purchase chocolates. Then, to perceive who the High and Low health consciousness consumers were, a second group of questions was made. After this a third and a forth block of questions were made to, respectively, perceive the ingredients’ awareness that people have and their purchase intentions. Lastly, and to collect few basic data from the respondents, a fifth block of questions were asked about: age, gender, education and occupation. All the questions were closed-ended type of: multiple-choice and rating scales.
3.3.2 Measurement / Indicators
In first place, and in order to test the hypothesis previously proposed on the literature review chapter, an online questionnaire was created through Qualtrics to measure the relationship between the dependent variable: Health Consciousness; and the independent variable: Purchase intention; mediated by the Ingredients’ Awareness.
To measure consumers’ perceived level of health consciousness (High vs. Low) and ingredients’ awareness, it was asked to the respondents to indicate how much they agreed with each statement on a 5-point scale, from 1 to 5 (1 = strongly disagree; 5 = strongly agree) (Jayanti & Burns, 1998). For ingredients’ awareness, the respondents were asked to declare whether the ingredient is unknown or well-known to them (Bornkessel et al., 2014) on a 5 point scale (1 = Unknown; 5 = Extremely known).
To define high and low health consciousness and high and low ingredients’ awareness a mean split method was applied, for turning a continuous variable into a categorical one. Essentially, the idea is to find the mean of the continuous variable. Any value below the mean is put it the category “Low” and every value above it is labeled “High” (Iacobucci, Posavac, Kardes,
Schneider, & Popovich, 2015). In this specific case, for health consciousness values it was defined as High the value above 4.1695 and Low the values equal or below 4.1695. For ingredients’ awareness it was defined as High the value above 2.70 and Low the values equal or below 2.70.
Finally, purchase intention, combines items from two past studies, for instance, the respondents were asked to rate on a 5-point, dichotomous scale the degree to which their purchase intention choice was based on the available nutritional information on label (1 = Definitely not; 5 = Definitely yes) (DiPietro et al., 2016) and for every image presented in the screen, participants expressed their purchase intentions on a 5-point scale (“How likely would you be to purchase this food item?” 1 = “very unlikely,” 5 = “very likely”) (Loebnitz & Grunert, 2017).
Note: Some of the original articles had a 7-point scale but in order to have the same scale in all
the constructs I have decided to change these to a 5-point scale.
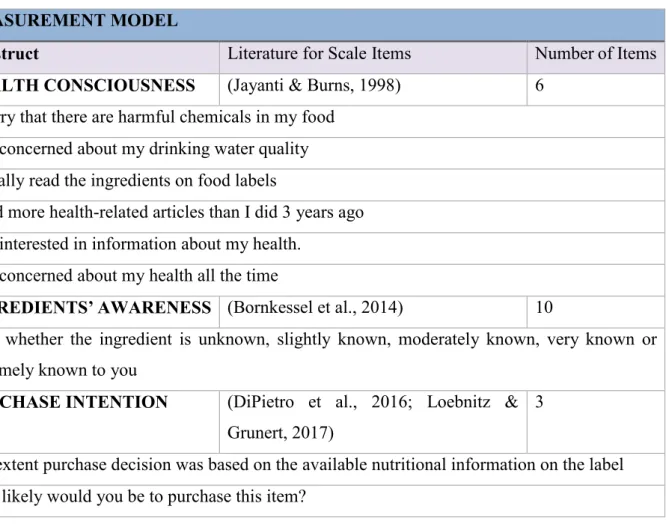
With the intention of simplifying what was previously described the following table shows the dissertation’s constructs, the literature sources used to build these scales and the number of items.
Table 1: Proposed constructs, number of scale items and relevant literature source MEASUREMENT MODEL
Construct Literature for Scale Items Number of Items
HEALTH CONSCIOUSNESS (Jayanti & Burns, 1998) 6 I worry that there are harmful chemicals in my food
I am concerned about my drinking water quality I usually read the ingredients on food labels
I read more health-related articles than I did 3 years ago I am interested in information about my health.
I am concerned about my health all the time
INGREDIENTS’ AWARENESS (Bornkessel et al., 2014) 10
State whether the ingredient is unknown, slightly known, moderately known, very known or extremely known to you
PURCHASE INTENTION (DiPietro et al., 2016; Loebnitz & Grunert, 2017)
3
The extent purchase decision was based on the available nutritional information on the label How likely would you be to purchase this item?
3.3.3 Data Analysis
All data collected from the survey were analyzed using Statistical Package for the Social Science (SPSS),version 26/2017, to which were complemented a custom dialog designated by PROCESS (release 2.16.3) with the aim to evaluate the effect of Health Consciousness mediated by the Ingredients’ awareness on the Purchase Intention (Hayes, 2013).
To systematize the information obtained with the application of the elaborated questionnaire, techniques of descriptive statistics and inferential statistics were used. The statistical techniques applied were frequencies (absolute and percentages), measures of central tendency (arithmetic mean and median), measures of dispersion or variability (minimum value, maximum value and standard deviation), coefficients (Alpha Cronbach and Pearson’s correlation) and statistical tests (Pearson's correlation coefficient significance test, ANOVA test and Sobel test) and linear regression (simple and multiple).
In the selection of the statistical techniques, namely, the tests, it was taken into account the variables’ characteristics and the recommendations presented by Maroco, 2007 and Pestana & Gageiro, 2005.
For all statistical tests that were carried out, it was considered a significance level of 5%, therefore, H0 hypothesis were rejected for a p-value lower than .05, that is, the null hypothesis
were rejected when the probability of type I error (probability of rejection of the null hypothesis when it is true) was lower than the set value (when p-value .05).
CHAPTER 4: RESULTS AND DISCUSSION
The following chapter aims to present all the data collected in form of a survey using the methodology determined in the previous chapter, which will allow us to reach relevant conclusions regarding the proposed research questions.
4.1 Sample Characterization
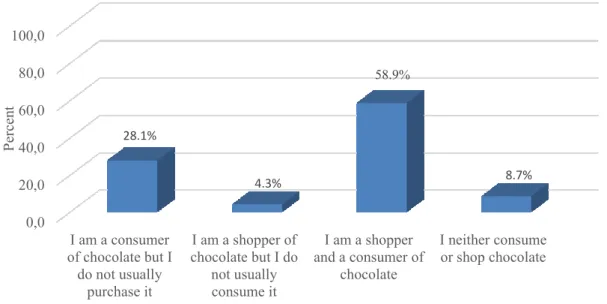
Starting by the sample characterization, analyzing the relationship with the chocolate of the 768 respondents, the data from figure 2 allows to verify that the majority (58.7%) answered that they are shoppers and consumers of chocolate, followed by the ones that are consumers but did not usually purchase chocolate (28.1%). Still, it is verified that 61 of the respondents (8.7%) are not consumers nor did they purchase chocolate. These respondents were excluded from the analysis wherefore the sample was constituted of 701 elements.
Figure 2: Relationship with chocolate (n = 768)
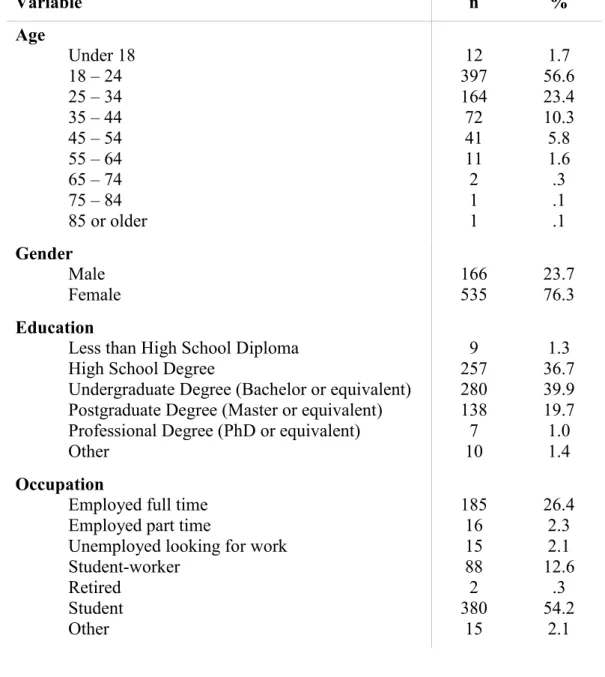
Analyzing the data presented on table 2, it can be verified that the majority of the sample elements (56.6%) are between the age of 18 and 24, followed by 23.4% that are between 25 and 34 years old and 10.3% who belong the age group between 35 and 44 years old.
Also, approximately, 3 out of 4 individuals (76.3%) were women.
It is verified that 39.9% of the sample are undergraduate (bachelor or equivalent), followed by 36.7% that have a high school degree and 19.7% postgraduate degree (master or equivalent). The remaining 10 individuals who mentioned other qualifications refer: postgraduate (4),
0,0 20,0 40,0 60,0 80,0 100,0 I am a consumer of chocolate but I do not usually purchase it I am a shopper of chocolate but I do not usually consume it I am a shopper and a consumer of chocolate I neither consume or shop chocolate 28.1% 4.3% 58.9% 8.7% P er ce nt
attending master degree (1), experience of life (1), incomplete undergraduate degree, MBA (1), pre-Bologna (1) and one individual did not answer.
Regarding occupation, the majority of the respondents were students (54.2%), followed by the full-time employees (26.4%) and student-workers (12.6%). The remaining 15 elements who mentioned other occupation refer: commercial manager (3), research fellowship (1), postdoctoral fellowship (1), entrepreneur (1), self-employed (1), businessman (1), not studying nor unemployed/vacations (1) and 5 individuals did not answered.
Table 2: Demographic characteristics (n = 701)
Variable n % Age Under 18 18 – 24 25 – 34 35 – 44 45 – 54 55 – 64 65 – 74 75 – 84 85 or older 12 397 164 72 41 11 2 1 1 1.7 56.6 23.4 10.3 5.8 1.6 .3 .1 .1 Gender Male Female 166 535 23.7 76.3 Education
Less than High School Diploma High School Degree
Undergraduate Degree (Bachelor or equivalent) Postgraduate Degree (Master or equivalent) Professional Degree (PhD or equivalent) Other 9 257 280 138 7 10 1.3 36.7 39.9 19.7 1.0 1.4 Occupation
Employed full time Employed part time
Unemployed looking for work Student-worker Retired Student Other 185 16 15 88 2 380 15 26.4 2.3 2.1 12.6 .3 54.2 2.1
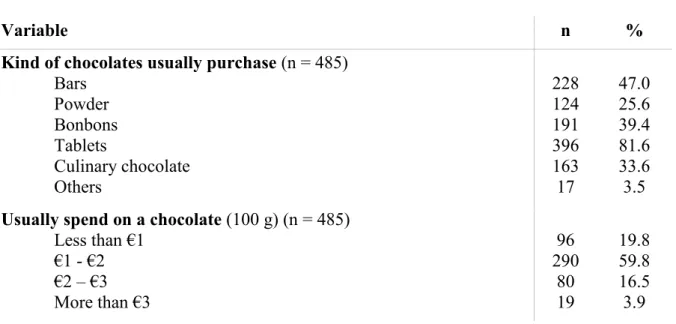
In what concerns the chocolate characteristics which the individuals consume it is verified (table 3 and table 4) that 81.6% refer tablets, 47% bars, 39.4% bonbons and 33.6% culinary chocolate. The remaining 19 individuals who refer other kinds of chocolate, they refer: cereals and cookies (3), M&Ms (2), ice cream (2), biscuits (1), chocolate cookies (2), cocoa 85% (1), cocoa 99% (1), pure cocoa (1), cereals (1), liquid topping (1), nutella (1), snickers (1), kinder eggs (1) or chocolate milk and cereals (1)
The majority (59.8%) refers that spend between 1 and 2 euros for 100g of chocolate, followed by 19.8% who claims to spend less than 1 euro and 16.5% spends between 2 and 3 euros.
It was found that 55.3% of the respondents actively look for cocoa percentage when purchasing chocolate, 19.2% refer no added sugars and 12.4% look for low fat. It was noted that 35.7% refer that do not look for any of the listed characteristics. From the 37 individuals who look for other characteristics, they mention: flavor (11), must be vegan (5), dry fruits (4), pure cocoa or 90% cocoa (3), white chocolate (3), fair trade (2), momentary decision (2), brand (1), country origin (1), no allergens (1), price (1) and 2 did not answered.
Regarding cocoa percentage, 42.4% refer that look for chocolate with more than 70% of cocoa, followed by 41% who purchase chocolate with 70% cocoa.
Still it is verified that 26.4% claim that consume chocolate less than once a week, 25.5% consume 2 to 3 times a week and 20.8% just once a week.
Table 3: Chocolate characteristics
Variable n %
Kind of chocolates usually purchase (n = 485)
Bars Powder Bonbons Tablets Culinary chocolate Others 228 124 191 396 163 17 47.0 25.6 39.4 81.6 33.6 3.5
Usually spend on a chocolate (100 g) (n = 485)
Less than €1 €1 - €2 €2 – €3 More than €3 96 290 80 19 19.8 59.8 16.5 3.9
Table 4: Chocolate characteristics (continuation)
Variable n %
Which of claims actively look for when shopping a chocolate (n =
485) Reduced fat No added sugars No artificial sweeteners Low fat Reduced calorie With Stevia Percent cocoa None of the above Others 21 93 28 60 48 27 268 173 36 4.3 19.2 5.8 12.4 9.9 5.6 55.3 35.7 7.4
Percent of cocoa when looking for chocolate (n = 268)
Less than 70% cocoa 70% cocoa
More than 70% cocoa
45 110 113 16.8 41.0 42.2
How often consume chocolates (n = 667)
Daily
4 – 6 times a week 2 – 3 times a week Once a week
Less than once a week
80 102 170 139 176 12.0 15.3 25.5 20.8 26.4
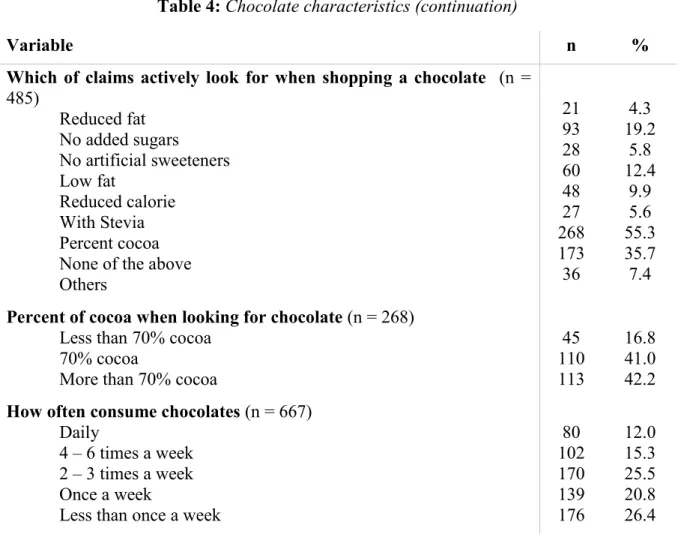
Regarding the items that are part of the health consciousness scale it is verified that individuals evidence higher consciousness on the following items “I am concerned about my health all the time” and “I am interested in information about my health”. In the opposite direction, the items “I usually read the ingredients on food labels” and “I read more health-related articles than I did 3 years ago” were the ones where individuals showed lower health consciousness.
In a 5-point scale, the health consciousness measure got values between 1.17 and 5, being the average 4.17±.67 points. Half of the respondents obtained results above 4.33 points.
The figure 3 allows to verify that the majority of the respondents (53.6%) reveals high health consciousness.
Table 5: Health consciousness (n = 701)
Item Mean Median deviation Std. Min. Max.
I am concerned about my health all the time 4.56 5.00 .66 1.00 5.00 I usually read the ingredients on food labels 3.73 4.00 1.28 1.00 5.00 I worry that there are harmful chemicals on my
food 4.01 4.00 1.08 1.00 5.00
I am concerned about my drinking water quality 4.28 5.00 0.95 1.00 5.00 I am interested in information about my health 4.51 5.00 .73 1.00 5.00 I read more health-related articles than I did 3
years ago 3.92 4.00 1.24 1.00 5.00
Measure of health consciousness 4.17 4.33 .67 1.17 5.00
Figure 3: Health consciousness (classification) (n = 701)
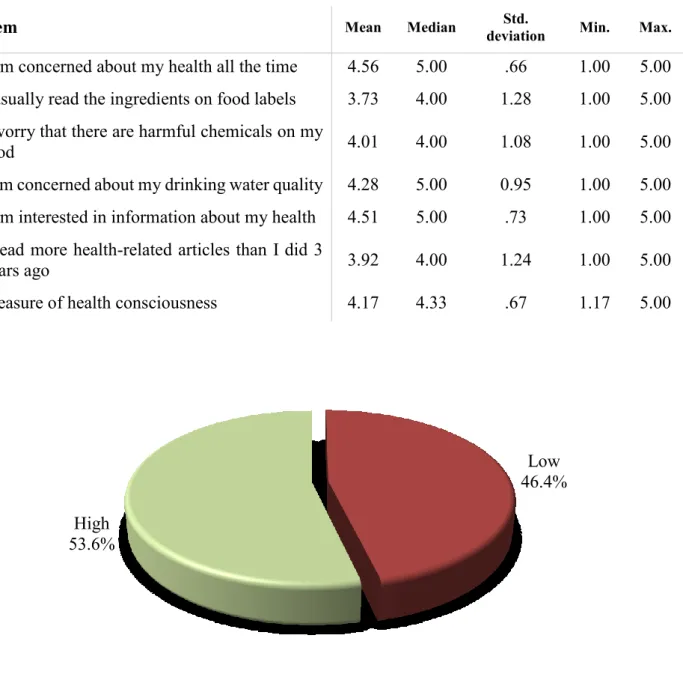
Concerning about the ingredients which constitutes the ingredients’ awareness scale, in table 6 was verified that the respondents revealed higher awareness in the following ingredients: sugar, vitamin C, honey, calcium, and fruit sugar. On the other hand, the respondents revealed lower awareness in the following ingredients: phytosterols, xylitol, glucosamine, saccharine, aspartame and dietary fiber
For the ingredients’ awareness measure, on a 5-point scale, it was observed the average value of 2.84±.95 points, being that, half of the respondents got results lower than 2.70 points
Low 46.4% High
For the sugars’ awareness measure, it was observed the average value of 2.95±.92 points and half of the respondents got results lower than 2.88 points
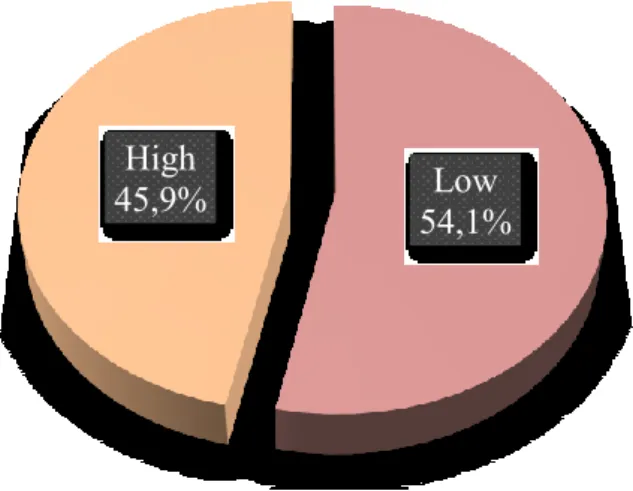
Figures 4 and 5 show that 54.1% and 53.4% of the respondents reveal low ingredients’ and sugars’ awareness, respectively.
Table 6: Ingredients' awareness (n = 701)
Ingredient Mean Median deviation Std. Min. Max.
Iodine 2.75 3.00 1.38 1.00 5.00 Calcium 3.90 4.00 1.05 1.00 5.00 Vitamin C 3.96 4.00 1.05 1.00 5.00 Antioxidants 3.55 4.00 1.23 1.00 5.00 Probiotics 2.52 2.00 1.48 1.00 5.00 Dietary fiber 2.45 2.00 1.47 1.00 5.00 Omega-3-fatty acids 3.39 4.00 1.30 1.00 5.00 Phytosterols 1.73 1.00 1.14 1.00 5.00 Glucosamine 2.18 2.00 1.39 1.00 5.00 Xylitol 1.93 1.00 1.27 1.00 5.00 Stevia 2.83 3.00 1.46 1.00 5.00 Sugar 4.23 4.00 .92 1.00 5.00 Aspartame 2.43 2.00 1.46 1.00 5.00 Saccharine 2.32 2.00 1.36 1.00 5.00 Honey 3.91 4.00 1.15 1.00 5.00 Fruit sugar 3.79 4.00 1.14 1.00 5.00
Measure of ingredients' awareness 2.84 2.70 .95 1.00 5.00 Measure of sugars' awareness 2.95 2.88 .92 1.00 5.00
Figure 4: Ingredients' awareness (classification) (n = 701)
Figure 5: Sugars' awareness (classification) (n = 701)
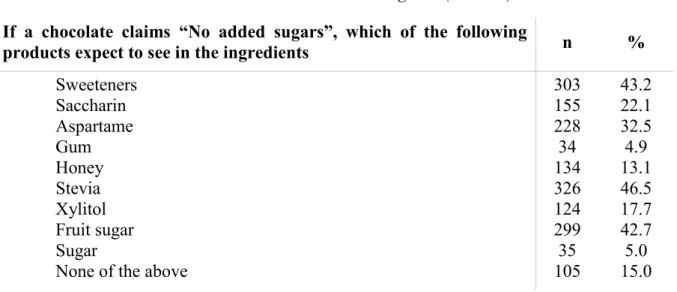
The data on table 7 allow to say that if a chocolate claims “No added sugars” 46.5% of the respondents said that they expected to find Stevia, 43.2% expected sweeteners, 42.7% fruit sugar and 32.5% aspartame. The ingredients that were less expected to see were gum (4.9%) and sugar (5.0%). Low 54,1% High 45,9% Low 53,4% High 46,6%
Table 7: Chocolate “No added sugars” (n = 701) If a chocolate claims “No added sugars”, which of the following
products expect to see in the ingredients n %
Sweeteners Saccharin Aspartame Gum Honey Stevia Xylitol Fruit sugar Sugar
None of the above
303 155 228 34 134 326 124 299 35 105 43.2 22.1 32.5 4.9 13.1 46.5 17.7 42.7 5.0 15.0
Regarding the ranking of how natural an ingredient is, it was verified in table 8 that respondents considered as extremely natural the following ingredients: fruit sugar and honey and not at all natural: aspartame and xylitol.
Table 8: Ranking of how natural the ingredients are (n = 701)
Products Mean Median deviation Std. Min. Max.
Sugar 2.59 3.00 1.29 1.00 5.00 Fruit sugar 4.50 5.00 .83 1.00 5.00 Xylitol 1.89 2.00 1.09 1.00 5.00 Aspartame 1.64 1.00 .90 1.00 5.00 Saccharine 2.12 2.00 1.18 1.00 5.00 Honey 4.35 5.00 .91 1.00 5.00 Stevia 3.10 3.00 1.40 1.00 5.00
According to the table 8, the respondents tend to purchase, with higher frequency, the chocolates that contain sugar, stevia or fruit sugar, and, on the other hand, the respondents tend to purchase, with lower frequency, the chocolates that contain aspartame, xylitol or saccharine.
Table 9: Purchase a chocolate that has the following ingredients (n = 701)
Products Mean Median deviation Std. Min. Max.
Sugar 4.18 5.00 1.20 1.00 5.00 Fruit sugar 3.29 4.00 1.33 1.00 5.00 Xylitol 2.89 3.00 1.05 1.00 5.00 Aspartame 2.83 3.00 1.15 1.00 5.00 Saccharine 2.91 3.00 1.10 1.00 5.00 Honey 3.08 3.00 1.34 1.00 5.00 Stevia 3.35 3.00 1.19 1.00 5.00
Regarding purchase intention, the results that are included on table 10 allow to verify that respondents evidence higher purchase intention when purchasing a chocolate that refers on the label “No added sugar”, followed by the chocolates that refer on the label “With Stevia” and, lastly, “purchase decision is based on the nutrition information available on the label”.
The measure for purchase intention has an average value of 3.36±.79 points and half of the sample got punctuations superiors to 3.33 points.
Figure 6 reveals that the majority of the respondents (55.3%) evidenced low purchase intention of chocolate.
Table 10: Purchase intention (n = 701)
Item Mean Median deviation Std. Min. Max.
My purchase decision is based on the nutrition
information available on the label 2.96 3.00 1.16 1.00 5.00 How likely would you be to purchase a product
that refers on the label “With Stevia” 3.37 3.00 1.12 1.00 5.00 How likely would you be to purchase a product
that refers on the label “No added sugar” 3.76 4.00 1.08 1.00 5.00
Figure 6: Purchase intention (classification) (n = 701)
4.2 Measures Reliability
In order to study the scales’ reliability of the health consciousness, ingredients’ awareness, sugars’ awareness and purchase intention the internal consistency was evaluated.
The method used consisted on the determination of the Cronbach's alpha coefficient. This statistical procedure is suitable for most scales, especially in Likert scales, and may present results that are between 0 and 1. The greater the values obtained, the more homogeneous are the answers given to the items that constitute the scale and the greater the correlation between them, that is, the better the internal consistency. According to several authors, namely, Nunnally (1978) cited by Maroco, 2007 results equal to or greater than .70 are indicators of good internal consistency. Some authors also consider that values equal to or greater than .60 are acceptable when the number of items involved are low, as (DeVellis, 1991) also cited by Maroco, 2007.
Cronbach’s alphas for each measure are shown in Table 11. From its analysis, it can be verified that all the scales presented good consistency or even very good internal consistency, being the values of the coefficient between .74, for the scale health consciousness, and .91, for the ingredients' awareness scale.
Low 55.3% High
Table 11: Survey items’ reliabilities
Scale Number of Items Cronbach’s alpha
Health consciousness 6 .74
Ingredients’ awareness 10 .91
Sugars’ awareness 8 .86
Purchase intention 3 .79
4.3 Results from the Hypothesis Testing
In order to test the formulated hypotheses, a simple linear regression, a classical mediation model and a Pearson correlation coefficient was resorted (and its respective significance test).
4.3.1 Hypothesis 1: The ingredients’ awareness will affect the purchase intention.
The measurement of the Pearson’s correlation coefficient between the following variables, ingredients’ awareness and purchase intention, revealed a value of +.23 with a p<.001, which allows to conclude that between these variables there is a positive correlation, statistically significant and that the ingredients’ awareness explains 5.5% of the purchase intention variation.
A regression analysis was performed between the two variables, ingredients’ awareness (m_ia) and purchase intention (m_pi), which allowed to get the regression coefficient of +.20 with p < 0.001 (figure 7), then, the regression equation can be written as: m_iâ = 2.81 + .20 × m_pi, revealing the ANOVA test that the model is statistically significant (F(1;699) = 40.53 ; p < .001).
In conclusion, hypothesis 1 can be confirmed and it can be said that the respondents with a higher value of ingredients’ awareness tend to evidence a higher purchase intention.
4.3.2 Hypothesis 1a: The awareness of higher Cocoa % in chocolates affects the purchase intention for consumers that are high health consciousness.
Between awareness of higher Cocoa % in chocolates (m_ahc%) and purchase intention (m_pi) the value -.01 was obtained for the Pearson’s correlation coefficient, with p=.907.
It can be concluded that there are no statistical evidences that hypothesis 1a can be confirmed, it means that for high health consciousness consumers the awareness of higher Cocoa % in chocolates not affects the purchase intention.
Figure 8: Variable Relationship for consumers that are high health consciousness (H1a)
4.3.3 Hypothesis 1b: The awareness of different types of sugar affects differently the purchase intention.
The Pearson’s correlation coefficient obtained between the different types of sugar and the purchase intention was +.29 with p<.001 and the regression analysis between purchase intention and awareness of different types of sugar allowed to obtain the regression coefficient of +.25 with p<.001 (figure 9).
The regression equation can be written as:
𝑚_𝑝𝑖̂ = 2.62 + .25 × 𝑎𝑤𝑎𝑟𝑒𝑛𝑒𝑠𝑠 𝑜𝑓 𝑑𝑖𝑓𝑓𝑒𝑟𝑒𝑛𝑡 𝑡𝑦𝑝𝑒𝑠 𝑜𝑓 𝑠𝑢𝑔𝑎𝑟 and the model is statistically significant (F(1;699) = 65.28 ; p < .001). Also, it was verified that 8.5% of the
purchase intention variation can be explained by the awareness of different types of sugar.
In conclusion, hypothesis 1b can be confirmed and it can be said that respondents that have higher awareness of different types of sugar tend to evidence a higher purchase intention.
4.3.4 Hypothesis 1c: The awareness of "No added sugar" has a higher impact than "With Stevia" on consumers’ purchase intention.
For the hypothesis 1c, a multiple regression model were applied, considering as independent variables: awareness of "No added sugar" and awareness of "With Stevia" and as dependent variable: purchase intention.
It was verified that the correlation between purchase intention and awareness of “No added sugar” is +.73 with p>.001 and the correlation between purchase intention and awareness of “With stevia” is +.74 with p<.001. Thus, the awareness of “No added sugar” explains 52.8%, while the awareness of “With stevia” explains 55.1% of purchase intention variation.
Taking a look on figure 4, the regression model allowed to obtain the coefficient +.38 for both variables: awareness of "No added sugar" and awareness of "With Stevia”, being both statistically significant (p<.001). The regression equation can be presented as:
𝑚_𝑝𝑖̂ = 1.35 + .38 × awareness of "No added sugar" + .38 × awareness of "With Stevia”, being the model statistically significant (F(2;698) = 1170.67 ; p < .001).
Based on the obtained results, it can be concluded that individuals with higher awareness of "No added sugar" and higher awareness of "With Stevia" tend to evidence higher purchase intention. However, both independent variables influence in a similar way on the dependent variable. Then, it cannot be claimed that hypothesis 1c is confirmed.
4.3.5 Hypothesis 2: Health consciousness impacts positively the ingredients’ awareness.
The Pearson’s correlation coefficient obtained between health consciousness and ingredients’ awareness was +.39 with p<.001, thus, it can be said that between the two variables there is a positive correlation, statistically significant and health consciousness explains 15.1% of the ingredients’ awareness variation.
A regression analysis was performed between the two variables, ingredients’ awareness (m_ia) and health consciousness (m_hc), which allowed to get the regression coefficient of +.55 with p < 0.001 (figure 10), then, the regression equation can be written as: m_hĉ = .55 + .55 × m_ia, revealing the ANOVA test that the model is statistically significant (F(1;699) = 123.84 ; p
< .001).
In conclusion, hypothesis 2 can be confirmed and it can be said that respondents that have higher health consciousness tend to evidence a higher ingredients’ awareness.
Figure 10: Variable Relationship for total sample (H2)
4.3.6 Hypothesis 3: Health consciousness positively impacts the purchase intention.
The Pearson’s correlation coefficient obtained between health consciousness and purchase intention was +.38 with p<.001 and the regression analysis between purchase intention (m_pi) and health consciousness (m_hc) allowed to obtain the regression coefficient of +.44 with p<.001 (figure 11).
The regression equation can be written as: 𝑚_𝑝𝑖̂ = 1.51 + .44 × 𝑚_ℎ𝑐, being the model statistically significant (F(1;699) = 115.40 ; p < .001). It was also found that 14.2% of purchase
intention variation can be explained by health consciousness.
In conclusion, hypothesis 3 can be confirmed and it can be said that respondents that have higher health consciousness tend to evidence a higher purchase intention.
Figure 11: Variable Relationship for total sample (H3)
4.3.7 Hypothesis 4: Ingredients’ awareness mediates the relationship between health consciousness and purchase intention.
For this hypothesis, a classic mediation model was used through a custom dialog developed by Hayes, 2013 for SPSS.
The mediation model is commonly used to estimate the indirect effect of an independent variable (X) on another dependent variable (Y) through an intermediate variable called by mediator variable (M). This variable (M) helps to explain the relationship between the independent (X) and dependent (Y) variables.
The aim of this study is to estimate the indirect effect of the health consciousness variable (X=m_hc) on purchase intention variable (Y=m_pi), through an intermediate variable (mediator) ingredients’ awareness (M=m_ia).
The a-path and b-path are, respectively, the estimation of the health consciousness effect on the ingredients’ awareness and the estimation of the ingredients’ awareness on purchase intention. The b-path is obtained through a, the c’-path is the estimation of the direct effect of health consciousness on purchase intention, and, lastly, c-path is an estimation of the total effect of health consciousness on purchase intention. The relationship between the coefficients can be translated by the following equation: 𝑐 = 𝑐′+ 𝑎 × 𝑏.
The entire model is based on the following regression equations: 𝑚_𝑝𝑖̂ = 𝐾0+ 𝑐 × 𝑚_ℎ𝑐 + 𝜀 𝑚_𝑝𝑖̂ = 𝐾1+ 𝑐′× 𝑚ℎ𝑐+ 𝑏 × 𝑚_𝑖𝑎 + 𝜀
The underlying idea on this mediation analysis is that the direct effect of the independent variable, health consciousness, on the independent variable, purchase intention, can decrease after the mediator variable, ingredients’ awareness, being added to the model, in other words,
c’ may decrease comparing with c. The lower the c’, comparing with c, the higher is the mediator effect of ingredients’ awareness in the relation between health consciousness and purchase intention. If c’ equals to zero or, at least, statistically non-significant it can be considered that the mediation effect is total or very important. In the cases in which c’ is lower than c’ but both coefficients are statistically significant, it can be considered that mediation is only partial. An alternative to estimate the indirect effect and its significant is the Sobel test (Sobel, 1982) which consists of a Z-test on whether the difference between c-path and c’-path is statistically significant and different from zero. The same conclusion can be obtained through the indirect effect (IE) and its confidence interval of 95% (CI95%). If this interval does not
contain the zero value, it can be concluded that there is mediation effect and that it is statistically significant.
The magnitude of the mediation effect can be determined through the percent mediation (PM),
which represents, in percentage, the difference between c and c’ in relation to c.
The results presented on figure 12 show that ingredients’ awareness variable has a partial mediating effect in the relationship between health consciousness and purchase intention variables, because c’ (.40) is less than c (.44) but both are statistically significant (p<.001), it means that total effect is less that direct effect but both are significant. The difference between both coefficients is also statistically significant whether considered the Sobel test (z = 2.65 ; p = .008) or the indirect effect value (IE = .05 ; CI95% = [.01 ; .09]). Lastly, the mediating effect
of ingredients’ awareness variable represents 10.7% of the total effect of health consciousness on purchase intention variable.
Figure 12: The mediating role of ingredients’ awareness on the relationship between health
CHAPTER 5: CONCLUSIONS AND LIMITATIONS
5.1 Main Findings & Conclusions
In first place, it was found that the sample shows a certain degree of bias in terms of age and gender since 80% of the respondents are people with ages between 18 and 34 and in terms of gender, about 76% are women which is not representative.
Regarding purchase intention, it is important to highlight that the majority has a low purchase intention, which would be expected and even desirable if there was a high purchase intention because chocolate is proven to be good for the health (equal or greater than 70% cocoa), which in this study the opposite is verified, in terms of mean and median values, lies exactly in the middle, around 3 in a scale from 1 to 5, then it can be concluded that purchase intention is low. With respect to the respondents who do not consume chocolate, these represents 13% in which 4.3% are shoppers of chocolate and 8.7% do not shop for chocolate.
From the ones who actively look for the percentage of cocoa when shopping a chocolate, 83.2% consume chocolate with 70% or more of cocoa, which is what is intended to be, since, as already emphasized before, chocolates with higher percentage of cocoa (equal or greater than 70% cocoa) are good for the health. But, a large proportion of those who consume chocolate, 47.2%, only do it once a week or less and for the ones who buy chocolate, the majority (59.8%) refers that spend between 1 and 2 euros for 100g of chocolate, followed by 19.8% who claims to spend less than 1 euro and 16.5% spends between 2 and 3 euros. There are no statistical evidences that the awareness of higher cocoa % in chocolates affects the purchase intention for consumers that are high health consciousness, it means that for high health consciousness consumers the awareness of higher Cocoa % in chocolates not affects the purchase intention.
Regarding the items that are part of the health consciousness scale it is verified that individuals evidence higher consciousness on the following items “I am concerned about my health all the time” and “I am interested in information about my health”. In the opposite direction, the items “I usually read the ingredients on food labels” and “I read more health-related articles than I did 3 years ago” were the ones where individuals showed lower health consciousness.
Going back to the aim of this study which is not just answering the research questions but also to understand the level of health consciousness that consumers have regarding the ingredients’ awareness and how this impacts the purchase intention, in other words, if the ingredients’ awareness can explain the relationships between consumer health consciousness and purchase
intention for chocolate, it can be concluded that there is a partial mediating effect in the relationship between health consciousness and purchase intention, ingredients’ awareness variable represents 10.7% of the total effect of health consciousness on purchase intention variable.
RQ1: What is the effect of the ingredients’ awareness on the purchase intention?
The term ingredient awareness has the focus on the antecedents of knowledge about food ingredients themselves. As Howlett, Burton, Bates, & Huggins, 2009 demonstrated, the provision of nutrient information can affect consumers' purchase intentions, more specifically, “higher motivation to process nutrition information was positively related to repurchase intentions”. Supported by this study, which meets Howlett et al., 2009 study, it can be said that between this variables there is a positive correlation, statistically significant and that the ingredients’ awareness explains 5.5% of the purchase intention variation. Also, respondents with a higher value of ingredients’ awareness tend to evidence a higher purchase intention.
RQ2: Are the consumers willing to switch to the healthy substitutes of sugar?
The reality is that there is a wide market of consumers who demand for sugar-free chocolates related to their concerns about diabetes, for being one of the fastest-growing chronic diseases. Also the US Department of Agriculture (USDA) and the European Food Safety Authority believe that “attention should be turned to added sugar”. And so, to meet this demand, some alternatives, as low calorie sweeteners, have to be implemented on chocolates (Rodriguez Furlán, Baracco, Lecot, Zaritzky, & Campderrós, 2017). As an example of natural sweeteners there is stevia leaf extract, honey and fruit sugar, which were the base for study if the consumers are willing to switch for the healthy substitutes of sugar and it was concluded that, for fruit sugar, 50,2% of the respondents says that they are likely to purchase a chocolate if it has fruit sugar, for honey, 45.5% of the respondents says that they are likely to purchase a chocolate if it has honey and for stevia, 48.5% of the respondents says that they are likely to purchase a chocolate if it has stevia. Comparing these healthy substitutes of sugar with the sugar itself, it can be said that they are very low, 79.2% keep choosing chocolates with sugar. Still there is a long way to change consumers’ mind about chocolate.