MESTRADO
MULTIMÉDIA - ESPECIALIZAÇÃO EM TECNOLOGIAS
DESIGNING AN ALGORITHMIC
NEWS APPLICATION FOR
USER CONTROL
Tiago Nuno Mesquita Folgado Leitão
Devezas
M
2017
FACULDADES PARTICIPANTES:
FACULDADE DE ENGENHARIA FACULDADE DE BELAS ARTES FACULDADE DE CIÊNCIAS FACULDADE DE ECONOMIA FACULDADE DE LETRAS
Application for User Control
Tiago Devezas
Master in Multimedia, University of Porto Supervisor: Sérgio Sobral Nunes (Assistant Professor)
Designing an Algorithmic News
Application for User Control
Tiago Devezas
Master in Multimedia, University of Porto
Approved in oral examination by the committee:
Chair: Rui Luís Nogueira Penha
External Examiner: António Maria Salvado Coxito Granado Supervisor: Sérgio Sobral Nunes
The torrential stream of information published online every day has fostered the rise of tech-nological solutions aiming to combat information overload. News aggregators, applications that collect news from multiple publishers and present them in a condensed form in a single place, are one such solution. In order to increase efficiency, many aggregators now employ personalization and curation algorithms, computer programs that decide what to present based on a set of rules and criteria. But this approach can entail new problems. Algorithms can be biased, lock users inside “filter bubbles”, and help disseminate false news. This power to shape public opinion is often left unchecked. Information about the algorithm’s inner workings isn’t provided to users, who sometimes aren’t even aware that their news feed is managed by a computer program.
This study aims to identify the importance of a set of criteria that a sample of potential users would like to manipulate in an algorithmically generated news aggregator, assess the importance of providing information about the algorithm, and determine the desired degree of control over the system. The goal is to then apply the most relevant findings to a functional prototype in line with the users’ requirements. In order to achieve these objectives, a quantitative non-experimental research design was employed. A questionnaire was developed and sent via email to the Uni-versity of Porto community. Four hundred and thirty two (432) participants, mainly comprising students and professors, filled the questionnaire. Data was collected about demographics, news consumption habits, and the importance level of multiple criteria regarding news content, diversity of perspectives, news sources, information about the algorithm, and the degree of personalization. Results indicate that the most valued news content criteria were “Timeliness”, “Good news”, “Relevance”, “Conflict”, “Magnitude”, “Serendipity”, “Audio-visual”, and “Proximity”. Regard-ing the diversity of perspectives, participants attributed higher importance to news that present points of view diverse from their own than to content aligned with their views. Professionalism and journalistic prestige were rated as the most important factors concerning the sources. Informa-tion about the algorithm was evaluated as being of moderate importance. As for personalizaInforma-tion, participants indicated that the most important criterion was the ability to explicitly configure the system according to their own options.
This study provides some insights about the importance of several criteria for manipulating an algorithmic news application from the users’ perspective. Some of the findings were transposed to a functional prototype that will be further developed in the future. Evaluating the system with users is also planned as future work. The usage of a non-probability sample limits the generalization of the findings, but we believe they can be a valuable reference for implementers of algorithmic news applications concerned with user control and transparency.
A torrente de informação publicada online todos os dias fomentou o aparecimento de solu-ções tecnológicas que visam combater a sobrecarga de informação. Os agregadores de notícias, aplicações que recolhem notícias de várias fontes e apresentam-nas de forma condensada num único local, são uma destas soluções. Para aumentar a eficiência, muitos agregadores recorrem atualmente a algoritmos de personalização e curadoria, programas de computador que decidem o que apresentar com base num conjunto de regras e critérios. Mas esta abordagem pode criar novos problemas. Os algoritmos podem conter enviesamentos, fechar os utilizadores dentro de “bolhas de filtro”, e ajudar a disseminar notícias falsas. Este poder de moldar a opinião pública é muitas vezes deixado sem controlo. Informação sobre o funcionamento interno do algoritmo não é fornecida aos utilizadores, que por vezes nem estão conscientes de que a sua lista de notícias é gerida por um programa de computador.
Este estudo visa identificar a importância de um conjunto de critérios que uma amostra de potenciais utilizadores gostaria de manipular num agregador de notícias gerado por um algoritmo, aferir a importância de fornecer informação sobre o algoritmo, e determinar qual o grau de con-trolo sobre o sistema que os utilizadores pretendem. O objetivo é depois aplicar as conclusões mais relevantes a um protótipo funcional alinhado com os requisitos dos utilizadores. De forma a atingir estes objetivos, foi desenhado um estudo quantitativo não-experimental. Desenvolveu-se um ques-tionário, que foi enviado por email à comunidade da Universidade do Porto. Quatrocentos e trinta e dois (432) participantes, maioritariamente estudantes e docentes, preencheram o questionário. Foram recolhidos dados sobre as características demográficas, hábitos de consumo de notícias, e o nível de importância de vários critérios relacionados com o conteúdo das notícias, diversidade de perspetivas, fontes noticiosas, informação sobre o algoritmo, e o grau de personalização.
Os resultados indicam que os critérios relacionados com o conteúdo das notícias mais valo-rizados foram “Atualidade”, “Boas notícias”, “Relevância”, “Conflito”, “Magnitude”, “Serendi-pidade”, “Áudio-visual”, e “Proximidade”. Relativamente à diversidade de perspetivas, os parti-cipantes atribuíram maior importância às notícias que apresentam pontos de vista diferentes dos seus do que a conteúdos alinhados com os seus pontos de vista. Profissionalismo e prestígio jor-nalístico foram avaliados como os fatores mais importantes no que se refere às fontes. Informação sobre o algoritmo foi avaliada como moderadamente importante. Quanto à personalização, os par-ticipantes indicaram que o critério mais importante é a possibilidade de configurar explicitamente o sistema de acordo com as suas próprias opções.
Este estudo proporciona algum conhecimento sobre a importância de vários critérios para ma-nipular uma aplicação algorítmica de notícias segundo a perspetiva dos utilizadores. Algumas das descobertas foram transpostas para um protótipo funcional que continuará a ser desenvolvido no futuro. A avaliação do sistema com utilizadores está também planeada como trabalho futuro. A utilização de uma amostra não-probabilística limita a generalização dos resultados, mas acredita-mos que estes podem ser uma referência valiosa para implementadores de aplicações algorítmicas de notícias preocupados com o controlo dos utilizadores e a transparência.
I dedicate this achievement to my dear departed mother. Wherever she may be, I am sure she is proud. I would like to thank my supervisor, Professor Sérgio Nunes, for his efficient guidance, patience, and overall niceness. Also, a word of appreciation to my colleagues from the InfoLab, particularly José Luís Devezas, with whom I have very interesting and instructive discussions. Finally, a word of affection and gratitude to my family and loved ones.
you can trust and why is, quite literally, what a very large part of our brain has evolved to do.”
1 Introduction 1
1.1 Motivation and Goals . . . 2
1.2 Document Structure . . . 3
2 State of the Art 4 2.1 News Aggregators . . . 4
2.1.1 Types of News Aggregators . . . 5
2.1.2 User Experience and Usability of News Aggregators . . . 6
2.2 Algorithms and News . . . 7
2.2.1 How Algorithms Decide . . . 8
2.2.2 Algorithmic Transparency . . . 9
2.2.3 User Experience of Algorithmic Transparency . . . 10
2.3 Summary . . . 15 3 Methods 16 3.1 Study Design . . . 16 3.2 Participants . . . 16 3.2.1 Sampling method . . . 16 3.3 Instruments . . . 17 3.4 Procedure . . . 19 3.5 Data Analysis . . . 19 3.6 Sample Characterization . . . 19 3.7 Summary . . . 24 4 Results 25 4.1 News Content Criteria . . . 25
4.2 Diversity Criteria . . . 28
4.3 Sources’ Criteria . . . 29
4.4 Algorithmic Information Criteria . . . 30
4.5 Personalization Criteria . . . 31
4.6 Summary and Discussion . . . 33
5 Implementation 36 5.1 System Description and Architecture . . . 36
5.2 Front-end Application . . . 37
5.2.1 Condensing the News . . . 38
5.2.2 Controlling the Algorithm . . . 40
5.3 Summary . . . 44 6 Conclusions 45 6.1 Contributions . . . 47 6.2 Future Work . . . 47 References 48 A Questionnaire 51
A.1 English version . . . 51
A.2 Portuguese version . . . 61
B Email sent to the participants 71
B.1 English version . . . 71
2.1 Typology of News Aggregators (Coddington,2015) . . . 6
2.2 IEEE Spectrum Top Programming Languages Interactive Ranking: Weighting manipulation. Screen capture fromhttp://spectrum.ieee.org/static/ interactive-the-top-programming-languages-2016 . . . 13
2.3 IEEE Spectrum Top Programming Languages Interactive Ranking: Ranking comparison. Screen capture from http://spectrum.ieee.org/static/ interactive-the-top-programming-languages-2016 . . . 14
3.1 Media type used for consumption by age and gender . . . 21
3.2 Interest in news by age and gender . . . 22
3.3 News consumption frequency by age and gender . . . 23
4.1 News content criteria . . . 26
4.2 Diversity criteria . . . 28
4.3 Sources’ criteria . . . 29
4.4 Algorithmic information criteria . . . 30
4.5 Personalization criteria . . . 31
5.1 System architecture after the integration of the developed components . . . 37
5.2 Front-end application home page . . . 38
5.3 Random selection of cluster articles . . . 39
5.4 Application configuration settings . . . 41
5.5 Indication that the content has been algorithmically processed . . . 42
2.1 Summary of transparency factors across four layers of algorithmic systems (
Di-akopoulos and Koliska,2016) . . . 11
3.1 List of criteria by group and corresponding references . . . 18
4.1 News content criteria item labels . . . 27
4.2 Diversity criteria item labels . . . 28
4.3 Sources’ criteria item labels . . . 29
4.4 Algorithmic information criteria item labels . . . 30
4.5 Personalization criteria item labels . . . 32
4.6 Importance level of the news content criteria evaluated in this study compared with their frequency of appearance in newspaper stories and news shared on social media found byHarcup and O’Neill(2016) . . . 33
Introduction
The web is increasingly the medium of choice for news consumption. According to a 2016 survey, 38% of United States of America (USA) adults often get news from digital sources, such as news websites, apps and social networking sites (Pew Research Center,2016b). While television still dominates, with 57% of USA adults getting news from it, web sources have already surpassed radio (25%) and print newspapers (20%). In addition to consumption, the web has also fostered a shift in content creation. Advances in software have significantly lowered the barriers to publish and share information online, allowing former consumers to become producers (the “prosumers”). The term “Web 2.0” (O’Reilly,2005) is commonly employed to refer to the services and tools behind this transition.
While it is undeniable that the ability to quickly access and contribute to such a rich and di-verse collection of knowledge is beneficial, it is also true that it can entail addi-verse effects. Two issues are commonly mentioned. While the rate at which new information is produced is virtu-ally unlimited, the resource for which it competes, attention, is not. This mismatch between the enormous volume of information available and the limited cognitive ability to process it, known as information overload, can impair comprehension and decision making. A second issue is re-lated with the information’s credibility. Since there aren’t any mandatory credibility checks to publish information online, the onus of assessing it lies with the consumer, who therefore incurs in additional cognitive load.
Algorithmic content personalization and curation is one strategy that can help to reduce in-formation overload and increase the user experience (Rader, 2017) by tailoring the information displayed based on the system’s assertion of what the user wants (Bozdag,2015). However, it has been shown that this approach can introduce a new set of problems. Algorithms do not operate objectively and impartially, there are decisions, choices, and influences, embedded into them by humans. They can be biased (Friedman and Nissenbaum, 1996). Despite potentially reducing information overload by only showing users information deemed relevant, content personalization and curation algorithms can create “echo chambers” and “filter bubbles”. If the information pre-sented is mostly about issues with which users already agree, limiting their exposure to different perspectives can amplify biases and isolate them in their own ideological and cultural bubbles.
Additionally, particularly in systems without any human intervention, the issue of informa-tion credibility still applies. One such example is Facebook’s News Feed, which uses hundreds of signals to determine what stories to display to users, including the number of shares, likes, and comments. This means that highly popular and shared pieces of content, despite being false, can be rewarded by the system and displayed in more feeds. This prominence can then lead to more shares, likes, and comments, therefore creating a self-reinforcing cycle. The rampant dis-semination of fake, but highly shared, news on Facebook related with the 2016 USA presidential election (Silverman,2016), coupled with the fact that 44% of USA adults get news on the site (Pew Research Center,2016a), led to discussions about the potential impact of false news on the elec-toral outcome.
It has since been shown that most of the fake news stories disseminated on social media favoured the winning candidate, Donald Trump, over the runner-up, Hillary Clinton (Allcott and Gentzkow,2017). Some commentators have expressed their belief that fake news shared on social media helped elect Donald Trump (Parkinson,2016). However, recent research has indicated this is unlikely (Allcott and Gentzkow,2017). After being criticized for letting fake news run rampant on its platform, Facebook has recently informed that it’s working on implementing mechanisms to curb the spread of false stories (Facebook,2016b). Even though in this case initial studies indi-cate that the election’s outcome wasn’t determined by the spread of misinformation, studies have shown that algorithmic manipulation can indeed shift voting preferences. Epstein and Robertson
(2015) conducted a large scale study which estimated that the manipulation of a search engine’s ranking algorithm could change the outcome of more than 25% elections worldwide.
Despite the increasingly important role played by algorithms in our society, their presence and operation is still mostly opaque. It has been shown that many Facebook users are unaware that their news feed is generated by algorithms and that, due to this unfamiliarity with the system’s operation, they “make inferences about their relationships, wrongly attributing the composition of their feeds to the habits or intent of their friends and family” (Eslami et al.,2015).
1.1
Motivation and Goals
While helpful to tackle information overload, the combination of news aggregation and per-sonalization and curation algorithms can entail nefarious outcomes. These include the spread of misinformation, locking users in cultural and ideological bubbles or amplifying existing ones, making wrong inferences due to a lack of awareness of the algorithm’s presence, or even possi-ble interferences in democratic processes. These potentially far-reaching effects, in conjunction with the fact that many systems which employ algorithms do not reveal their influence or opera-tion, have led to a growing discussion, inside and outside of the academia, about how to achieve algorithmic transparency and accountability.
However, the discussion about algorithmic transparency in news media is still in its infancy. Normative approaches are lacking, and concerns about possible negative impacts on the users’ experience have been mentioned. Some potential strategies have been discussed in the literature.
These include disclosing the algorithms’ existence and influence, providing transparent informa-tion about how they operate, and let users manipulate the system, not the other way around.
This study aims to contribute to this field by achieving two goals. This first is to identify a set of criteria that users would like to manipulate in an algorithmic news aggregator, assess the importance of providing transparency information about the algorithm’s presence and operation, and determine how much control they desire to have over the system. To do so, we’ll address the following quantitative research question and sub-questions:
• In the context of an algorithmic news application, which criteria do users rate as most im-portant to manipulate?
– Regarding the news content
– Regarding the diversity of perspectives in the news – Regarding the publishers (sources)
– Regarding the information about the algorithm’s presence and inner workings – Regarding the degree of control (personalization) over the system
The second objective is to analyse the quantitative data resulting from answering the questions above and employ those findings, along with insights from previous works, to develop a func-tional prototype of an algorithmic news aggregator. The system will aim to address the aforemen-tioned issues of information overload, user control, and algorithmic transparency, while providing a pleasant experience based on the requirements expressed by the participants. Therefore, we intend to respond the following qualitative research question:
• How can the findings from this study be transposed to an algorithmic news aggregator con-cerned with user control and transparency?
1.2
Document Structure
This document is divided into six chapters, including this one,Chapter 1. Chapter 2reviews the state of the art and previous works related to information aggregation, algorithms, algorithmic transparency, and their intersection with the field of news media. Chapter 3reports the design employed in this study, the sample and its characterization, and the instruments and techniques used to gather and analyse data. InChapter 4, we present and discuss the results from the statistical analysis of the data collected.Chapter 5describes the implementation of the functional prototype and how the findings from this study were used to inform its development. Finally, inChapter 6, we present the conclusions, main outcomes, and limitations of this study, discuss the contributions, and identify future lines of work.
State of the Art
This chapter presents the state of the art and previous works related to news aggregators and algorithms and their interplay with news media. In addition to the definitions and typologies of the concepts under investigation, we identify the pros and cons that these systems and technologies entail and survey potential solutions to the issues that can arise. We also present findings from some user studies related with the investigated topics that can potentially guide us during the implementation of an algorithmic news aggregator, one of the expected outcomes of this work.
2.1
News Aggregators
Broadly, a news aggregator can be defined as “a website that takes information from multi-ple sources and displays it in a single place.” (Isbell,2010).Coddington(2015) builds upon this definition, adding that news aggregators collect information already published and present it in an abbreviated form (through headlines, summaries or excerpts). Thus, news aggregation can be defined as “taking information from multiple published sources and displaying it in an abbreviated form within a single place.” (Coddington,2015). In these definitions, the word “sources” refers to the content-producing organizations, not to the traditional journalistic sources often found in the literature, i.e., the people or entities who provide information to journalists.
Other definitions, despite classifying news aggregators similarly as the ones above, distinguish them from outlets that produce original material (Chowdhury and Landoni,2006;Stanyer,2009). The lack of original reporting is at the core of the criticism presented against news aggregators by their most vocal detractors, the so-called legacy news organizations, such as newspapers, televi-sion and radio networks (Anderson,2013). The audiences’ growing shift to the internet has been accompanied by a decline of the traditional media’s profits. This has lead many journalists and news executives to establish a causal nexus between the two events and accuse news aggregators of diverting traffic using stolen content (Isbell,2010).
There are, however, those who disagree with this stance. Journalist and professor Jeff Jarvis (as cited inAnderson,2013) considers that aggregators bring value to the table by creating an audience for the content produced by news organizations. Anderson(2013) also frames aggregation as a
practice that can add value to existing content. Through the creation of bundles of linked articles ranked according to criteria such as importance, popularity, and newsworthiness, aggregators can provide structure, order, and context, to multiple independently produced news stories.Anderson
(2013) notes that many of the skills required for traditional journalism, such as writing, news sense, and visual presentation, are also paramount in news aggregation. It should be noted, that in the context of Anderson’s work, the news aggregators are not the websites per se, but the people who manually collect information from multiple sources and use it to produce new pieces of content.
The distinction between automated and manual collection processes is an important one, be-cause it highlights the existence of many types of news aggregators. For instance, the main target of the traditional media companies criticisms are the automated aggregators owned by internet companies, such as the Google News1service (Anderson,2013). This disparity had led to some attempts to categorize the different types of news aggregators.
2.1.1 Types of News Aggregators
According toIsbell(2010), news aggregators can be grouped into four categories: Feed Ag-gregators, Specialty AgAg-gregators, User-Curated AgAg-gregators, and Blog Aggregators.
Feed Aggregators, such as Google News1, collect material from multiple websites and organize it into feeds, displaying the stories’ headlines, excerpts and links to the full content on the originating source.
Specialty Aggregators also collect information from multiple sources but restrict their scope to a particular topic. An example is the technology news aggregator Techmeme2.
User-Curated Aggregators, such as Reddit3 and Digg4, are websites where the content is sub-mitted by the users. Content is usually picked from a more eclectic set of sources than most news aggregators, including blog posts, videos or pictures.
Blog Aggregators are blogs that produce content based on original material collected from other sources. The Huffington Post5 and Gawker6 (recently discontinued) are two examples of such aggregators.
Despite providing an useful baseline for comparison between distinct types of aggregators, some limitations of this model have been pointed. Coddington(2015) argues that this typology has issues of classification (in the case of specialty and blog aggregators) and mutual exclusivity (an aggregator from one type can pertain to any of the others).
1http://news.google.com 2http://techmeme.com 3http://reddit.com 4http://digg.com 5http://huffingtonpost.com 6http://gawker.com/
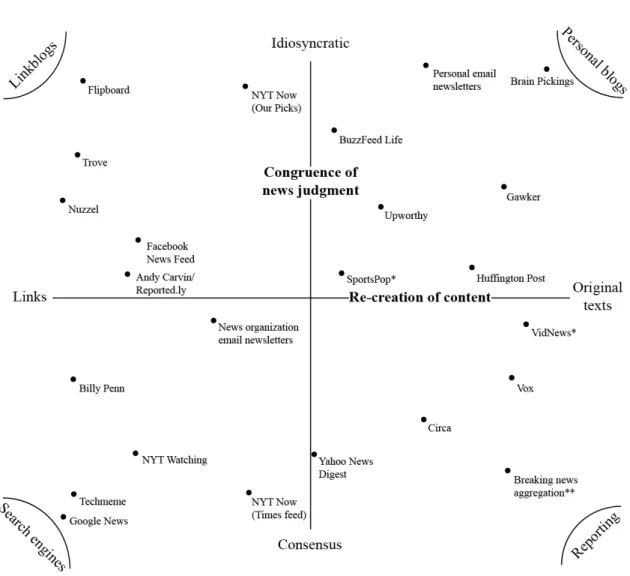
Figure 2.1: Typology of News Aggregators (Coddington,2015)
The author proposes a different typology involving two dimensions: a horizontal one that measures the degree to which the content is recreated, and a vertical dimension representing the degree to which the content offered adheres to the professional consensus of newsworthiness and authority (Figure 2.1). Automated aggregators, which provide minimal or no recreation of content fall on one end of the first dimension, while aggregators which use information gathered from other sources as a starting point for new content are located near the other pole. As for the second dimension, on one end are the aggregators aiming to provide the most newsworthy stories from prominent sources, and on the opposite pole are the ones focusing more on eclectic and niche content.
2.1.2 User Experience and Usability of News Aggregators
Research about the user experience and usability of news aggregation websites is, to our knowledge, practically non-existent. One exception is the study conducted by Chowdhury and Landoni (2006). In order to inform the development of a novel news aggregation service, the
authors sought to identify what users expect and value in such platforms. Five aggregators were evaluated — Headlinespot7, TVEyes8, Newsburst (discontinued), Google News1, and Awasu9— through an online questionnaire (45 participants) and interviews (10 participants). The question-naire was divided in two parts: the first to assess user expectations of a news aggregators, and the second to collect information about the user experience with the evaluated services. Results reveal the most highly rated features in news aggregators were:
• Advanced search functionalities (considered essential by 80% of users) • User-friendly interface (78%)
• High quality and reputable sources (76%) • Search the past for related stories (71%) • Browsing functionalities (69%)
• Presenting stories in chronological order (65%) • Personalization (62%)
Other popular choices (with around 50% of users) were summarization, geographical person-alization, multimedia features, ability to follow stories, and alert service functionalities. Despite the limitations pointed by the authors — limited sample size and a reasonably homogeneous user group —, these findings provide some guiding principles for the development of a news aggrega-tion system.
2.2
Algorithms and News
An algorithm is a “systematic procedure that produces — in a finite number of steps — the an-swer to a question or the solution of a problem” (Britannica). Due to the increasingly relevant role algorithms play in our lives, they have been called the “new power brokers in society” ( Diakopou-los,2014). This is not an overstatement. For instance, in a study consisting of five experiments conducted with more than 4500 participants in two countries,Epstein and Robertson(2015) indi-cate that the manipulation of a search engine’s ranking algorithm could shift the voting preferences of undecided voters by 20% or more (up to 80% in some demographics), with almost no visible traces of manipulation. As many elections are won by close margins, the authors estimated that the outcome of more than 25% elections worldwide could be changed through search ranking ma-nipulation. The implications of this effect led one of the authors to affirm it’s a “serious threat to the democratic system of government.” (Epstein,2015).
7http://www.headlinespot.com/ 8http://www.tveyes.com/ 9http://www.awasu.com/
In the field of news media, algorithmic influence is mainly exerted through content curation and personalization, i.e., the tailoring of information based on the algorithm’s assertion of what the user needs, wants and his/her social connections (Bozdag,2015). By connecting users with the information the system presumes they want, these algorithms aim to reduce information overload and improve the user experience (Rader,2017).
The systematic and automated aspects of algorithms might lead to the belief that they remove human bias and operate objectively and impartially. However, contrary to this assertion, algo-rithms are not free of bias (Friedman and Nissenbaum,1996). Algorithms are programmed by people, therefore imbued with human influence, such as criteria choices, training data, semantics and interpretation (Diakopoulos,2014).
Another issue is the unawareness of the algorithms’ presence. The Facebook News Feed is often presented as an example of algorithmic invisibility. Facebook’s News Feed algorithm uses thousands of signals to display users the stories the system thinks are the most relevant (Facebook,
2016a). As a result, not all posts are displayed on the users’ feed, a fact that is unbeknownst to many. In a study conducted with 40 Facebook users, Eslami et al. (2015) found that 62.5% of participants didn’t knew that their Facebook News Feed was actively managed by an algorithm. Other studies indicate that this figure can be higher than 75% (Hamilton et al.,2014).Eslami et al.
(2015) underline the potential social implications of the algorithm’s invisible hand: “participants used News Feed to make inferences about their relationships, wrongly attributing the composition of their feeds to the habits or intent of their friends and family.”.
In order to understand how bias and mistakes can make their way into algorithms, it is impor-tant to grasp how these constructs make decisions.
2.2.1 How Algorithms Decide
Diakopoulos(2014,2016) describes the multiple steps involved in the decision-making pro-cess of algorithms.
Prioritization is employed to determine which criteria or metrics to emphasize in detriment of others. Since there are choices involved in which criteria to prioritize, such algorithmic decisions can introduce bias.
Classification is the process that categorizes an entity as pertaining to a given class based on the entity’s features. There can be uncertainty in categorizing an entity one way or another, leading to classification errors and bias. Theses mistakes are known as false positives (an entity belongs to class A but is classified as B) and false negatives (an entity belongs to class B but is classified as A). Even though algorithms can be tuned to make fewer mistakes of a single type, this has implications, since it often results in more mistakes of the other type. Association is the process of creating relationships between entities. Similarly to classification,
is related to how people can interpret those associations, i.e., the association of an entity with a negatively connoted one can be perceived as a causal link rather than simple correlation. Filtering involves the inclusion or exclusion of information based on various rules or criteria.
Information can be filtered in or out according to previous prioritizing, classification, or association decisions. Filtering decisions can overemphasize or exclude certain information, and therefore potentially contribute to create filter bubbles, i.e., amplify biases and prevent exposure to diverse perspectives by showing information with which people already agree. While the decision-making process of algorithms might be conceptually simple to fathom, the decisions, choices, and influences embedded into them by humans are often undisclosed, making them akin to “black boxes” (Diakopoulos, 2014). The rise of algorithm usage in news media, and the potential social implications it entails, have led to a call for algorithmic transparency and accountability.
2.2.2 Algorithmic Transparency
Research about how systems can be transparent about the use of algorithms is still at an em-bryonic phase. There are no agreed upon standards, and regulation is still lacking (Diakopoulos,
2016). Some attempts to fill this gap have been made. TheAssociation for Computing Machinery US Public Policy Council (2017) recently published a press release listing a set of recommen-dations to increase algorithmic accountability and transparency. The document mentions seven principles:
Awareness All stakeholders of algorithmic systems should be aware of the potential biases em-bedded in the code and the possible negative outcomes to individuals and society.
Access and redress Algorithmic systems should provide mechanisms through which individuals and groups negatively impacted can question and rectify the outputs.
Accountability Institutions using algorithms in their decision making process should be held responsible for those decisions.
Explanation Explanations about the algorithms’ procedures and the specific resulting decisions should be provided.
Data Provenance Information about how the training data was collected and the exploration of potential biases induced by the data-gathering process should be maintained. In order to protect privacy, intellectual property and preventing gaming the system, access to this infor-mation can be restricted to qualified and authorized individuals.
Auditability Information about the models, data, algorithms, and decisions, should be recorded in order to allow its auditing when harm is suspected.
Validation and testing Models should be rigorously validated, particularly to assess if they can be harmful, and the process documented and, ideally, made public.
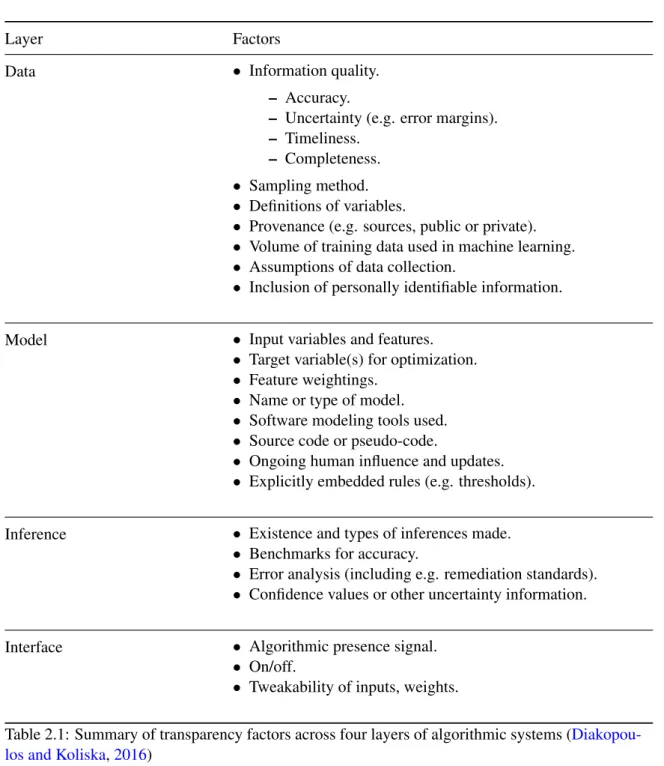
Research with representatives from the news field has also resulted in some recommendations. After conducting a study with 50 participants from the news media industry and academia, Di-akopoulos and Koliska(2016) identified four layers of algorithmic systems on which transparency factors might be disclosed: data, model, inference, and interface. A summary of the authors’ findings is presented inTable 2.1. Diakopoulos and Koliska(2016) also mention two major chal-lenges to algorithmic transparency in news media: i) the lack of financial incentives (e.g., the costs imparted on producing transparency information, loss of competitive advantages, legal issues, or opening the door to manipulation), and ii) the concern of negatively affecting the user experience by presenting too much information.
2.2.3 User Experience of Algorithmic Transparency
As mentioned previously, the topic of algorithmic transparency is still in its infancy, resulting in a deficit of normative approaches. However, some starting points have been provided in the scholarly literature.
Hamilton et al. (2014) proposed three approaches to investigate algorithmic awareness and its influence on user behaviour: “(1) surveying users to determine their awareness of processes at work in their everyday consumption; (2) exposing hidden algorithmic processes to users and then studying the effects of knowledge on use; and (3) working with users to try and deduce the algorithmic processes at hand, as well as the design rationales behind them”.
In effect, some of these approaches, individually or combined, have been employed by some studies.Eslami et al.(2015) investigated the issues of algorithmic awareness by showing partic-ipants the difference between two versions of their News Feed, one curated by Facebook’s algo-rithm and one without curation. The authors found that the study’s participants unaware of the curation (62.5%) reacted negatively after discovering the algorithm’s presence. However, after some time, knowledge about the algorithm increased satisfaction with the product. Based on these findings, the authors suggest that disclosing the algorithm’s existence can give users a sense of agency and control, thus enhancing the experience.
Similarly,Kizilcec (2016) found that a user interface (UI) that promotes algorithmic trans-parency can elicit positive attitudes, namely increase the users’ trust towards the system. Never-theless, the author found that too much transparency can potentially negate the positive effects, which might indicate “a bell-shaped relation between transparency and trust”.
Diakopoulos and Koliska (2016) research with representatives from the news media indus-try and academia also provides some insights on how algorithmic transparency can be conveyed through UIs. These include signalling algorithmically processed content by displaying an icon next to it; allowing the manipulation and tweaking of the algorithm’s input parameters — as well as the ability to turn it on and off —, and visualizing the output; or providing interactive cues linking to textual descriptions of the algorithm’s operation.
Layer Factors
Data • Information quality.
– Accuracy.
– Uncertainty (e.g. error margins). – Timeliness.
– Completeness. • Sampling method. • Definitions of variables.
• Provenance (e.g. sources, public or private). • Volume of training data used in machine learning. • Assumptions of data collection.
• Inclusion of personally identifiable information.
Model • Input variables and features.
• Target variable(s) for optimization. • Feature weightings.
• Name or type of model. • Software modeling tools used. • Source code or pseudo-code.
• Ongoing human influence and updates. • Explicitly embedded rules (e.g. thresholds).
Inference • Existence and types of inferences made. • Benchmarks for accuracy.
• Error analysis (including e.g. remediation standards). • Confidence values or other uncertainty information.
Interface • Algorithmic presence signal.
• On/off.
• Tweakability of inputs, weights.
Table 2.1: Summary of transparency factors across four layers of algorithmic systems ( Diakopou-los and Koliska,2016)
A study with thousands of participants from all over the world found that users were strongly concerned that algorithmic news applications might not expose them to important information and challenging perspectives, and also jeopardize their privacy (Newman et al.,2016). Algorithmic transparency can potentially assist in alleviating those worries.
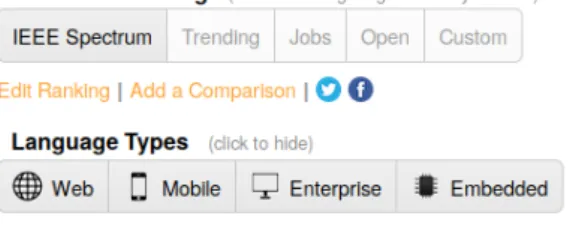
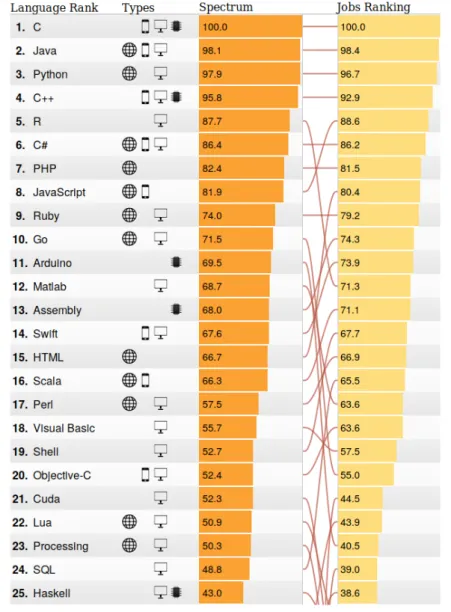
Some of the insights mentioned above can be seen in action on the IEEE Spectrum Top Pro-gramming Languages Interactive Ranking web application10(Diakopoulos et al.,2014). As shown inFigure 2.2, the application’s UI allows users to manipulate the algorithm that generates the rank-ing by changrank-ing the weightrank-ings of each data source, and then check the effect of these alterations. The system also permits a side-by-side comparison of two rankings, displaying a visualization of the ordering differences between them (Figure 2.3). A web page detailing the sources of data and the methods used is also available11.
According toDiakopoulos(2016), about one in six of the 1285 tweets about the application indicated that users were reweighting the ranking in multiple ways, which might be indicative of a successful design.
10http://spectrum.ieee.org/static/interactive-the-top-programming-languages-2016 11http://spectrum.ieee.org/ns/IEEE_TPL_2016/methods.html
Figure 2.2: IEEE Spectrum Top Programming Languages Interactive Ranking: Weighting manip-ulation. Screen capture from http://spectrum.ieee.org/static/interactive-the-top-programming-languages-2016
Figure 2.3: IEEE Spectrum Top Programming Languages Interactive Ranking: Ranking compar-ison. Screen capture from http://spectrum.ieee.org/static/interactive-the-top-programming-languages-2016
2.3
Summary
In this chapter, we defined the different types of news aggregators and identified some features that can improve the experience of end-users of these systems. Then, we presented the implica-tions that the opaqueness and manipulation of algorithms can have in society. We reviewed the different steps that these computer programs use to make decisions, and presented the discus-sion on how they can be made more transparent. Finally, we surveyed some strategies to convey transparency and provide control to end-users of algorithmic systems. The literature reviewed in this chapter provided us with several guiding cues regarding the development of an algorithmic news aggregator. Our application won’t recreate content and will focus on professionally pro-duced news stories. According to the typologies surveyed it would therefore classified as a feed aggregator (Isbell,2010) located in the lower left quadrant of the categorization presented by Cod-dington(2015) (Figure 2.1). It will also aim to provide a user friendly interface, high quality and reputable sources, and personalization features (Chowdhury and Landoni, 2006). Algorithmic transparency and control will be conveyed through the UI layer, using strategies such as signalling the algorithm’s presence, allow users to change their news feed by manipulating the algorithm’s parameters, and provide textual descriptions of how it operates (Diakopoulos and Koliska,2016;
Methods
In this chapter we start by describing the study design, the participants and their main de-mographic characteristics, the sampling process and its implications regarding representativeness. We then describe the data gathering instruments used and the procedure followed to conduct the experiment, and explain how the collected data was analysed. Finally, we characterize the sample in terms of news consumption habits.
3.1
Study Design
This study employed a non-experimental design, i.e., there was no independent variable ma-nipulation nor a control group or multiple measures. A quantitative instrument – a structured questionnaire – was used to collect standardised data about the variables of interest.
3.2
Participants
Our sample was comprised of four hundred and thirty two (n = 432) participants (235 women, 194 men, and 3 who didn’t disclosed the gender). They were divided in six age groups: 15-24 (n = 227), 25-34 (n = 141), 35-44 (n = 32), 45-54 (n = 18), 55-64 (n = 11), 65+ (n = 2). One participant didn’t disclosed the age group. The sample mainly consisted of bachelor’s, master’s and doctorate students from multiple programmes, academic staff (primarily professors) of various ranks, and also some former students with a wide range of professions.
3.2.1 Sampling method
Participants were recruited via an email sent through the University of Porto’s (U.Porto) in-formation system email service. Due to administrative restrictions that limit whom students can contact via email, accessing the address list of the whole population – the U.Porto academic com-munity – wasn’t possible. This study’s sample was therefore drawn after contacting the follow-ing groups: students and professors from the Communication Sciences Bachelor’s and Master’s programmes at the Faculty of Letters (FLUP), academic staff from the Faculty of Economics
(FEP), and to every student enrolled between 2009 and 2016 in FLUP, FEP, Faculty of Engi-neering (FEUP), Faculty of Fine Arts (FBAUP), and Faculty of Sciences (FCUP). No personally identifiable information was collected, so participants operated under complete anonymity.
Since no form of random selection could be employed, because of the aforementioned re-strictions to the sampling process, this study used a purposeful non-probability sample. Thus, no assumptions can be made regarding the sample’s representativeness.
3.3
Instruments
Data was gathered through a structured questionnaire written in Portuguese. The questionnaire was designed and hosted on the Google Forms1platform. For the purpose of this dissertation, the questionnaire was translated to English by the author. The English version of the full questionnaire can be found inAppendix A.1. The original version in Portuguese is available inAppendix A.2. Below we present the different variables investigated for each group and the count of questionnaire items.
• Demographics (age group, gender, occupation, scientific area of training, and academic degree) – 5 items
• News consumption habits (frequency of consumption, level of interest in news, type of media used to get news) – 3 items
• Level of importance of criteria regarding the news content – 17 items
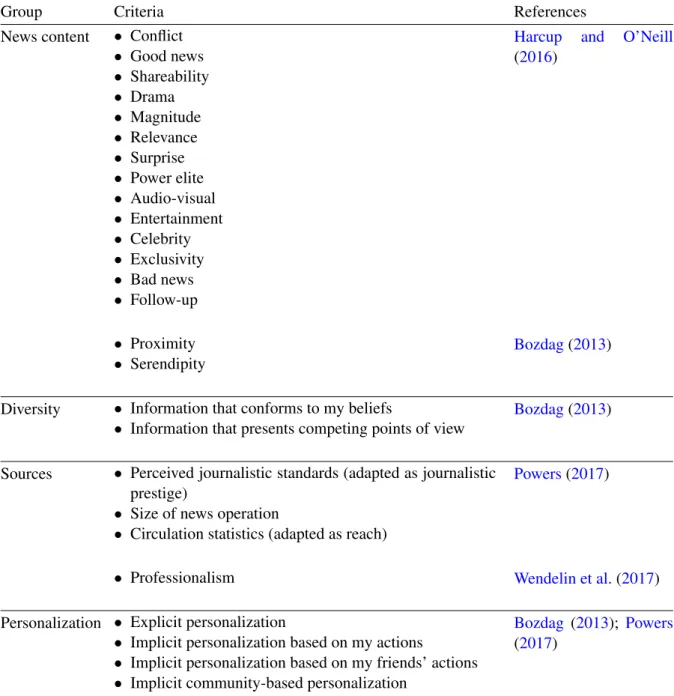
• Level of importance of criteria regarding the diversity of perspectives in the news – 2 items • Level of importance of criteria regarding the sources that produce the news – 5 items • Level of importance of criteria regarding the information about the algorithm – 2 items • Level of importance of criteria regarding the personalization of the news feed – 5 items A Likert five-item scale, with the levels “Very Important’, “Important”, “Moderately tant”, “Little important”, and “Not at all important”, was employed for rating the level of impor-tance of the criteria. An additional level, labelled “I don’t know/Won’t answer”, was added to allow explicit non-responses. The questionnaire was piloted with four researchers. Based on their feedback, some redundancies in the descriptive text were eliminated, but no changes were made to the items, considered clear and adequate. No instrument was found in the literature susceptible of being adapted to the purposes of this study. The questionnaire employed was developed specif-ically for this study, and therefore not validated. However, the majority of the criteria were drawn from the literature.Table 3.1lists the criteria by group and the corresponding references.
Table 3.1: List of criteria by group and corresponding references
Group Criteria References
News content • Conflict • Good news • Shareability • Drama • Magnitude • Relevance • Surprise • Power elite • Audio-visual • Entertainment • Celebrity • Exclusivity • Bad news • Follow-up
Harcup and O’Neill
(2016)
• Proximity • Serendipity
Bozdag(2013)
Diversity • Information that conforms to my beliefs
• Information that presents competing points of view
Bozdag(2013)
Sources • Perceived journalistic standards (adapted as journalistic prestige)
• Size of news operation
• Circulation statistics (adapted as reach)
Powers(2017)
• Professionalism Wendelin et al.(2017)
Personalization • Explicit personalization
• Implicit personalization based on my actions
• Implicit personalization based on my friends’ actions • Implicit community-based personalization
Bozdag (2013); Powers
3.4
Procedure
A link to the questionnaire was included in the recruitment email, which also mentioned the study’s context, goal, and the approximate time needed to fill (based on the pilot test). The English translation of the email sent to the participants is inAppendix B.1, and the original Portuguese in
Appendix B.2. Further instructions and information were included in the questionnaire’s descrip-tive text. An effort was made to provide examples and clarify potentially confusing concepts, and avoid technical jargon. Responses to the questionnaire were collected during a period of 34 days (from April 27 to May 30, 2017) and automatically saved in an online spreadsheet, a feature provided by the platform used to create the questionnaire.
3.5
Data Analysis
Data analysis was performed using a R programming language2 script developed by the au-thor in the RStudio Integrated Development Environment3. Questionnaire data was published to an URL in CSV format and then imported to RStudio. In addition to some data cleaning oper-ations, such as removing irrelevant columns and the four duplicate responses identified, a set of functions was implemented to convert the variables into factors. Factors are a data object in R which categorize the data as a finite number of numeric levels and therefore allow the statistical analysis of the two data types collected: nominal and ordinal variables.
A set of functions to plot the processed data was also developed. The mean was chosen as the measure of central tendency due to the considerable sample size. Pairwise group comparisons were performed using the Pearson’s Chi-squared test for nominal variables, and the Mann-Whitney test for ordinal data. The choice of a non-parametric method was due to the fact that the data was found to not follow a normal distribution. An alpha of 0.05 was selected for rejecting the null hypothesis that there weren’t significant differences between groups.
3.6
Sample Characterization
In this section we characterize the study’s sample in terms of news consumption habits. They were assessed through three questionnaire items: frequency of news consumption, level of interest in news, and type of media used to consume news.
It was found that the majority of the participants gets news from television (71.2%), social networks (70.5%), and the media organizations’ own websites and applications (69%), consumes news several times per day (57.3%), and is interested (45.9%) or very interested (26.3%) in news. News consumption habits were also analysed in terms of age and gender groups. In order to explore the effect of age in more generational terms, the six original age groups were recoded into two aggregating groups: 15-44, comprised of every participant from the 15-24, 25-34, and
2https://www.r-project.org/ 3https://www.rstudio.com/
35-44 groups, and 45-65+, with all participants from the 45-54, 55-64, and 65+ groups. Some variation was found between age and gender groups regarding the media type used to consume news, interest in news, and frequency of news consumption.
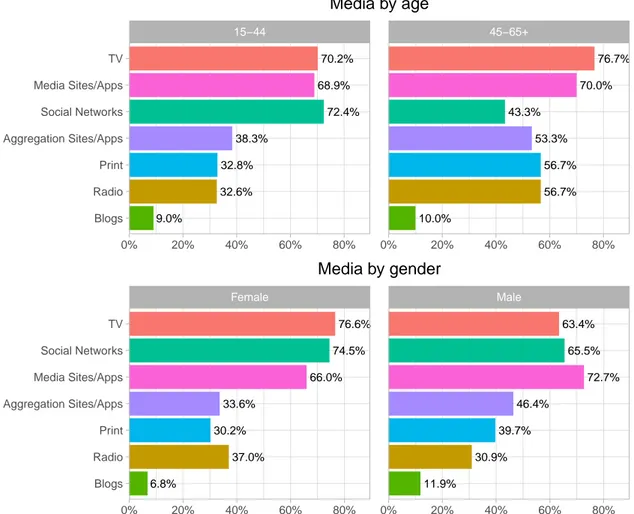
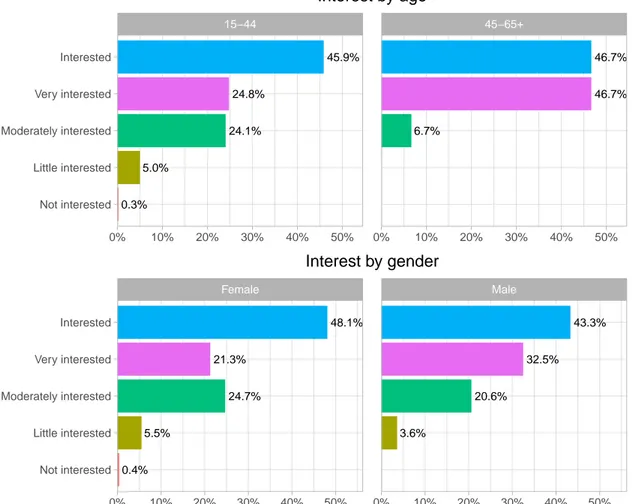
Participants from the 15-44 group mostly get their news from social networks (72.4%), televi-sion (70.2%), and the media’s own websites or applications (69.3%). The 45-65+ group primarily get news from television (76.7%), the media’s websites or applications (70%), and equally from print and radio (56.7%). This is shown in Figure 3.1. Regarding the interest in news, displayed inFigure 3.2, the majority of the respondents from the 15-44 group are interested (45.9%) or very interested (24.8%) in news, while most of the participants from the older group indicated that they are equally very interested or interested in news (46.7%). As for frequency of consumption, shown inFigure 3.3, the 15-44 and 45-65+ groups mainly consume news several times per day, albeit in different proportions – 56.6% and 66.7%, respectively.
Regarding the gender, women get most of their news from television (76.6%), social net-works (74.5%), and the media’s websites or applications (66%). Men primarily get news from the media’s websites or applications (72.7%), social networks (65.5%), and television (63.4%), as shown inFigure 3.1. Women are mainly interested (48.1%) or moderately interested (24.7%) in news, while men indicated to be interested (43.3%) or very interested (32.5%) (Figure 3.2). The frequency of consumption between genders, displayed inFigure 3.3, shows that the majority of women and men consumes news several times per day – 55.3% and 59.8%, respectively.
In order to examine the significance of group differences beyond the tendencies presented above, inferential statistical tests were performed – Chi-squared tests for nominal variables (type of media), and Mann-Whitney tests for ordinal variables (interest in news and consumption fre-quency). Differences between men and women were found to be statistically significant regarding all measured dimensions – type of media used to get news, interest in news, and consumption fre-quency (p < 0.05). Gender differences across all levels were also inspected, via two-proportions z-tests. A two-tailed z-test indicated that the proportion of media type used by gender was signifi-cantly different for television, social networks, aggregation websites/applications and print media (p < 0.05). Results from one-tailed z-tests showed that, proportionally, at the 0.05 significance level, women get significantly more news from television and social networks than men. On the other hand, the proportion of men who consume news through print, blogs, and aggregation sites/applications was found to be significantly higher than women’s at the 0.05 significance level. A two-tailed z-test showed that the proportion of interest in news by gender was significantly dif-ferent at the “Very interested” level. The proportion of men who declared to be very interested in news was found to be, via a one tailed z-test, significantly higher than the women’s. Regarding the frequency of consumption, a significant difference in proportions was found at the “several times a week” level, which a subsequent one-tailed z-test showed to be significantly higher in women.
Differences between age groups were found to be significant in terms of interest in news (p < 0.05), but not regarding the media type and consumption frequency. Interest in news by age group, in terms of proportions, was found to be significantly different at the “Moderately interested” and “Very interested” levels by a two-tailed z-test. A subsequent one-tailed z-test
indicated that the proportion of participants from the 15-44 age group moderately interested in news was significantly higher than the 45-65+ group. Conversely, a significantly greater proportion of participants from the 45-65+ group was found to be very interested in news.
In order to assess if our results were in line with existing works, we compared them with the findings from a report about the socio-demographic profile of Portuguese news consumers, conducted with 1049 participants and based on data from 2015 (Obercom, 2016). Generally, results from this study reflect the report’s findings. Regarding gender differences, these include the fact that, when compared to men, women resort more to social networks and consume less news. In terms of age differences, the data from Obercom(2016) also mirrors our finding that older people are more interested in news than younger generations.
70.2% 32.6% 9.0% 72.4% 32.8% 38.3% 68.9% 76.7% 56.7% 10.0% 43.3% 56.7% 53.3% 70.0% 15−44 45−65+ 0% 20% 40% 60% 80% 0% 20% 40% 60% 80% Blogs Radio Print Aggregation Sites/Apps Social Networks Media Sites/Apps TV Media by age 76.6% 37.0% 6.8% 74.5% 30.2% 33.6% 66.0% 63.4% 30.9% 11.9% 65.5% 39.7% 46.4% 72.7% Female Male 0% 20% 40% 60% 80% 0% 20% 40% 60% 80% Blogs Radio Print Aggregation Sites/Apps Media Sites/Apps Social Networks TV Media by gender
0.3% 5.0% 24.1% 45.9% 24.8% 6.7% 46.7% 46.7% 15−44 45−65+ 0% 10% 20% 30% 40% 50% 0% 10% 20% 30% 40% 50% Not interested Little interested Moderately interested Very interested Interested Interest by age 0.4% 5.5% 24.7% 48.1% 21.3% 3.6% 20.6% 43.3% 32.5% Female Male 0% 10% 20% 30% 40% 50% 0% 10% 20% 30% 40% 50% Not interested Little interested Moderately interested Very interested Interested Interest by gender
0.5% 0.5% 2.3% 8.0% 16.8% 56.6% 4.5% 10.8% 3.3% 20.0% 66.7% 3.3% 6.7% 15−44 45−65+ 0% 20% 40% 60% 0% 20% 40% 60% <1x month 2−3x month 1x week 1x hour >1x week >1x hour 1x day >1x day Frequency by age 0.4% 0.9% 3.0% 10.6% 16.2% 55.3% 3.4% 10.2% 0.5% 1.0% 4.1% 18.0% 59.8% 5.7% 10.8% Female Male 0% 20% 40% 60% 0% 20% 40% 60% <1x month 2−3x month 1x week 1x hour >1x week >1x hour 1x day >1x day Frequency by gender
3.7
Summary
This chapter presented the methodology employed in this non-experimental study. A sample of 432 participants from the University of Porto filled a questionnaire measuring demographics, news consumption habits, and the level of importance of a set of criteria, mostly drawn from the literature, related with news content, diversity, sources, algorithmic information, and personaliza-tion.
Data was analysed using a R script and the sample characterized in terms of news consumption habits: preferred media to get news, interest in news, and frequency of consumption. Participants indicated that they mainly get news several times per day from television, social networks and the publishers’ own websites or applications, and are interested or very interested in news. Differ-ences between age and gender groups were also investigated. They were found to be statistically significant (p < 0.05) in terms of the preferred media types, interest in news, and consumption frequency between men and women.
It was found that women get significantly more news from television and social networks than men, who display a significantly higher consumption of news through print, aggregation sites/applications and other media types. A significantly higher proportion of men declared to be very interested in news, and significantly more women indicated a consumption frequency level of several times a week. Regarding the two age groups examined – 15-44 and 45-66+ –, a significant difference was found regarding the interest in news. The proportion of participants from the 15-44 age group who were moderately interested in news was significantly higher than the 45-65+ group. Participants from the 45-65+ group, in turn, were found to be very interested in news in a significantly greater proportion than ones from the younger group. These results are mostly in line with a previous work about the socio-demographic profile of Portuguese news consumers.
Results
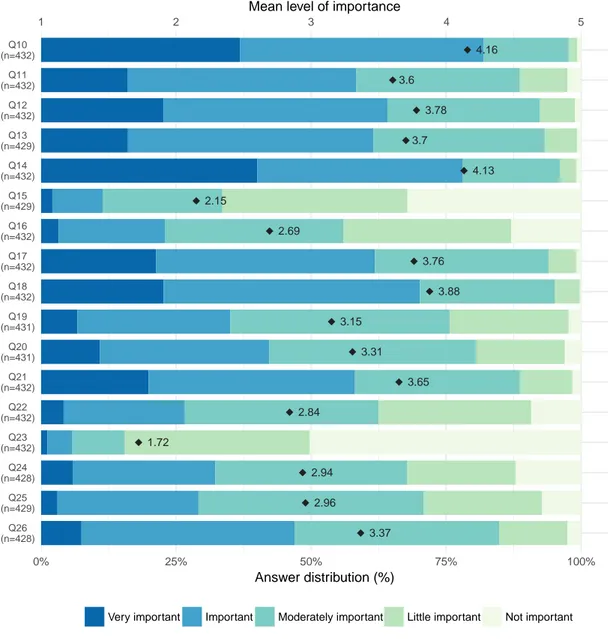
This chapter presents the data analysis results of the questionnaire items measuring the level of importance of the criteria related to news content, diversity, sources, algorithmic information, and personalization. Values corresponding to the non-response level (“I don’t know/Won’t answer”) were discarded from the analysis. Therefore, all the charts in this chapter present the number of valid observations below each item label in the format (n = #observations). Additionally, each chart presents two horizontal axes which should be read independently. The bottom one displays the percentage of responses for each importance level in decreasing order of importance. The top axis is meant to assist the interpretation of each item’s mean value. The numeric values displayed correspond to the importance level in ascending order according to a scale where a score value of 1 corresponds to the attribute “Not important”, 2 to “Little important”, 3 to “Moderately important”, 4 to “Important”, and 5 to “Very important”. Each chart is accompanied by a table listing the questionnaire items for each criteria group and the corresponding label as it was displayed to the respondents, including the examples and clarifications provided.
4.1
News Content Criteria
The importance of the criteria related to news content was measured by 17 items. These items and the corresponding labels are presented inTable 4.1. On average, participants rated “Time-liness” (Q10), with a mean score value of 4.16 (SD=0.79), and “Good news” (Q14), averaging 4.13 (SD=0.88), as the most important news content criteria. More than 75% of the respondents evaluated these two criteria as very important or important, placing them above the 4thimportance level, as shown inFigure 4.1. The conversion of the mean score values to the corresponding scale attribute indicates an average rating of “Important”.
The criteria “Relevance” (Q18) (M=3.88, SD=0.82), “Conflict” (Q12) (M=3.78, SD=0.9), “Magnitude” (Q17) (M=3.76, SD=0.88), “Serendipity” (Q13) (M=3.7, SD=0.83), “Audio-visual” (Q21) (M=3.65, SD=0.96), and “Proximity” (Q11) (M=3.6, SD=0.94), were found to be, on av-erage, closer to the 4th than to the 3rd importance level. The corresponding scale attribute of
these score values is also “Important”, albeit lower than the previous group in the hierarchy of importance.
Next are the “Follow-up” (Q26) (M=3.37, SD=0.89), “Power elite” (Q20) (M=3.31, SD=0.97), and “Surprise” (Q19) (M=3.15, SD=0.92) criteria. Their mean score values place them above of the 3rdimportance level, whose corresponding attribute is “Moderately important”. The criteria “Bad news” (Q25) (M=2.96, SD=0.94), “Exclusivity” (Q24) (M=2.94, SD=1.09), “Entertainment” (Q22) (M=2.84, SD=1.01), and “Drama” (Q16) (M=2.69, SD=1.03), were also close to the “Mod-erately important” level. Finally, near to the 2ndimportance level, whose corresponding attribute
is “Little important”, are the criteria “Sharing potential” (Q15) (M=2.15, SD=1.04), and “Celebri-ties” (Q23), which, with a mean score value of 1.7 (SD=0.9), was the least important criterion.
4.16 3.6 3.78 3.7 4.13 2.15 2.69 3.76 3.88 3.15 3.31 3.65 2.84 1.72 2.94 2.96 3.37 1 2 3 4 5 Q26 (n=428) Q25 (n=429) Q24 (n=428) Q23 (n=432) Q22 (n=432) Q21 (n=432) Q20 (n=431) Q19 (n=431) Q18 (n=432) Q17 (n=432) Q16 (n=432) Q15 (n=429) Q14 (n=432) Q13 (n=429) Q12 (n=432) Q11 (n=432) Q10 (n=432) 0% 25% 50% 75% 100%
Mean level of importance
Answer distribution (%)
Very important Important Moderately important Little important Not important
Table 4.1: News content criteria item labels ID Label
Q10 Timeliness (news published on top of the moment) Q11 Proximity (news about events near where I am) Q12 Conflict (news about controversies, strikes, wars)
Q13 Serendipity (discovering interesting information unexpectedly)
Q14 Good news (news with positive tones - cures, scientific advances, recoveries, victories and celebrations)
Q15 Sharing potential (news potentially able of generating shares and comments on Facebook, Twitter, and other social networks)
Q16 Drama (news about a developing drama such as escapes, accidents, searches, rescues, court cases)
Q17 Magnitude (important news due to the large number of people involved or potential impact)
Q18 Relevance (news about groups or nations understood as influential or historically and culturally similar to the audience)
Q19 Surprise (news with an element of surprise, contrast, out of the ordinary) Q20 Power elite (news about powerful entities such as individuals, organizations,
institutions or companies)
Q21 Audio-visual (accompanying news from photos, videos, audio and interesting graphics)
Q22 Entertainment (light news - sex, sport, show business, animals, humorous treatment)
Q23 Celebrities (news about famous people)
Q24 Exclusivity (original news and first published in a source) Q25 Bad news (news with negative tones - deaths, injuries, defeats) Q26 Follow-up (news about subjects already present in the news)
4.2
Diversity Criteria
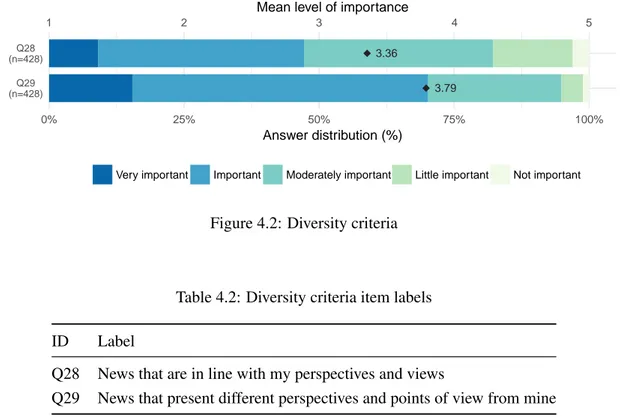
Diversity criteria importance was evaluated through the two items presented inTable 4.2. As shown inFigure 4.2, the importance of being exposed to news that present different perspectives and points of view from their own (Q29) was evaluated by the participants as the most important criterion of the two, with a mean score value of 3.79 (SD=0.79), and a corresponding scale attribute of “Important”. The importance of exposure to news in line with their perspectives, was rated on average as being “Moderately important”, with an average score value of 3.36 (SD=0.94)
3.36 3.79 1 2 3 4 5 Q29 (n=428) Q28 (n=428) 0% 25% 50% 75% 100%
Mean level of importance
Answer distribution (%)
Very important Important Moderately important Little important Not important
Figure 4.2: Diversity criteria
Table 4.2: Diversity criteria item labels ID Label
Q28 News that are in line with my perspectives and views
4.3
Sources’ Criteria
Responses to the sources’ criteria items, presented with their corresponding labels inTable 4.3, show that “Professionalism” (Q32) (M=4.34, SD=0.87) and “Journalistic prestige of the source” (Q30) (M=4.32, SD=0.79) were on average the two most important criteria, with an interpreted attribute of “Important”. This can be seen inFigure 4.3. The criteria “Reach of the source” (Q33) (M=3.33, SD=1) and “Size of the source’s operation” (Q31) (M=2.89, SD=1.04) correspond to the “Moderately important” attribute.
4.32 2.89 4.34 3.33 1 2 3 4 5 Q33 (n=429) Q32 (n=432) Q31 (n=425) Q30 (n=432) 0% 25% 50% 75% 100%
Mean level of importance
Answer distribution (%)
Very important Important Moderately important Little important Not important
Figure 4.3: Sources’ criteria
Table 4.3: Sources’ criteria item labels ID Label
Q30 Journalistic prestige of the source
Q31 Size of the source’s operation (the number of people working there)
Q32 Professionalism of the source (if the news are written by professional journalists) Q33 Reach of the source (if it reaches many people)
4.4
Algorithmic Information Criteria
Regarding the two items for algorithmic information criteria, shown inTable 4.4, they were evaluated, on average, as “Moderately important”. As displayed in Figure 4.4, the importance of having an indication that an algorithm was responsible for selecting the news (Q35) (M=3.3, SD=1.17) and information about the various steps used by the algorithm to achieve the selection (Q36) (M=3.32, SD=1.1) was rated similarly.
3.3 3.32 1 2 3 4 5 Q36 (n=425) Q35 (n=421) 0% 25% 50% 75% 100%
Mean level of importance
Answer distribution (%)
Very important Important Moderately important Little important Not important
Figure 4.4: Algorithmic information criteria
Table 4.4: Algorithmic information criteria item labels ID Label
Q35 Indication that news selection is done by a computer program
Q36 Information about the various steps used by the computer program to select the news presented
4.5
Personalization Criteria
Five items were employed to assess the importance of the personalization criteria. They can be found inTable 4.5. As shown inFigure 4.5, the ability to configure a news algorithm according to the user’s criteria – “Explicit personalization” (Q38) –, was rated on average as having the highest importance, with a mean score of 3.69 (SD=1.1) and a corresponding attribute of “Important”. The criteria implicit personalization based on the user’s actions (Q39) (M=3.01, SD=1.19) and no personalization (Q37) (M=2.92, SD=1.26) were rated closely, with a scale attribute of “Moderately important”. Finally, the criteria related with implicit personalization based on the community’s actions (Q41) (M=2.31, SD=1.1) and on the actions of friends (Q40) (M=2.15, SD=1.04) were judged on average as being “Little important”.
2.92 3.69 3.01 2.15 2.31 1 2 3 4 5 Q41 (n=427) Q40 (n=428) Q39 (n=428) Q38 (n=429) Q37 (n=417) 0% 25% 50% 75% 100%
Mean level of importance
Answer distribution (%)
Very important Important Moderately important Little important Not important
Table 4.5: Personalization criteria item labels ID Label
Q37 Without personalization (I do not want the program to create a news list adapted to my profile)
Q38 Explicit personalization (I want to be able to configure the program that generates the news list according to my criteria)
Q39 Implicit personalization based on my actions (I want the program to display news based on my action history - searches, clicks, comments, ’likes’, etc.)
Q40 Implicit personalization based on my friends actions (I want the program to display news based on my friends’ action history - searches, clicks, comments, likes, etc.) Q41 Implicit community-based personalization (I want the program to display news
based on the action history of most users - searches, clicks, comments, ’likes’, etc.)
4.6
Summary and Discussion
In this chapter, we presented the results obtained via the analysis of the participants’ responses to the different criteria assessed in the questionnaire. Regarding the news content, the most impor-tant criteria, rated on average as “Imporimpor-tant” and in decreasing order of mean score, were “Time-liness”, “Good news”, “Relevance”, “Conflict”, “Magnitude”, “Serendipity”, “Audio-visual”, and “Proximity”. As mentioned inSection 3.3, most of the these criteria were drawn fromHarcup and O’Neill(2016). The authors examined 711 lead news stories published in 10 United Kingdom’s (UK) newspapers in 2014 to investigate the frequency with which the criteria appeared on them. Additionally, they also examined the 25 most frequently shared news stories by UK users on two social networks – Facebook and Twitter – in 2014 to investigate if there were differences between the news values selected by journalists and the audience.
In order to be able to make a direct comparison with the findings fromHarcup and O’Neill
(2016), we recreated our ranking of importance as if it only contemplated the same criteria iden-tified by the authors. For instance, as “Timeliness” was not one of the criteria ideniden-tified by the authors, we went down our hierarchy of importance to find the first one that was, in this case “Good news”, and placed it in the position of the former, and so on. It should be noted that they identified a total of 10 criteria, but one of them – “Newspaper agenda” – wasn’t used in our ques-tionnaire.Table 4.6presents a comparison of the hierarchy of importance attributed by this study’s participants to each criteria with the frequency of appearance found byHarcup and O’Neill(2016) in news stories published by UK newspapers and shared by UK users on social media in 2014. Table 4.6: Importance level of the news content criteria evaluated in this study compared with their frequency of appearance in newspaper stories and news shared on social media found byHarcup and O’Neill(2016)
Criteria Importance level Frequency (Harcup and O’Neill,2016) Newspaper stories News shared on social media
Good news 1st 9th =7th Relevance 2nd 6th 5th Magnitude 3rd 7th 6th Follow-up 4th 4nd 4th Power elite 5th 5th 9th Surprise 6th 2rd 2nd Bad news 7th 1st 3rd Entertainment 8th 3rd 1st Celebrities 9th 8th =7th Newspaper agenda — 10th 10th