Printed version ISSN 0001-3765 / Online version ISSN 1678-2690 http://dx.doi.org/10.1590/0001-3765201820170111
www.scielo.br/aabc | www.fb.com/aabcjournal
Sensory acceptance and qualitative analysis of fruits in papaya hybrids
LUCAS N. DA LUZ1
, JULIO C.F. VETTORAZZI2
, RENATO SANTA-CATARINA2
, FABIO R. BARROS3, GISLANNE B.A. BARROS2, MESSIAS G. PEREIRA2 and DEISY L. CARDOSO4
1
Universidade da Integração Internacional da Lusofonia Afro-Brasileira/UNILAB, Instituto de Desenvolvimento Rural, Av. da Abolição, 3, Centro, 62790-000 Redenção, CE, Brazil 2
Universidade Estadual do Norte Fluminenses Darcy Ribeiro/UENF, Laboratório de Melhoramento Genético Vegetal/ LMGV, Av. Alberto Lamego, 2000, Parque Califórnia, 28013-602 Campos dos Goytacazes, RJ, Brazil
3
Universidade Estadual do Maranhão/UEMA, Centro de Estudos Superiores de Balsas/ CESBA, Praça Gonçalves Dias, s/n, Centro, 65800-000 Balsas, MA, Brazil 4
Universidade Anhanguera/UNIDERP, Unidade Agrárias, Av. Alexandre Herculano, 1400, 79037-280 Campo Grande, MS, Brazil
Manuscript received on April 7, 2017; accepted for publication on May 30, 2018
ABSTRACT
Over the last three years, Brazil has been ranked among the three largest producers of papaya. This study aimed to evaluate the acceptance and commercial standard of papaya fruits according to their sensory traits and provide information about the organoleptic and qualitative aspects of the fruit. Ten papaya genotypes grown in Linhares-ES were investigated, arranged in a randomized block design with four replications. Ten fruits from each genotype were randomly collected from each replication, which totaled 40 fruits per genotype. The fruit harvest was performed at stage 1 of maturation. The following genotypes were assessed: hybrids UC13, UC14, UC15 and UC16, from the ‘Solo’ group; hybrids UC03, UC10 and UC12, from the ‘Formosa’ group; and ‘Golden’, ‘Calimosa’ and ‘Tainung 01’, which were used as controls. The sensory evaluation of the genotypes was carried out in full balanced design by 50 evaluators. When submitted to sensory analysis, the hybrids showed high performance compared to the controls of each group. Traits such as aroma, flavor and overall impression were crucial in the selection carried out by the appraisers of the hybrids assessed. The hybrids UC10, UC12, UC14 and UC16 were the most accepted and preferred, respectively, in purchase intention.
Key words: Carica papaya L., Solo group, Formosa group, Heterotic group.
Correspondence to: Lucas Nunes da Luz E-mail: [email protected]
INTRODUCTION
Papaya is one of the main tropical fruits produced and consumed in the world, especially in Brazil, which is the second largest world producer and exporter (FAO 2013). Papaya is the fifth most consumed fruit in Brazil, with per capita values
ranging from 1.85 kg in 2002 to 2.05 kg in 2008 (Silveira et al. 2011).
Papaya is rich in a number of minerals, vitamins and proteins with high biological value.
According to Wall (2006), papaya has an average of 51.20 mg of vitamin C per 100 g of fresh fruit, a value close to that found in orange (53.20 mg 100
Despite its growth trend, papaya consumption in Brazil is still relatively low, compared to many other fruits. However, it has potential to increase in all social strata. According to Monidini (2010), only 15% of the Brazilian population, on average, considering different ages and regions of the country, eat the recommended daily amount of fruits and vegetables.
When selecting a certain fruit, consumers take into account traits such as fruit taste and appearance, which can be regarded as a standard of fruit quality and are decisive in customer satisfaction. Several studies on the sensory perception of consumers
about fresh fruit and / or fruit derivatives affirm
that sensory and nutritional quality parameters are fundamental for the perception of customer satisfaction (Neves and Lima 2010, Padilha et al. 2010, Berilli et al. 2011, Viana et al. 2012, Oliveira et al. 2013).
Sensory analyses to determine the levels of acceptance of cultivars are not usually performed in papaya, perhaps due to the small number of cultivars and hybrids developed for the Brazilian market. In crops such as pineapple (Berilli et al. 2011), banana (Matasuura et al. 2002), melon (Miguel et al. 2010), strawberry (Resende et al. 2008) and grape (Mascarenhas et al. 2013), sensory parameters are largely employed to determine the quality of the product.
Santana et al. (2004) assessed twelve promising papaya genotypes through sensory and physicochemical evaluations and found that the genotype CMF031 was the most accepted, with higher values for soluble solids (°Brix) and ascorbic acid. It can be considered the most appropriate, with good potential for fresh fruit market and industry. Other studies on the crop have been reported, such as the assessment of papaya jelly mixed with araçá-boi (Viana et al. 2012) and the acceptance of cereal bars with the addition of papaya seeds (Shigematsu et al. 2012). On the other hand, discussion about other fruits, as mentioned
above, can help identifying response patterns in fresh papaya assessment.
The present work aimed to assess the sensory attributes and aspects of fruit quality in pre-commercial papaya hybrids and estimate the correlation between sensory attributes and aspects of fruit quality, in order to identify the relationship between this correlation and consumer preference.
MATERIALS AND METHODS
The assessments were conducted in ten papaya genotypes grown in Linhares-ES, (19º23’28”S, 40º04’20”W, alt 33 m), arranged in a randomized block design, with four replications. Ten fruits were randomly collected from each genotype in each replication, totaling 40 fruits per genotype. The fruit harvest was performed at stage 1 of maturity, which corresponds to up to 10% of yellow fruit peel. The following genotypes were assessed, hybrids UC13, UC14, UC15 and UC16, from the ‘Solo’ group, which have small fruits, ranging between 0.4 and 0.7 kg, known as ‘papaya’ or ‘Hawaii papaya’; and hybrids UC03, UC10 and UC12, from the ‘Formosa’ group, which have large fruits, between 1.0 and 2.5 kg, both from the breeding program developed by the Universidade Estadual do Norte Fluminense Darcy Ribeiro – UENF in partnership with the Caliman Agrícola S.A. Company, named UENF/Caliman Program. The hybrids ‘Tainung 01’, from the ‘Formosa’ group, ‘Calimosa’, from the Formosa x Solo intergroup, and the cultivar ‘Golden’, from the ‘Solo’ group were used as controls.
laboratory, under white light for fruit external appearance, followed by the intent of purchasing it (PI2), and the internal appearance of fruits cut in half, lengthwise, followed by the intent of purchasing it (PI3). The 5-point mixed structured scale (Meilgaard et al. 2006) was used for internal and external fruit appearance and purchase intentions (PI1, PI2, PI3), 1: I certainly would not buy it; 2: I would possibly not buy it; 3: I might buy/not buy it; 4: I would possibly buy it; and 5: I would certainly buy it.
Nine variables were evaluated for the qualitative characterization of the fruits, including
five physical variables: fruit length – FL, measured
in millimeters from one end of the fruit to the other
using a digital caliper, average of five fruits in the
plot; fruit diameter – FD, measured in millimeters at the median region of the fruit; pulp thickness – TP, measured from the center of the fruit cavity to the edge of the shell, using a digital caliper,
measured in millimeters; and fruit firmness and pulp firmness (FF and PF) - measured from the
average puncturing of three equidistant points in the peel and pulp of the fruit, respectively, with the aid of a manual penetrometer, expressed in Newtons; and four biochemical variables: titratable acidity (TA) measured in g ml-1, soluble solids (SS), ratio between titratable acidity and soluble solids (SS/TA) and total sugar (TS) measured in g ml-1. The biochemical variables were evaluated based on the preparations of sample pulp, by the methodologies described in AOAC (1997). All these variables were evaluated in the UENF post-harvest laboratory.
The averages of the acceptance of sensory variables were compared by the Tukey test (p < 0.05), and the data of the physical and biochemical variables were subjected to the analysis of variance
by the F test (p < 0.01) to verify the significance of
the treatments, and the means were compared by the Tukey test (p < 0.05) (Santana et al. 2004). For the sensory data, it was calculated the frequency maturity, when between 71% and 85% of the fruit
peel is yellow and ideal for consumption.
The samples were prepared with mature fruits, ready for consumption, peeled and cut into slices of 5 x 2.5 cm, each weighing about 10 g. The apical and basal portions of each fruit, 5 cm each, were discarded. The portions of the samples were coded with three random digits and served in white plastic plates on acrylic trays.
The sensory evaluation of the genotypes was
performed in a complete balanced design (Macfies
and Bratchell 1989) by 50 appraisers. All genotypes were tasted by the appraisers, 60% of whom were female and 40% male, at ages ranging from 18 to 25 (42%), 26 to 35 (54%) and 36 to 45 years (4%). Among the evaluators, the level of appreciation of fresh papaya was 36% (I appreciate it moderately), 50% (I appreciate it very much) and 14% (I highly appreciate / love it).
The samples of papaya were offered to evaluators at two stages over a period of two
days of testing. On the first day, each evaluator received five samples coded with a random
three-digit number. On the second day, each evaluator
received six samples. The first one, the “dummy
sample”, is a replication of the last sample evaluated on the previous day of test. The evaluators used this dummy sample only to simulate the sense of continuity during the assessment of the genotype.
distribution of the responses. Both procedures were performed using the SAS Studio software system (SAS Institute, Cary, NC, USA).
The averages of the sensory variables were used to evaluate the formation of similarity groups between the genotypes assessed through the principal components technique (PC), using the GENES software system, version 2013.5.1 (Cruz
2013). The Pearson correlation coefficients between
the sensory, physical and biochemical variables
were estimated, and their significances were tested
by the t test (p < 0.05) using the GENES software system (Cruz 2013).
RESULTS AND DISCUSSION
Table I shows the comparisons of the means for
the sensory variables. A significant difference was
found by the Tukey test (p < 0.05) for all sensory
traits assessed, which indicates a different response
of the hybrids according to the analysis of the evaluators.
Overall, considering the set of variables analyzed, the hybrids UC14 and UC16 (Table I) presented the highest levels of acceptance among all genotypes assessed, even surpassing the reference control for the hybrids from the ‘Solo’ group, the variety ‘Golden’. The control ‘Tainung 01’ achieved the worst overall performance for acceptance of sensory attributes, in contrast to the hybrids UC12 and UC10, from the ‘Formosa’ group, (Table I), the most well accepted of this group. Among the controls, the hybrid ‘Calimosa’ presented the best averages for acceptance for all traits assessed.
Some differences were found between hybrids
UC14 and UC16, from the ‘Solo’ group (Table I), but they were almost always in the same average group for total traits, which demonstrates similar sensory behavior. Among the hybrids assessed, UC13 (Table I) showed the worst behavior, only compared to the control ‘Tainung 01’, except for
the traits external and internal appearance, in which UC13 presented behavior consistent with its group, thus exceeding the control ‘Golden’.
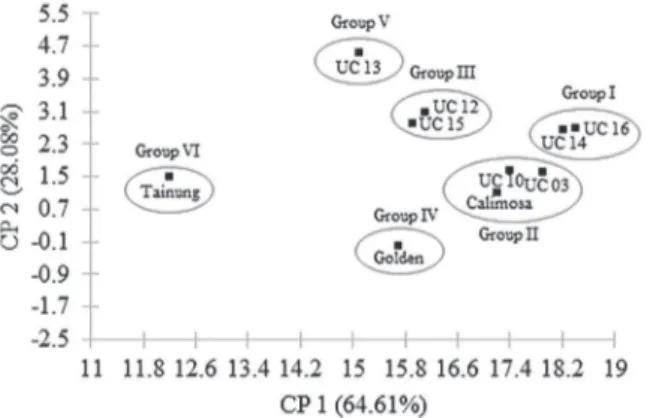
The sensory acceptance profile can also be analyzed by the principal component analysis. The principal component (PC) technique transforms a set of original data into a new set of data with equivalent size, but with properties of great interest for joint data analysis, such as independence between variables. These components are linear combinations of the variables, estimated in such
a way to retain the maximum variation in the first
components. Thus, they are associated to reduced data in divergence analysis (Cruz et al. 2013). Several authors have used the principal components to reduce the mass of data in sensory analysis, including in cakes (Padilha et al. 2010), grape (Mascarenhas et al. 2013), acerola (Neves and Lima 2010) and papaya jam (Viana et al. 2012), in order to jointly assess the set of traits investigated.
The first two principal components accumulated
92.70% of the variation present in the mass of data (Table II), thus exceeding the threshold of 80% suggested by Cruz et al. (2013) as appropriate for the interpretation of diversity from the principal components.
Figure 1 shows the diagram with the plotting of the scores based on the principal components for the sensory acceptance variables assessed in this study.
TABLE I
Averages of sensory acceptance and purchase intentions attributed by consumers (n = 50) to papaya hybrids and controls.
Genotype Acceptance
1
Purchase intention1
Aroma Flavor Texture OI ExtAp IntAp PI1 PI2 PI3
UC03 6.94ab 7.20a 7.14a 7.12a 6.50ac 7.10ab 4.00a 3.86a 3.84a
UC10 6.24abcd 6.99ab 7.08a 6.76ab 6.20bc 7.16ab 4.04a 3.36a 3.92a
UC12 5.80cde 5.78cd 6.34ab 6.02bc 6.66ac 7.26ab 3.04bcd 3.56bcd 4.14bcd
UC13 5.50de 5.02de 5.26cd 5.10cd 6.60ac 7.66ab 2.58cd 3.62cd 4.46cd
UC14 6.90ab 6.86abc 7.00a 6.96ab 6.86ab 7.80a 4.06a 3.98a 4.56a
UC15 6.16bcd 6.00bcd 5.94bc 6.06bc 6.56abc 6.80bc 3.12bc 3.84c 3.94bc
UC16 7.00a 6.94ab 7.24a 6.94ab 7.18a 7.66ab 4.10a 4.32a 4.52a
‘Golden’ 6.50abc 6.58abc 6.86ab 6.64bc 4.46d 5.64d 3.64ab 2.32ab 3.04ab ‘Calimosa’ 6.60abc 7.10a 7.20a 6.96ab 6.50abc 6.16cd 3.76b 3.78b 3.60b
‘Tainung 01’ 5.24e 4.62e 4.78d 4.88d 5.80c 4.48e 2.34d 3.12d 2.22d
1 Means with same letters in the same column do not differ significantly (p < 0.05) according to the Tukey test. ExtAp: External appearance. IntAp: internal appearance. 1: I extremely disliked / hated it; 2: I disliked it very much; 3: I disliked it moderately; 4: I slightly disliked; 5: I neither liked / nor disliked it; 6: I slightly liked it; 7: I liked it moderately; 8: I liked it very much; and 9: I extremely liked / loved it. (Peryam and Girardot 1952). PI1: purchase intent assessed during tasting.; PI2: purchase intent evaluated together with external appearance.; PI3: purchase intent evaluated together with internal appearance.; 1: I certainly would not buy it; 2: I would possibly not buy it; 3: I might buy/not buy it; 4: I would possibly buy it; and 5: I would certainly buy it (Meilgaard et al. 2006). OI: Overall impression.
Figure 1 - Projection of the scores for the first two principal
components (92.70%) from sensory data.
the other genotypes and showed behavior similar to that already described.
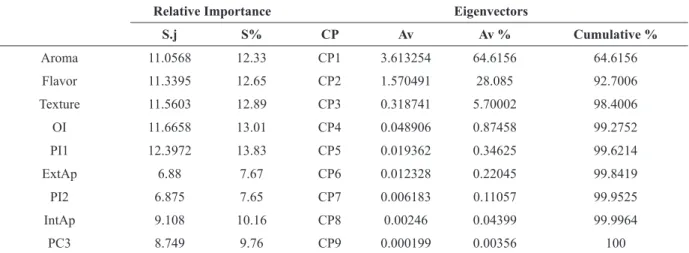
In addition to diversity estimates, the principal component technique provides information about
the variables that contributed most to difference
(Cruz et al. 2013). Among the variables evaluated, PI2 showed the highest load associated with the
last eigenvectors. In other words, it contributes
with 7.65% to diversity between hybrids (Table II).
Overall, this datum shows that evaluators consider that the external appearance of the fruit is similar for all hybrids. Such information is very important, since, in most cases, fruit selection on supermarket shelves depends solely on external appearance.
Table II presents the estimates of the eigenvalues associated with the principal components and the estimates related to the relative importance of the traits. PI1 (13.83%) showed the highest contribution to divergence followed closely by OI (13.01%). The lowest contributions were observed in PI2 (7.65%) and ExtAp (7.67%). However, Table II reveals that the sensory attributes contributed in a very controlled manner to the grouping of the hybrids. In such cases, the exclusion of any of these variables is not recommended in further analysis, since both contribute in a balanced way to estimate distances (Bilodeau and Duchesne 2002, Rossini et al. 2012, Cruz et al. 2013).
solids, the amount of sugars, among others (Oliveira and Godoy 2006). In this work, nine traits were measured in the hybrids, when they were ready for consumption, at the 5th ripening stage, to assess the quality of the commercial fruits of the new hybrids under assessment (Table II).
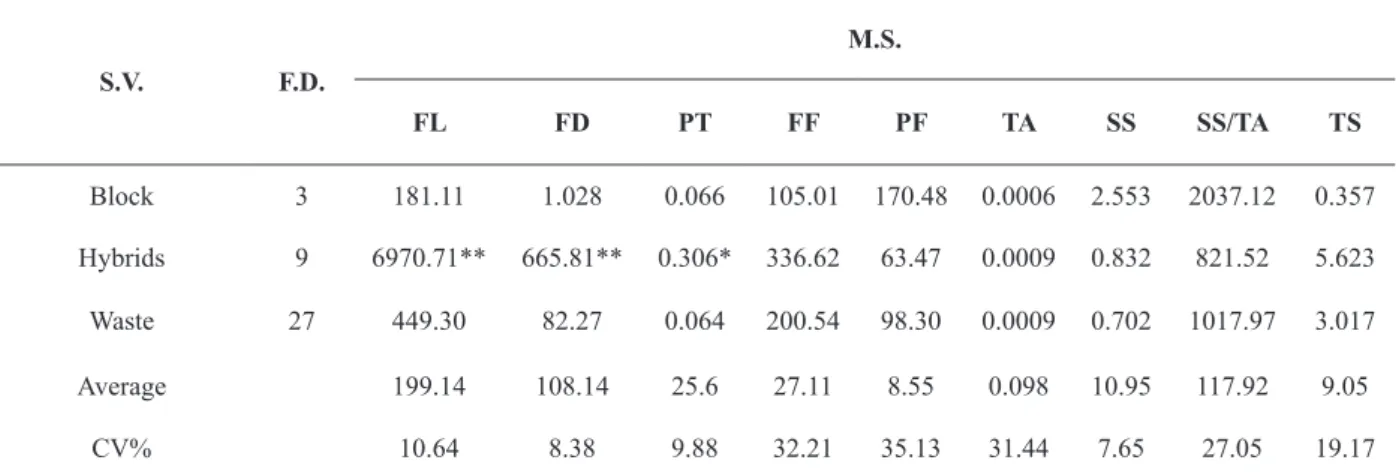
Table III shows the analysis of variance for the physical and biochemical traits evaluated. It can be immediately observed that only three traits showed significant differences among the hybrids: fruit length, fruit diameter and pulp thickness.
In papaya, in the case of hybrids as diverse
as those evaluated, differences between them are
almost certain, but it must be pointed out that the assessment was conducted at the sixth stage of
maturation (ready for consumption), which differs
very much from the period when papaya is usually assessed, between the stages of maturation zero and one.
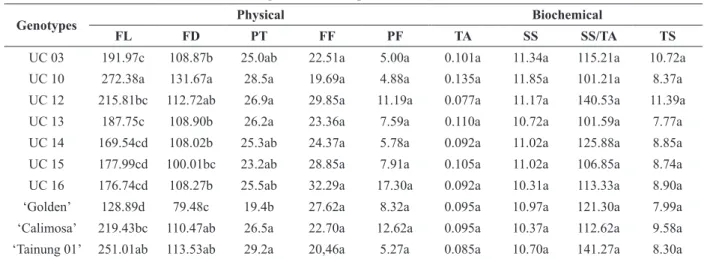
Table IV shows the averages for the physical and biochemical traits assessed. According to the analysis of variance shown in Table III, only FL, FD and PT presented statistical difference. The averages for FF, as described herein, which range between 12.70 and 32.29, and for PF, between 4.88
and 17.30, in this specific case, are not terms of
comparison for fruit firmness, since they only reflect
the condition of fruit ripening stage. Reference
values for fruit firmness in papaya are around 100
and 80 Newtons, for FF and PF, respectively (Pinto et al. 2013a, b). Pulp thickness, on the other hand, is an excellent indicator of the quality of fruits, since the greater the thickness, the more the content of fruit pulp. Table IV shows that the hybrids UC13, UC14, UC15 and UC16, from the ‘Solo’ group, are well superior to the control ‘Golden’, which is also true for the hybrids UC12 from the ‘Formosa’ group, compared to the hybrid ‘Tainung 01’.
Sensory attributes in fresh papaya fruits are not easily found in the literature. In Brazil, we found only three reports of the evaluation of papaya acceptance in the formulation of mixed fruit jams (Viana et al. 2012), the conservation
of the pulp taste by the effect of the hydrostatic
pressure application (Shinagawa et al. 2013) or the changes in parameters related to taste, such as the ratio between soluble solids and titratable acidity by irradiation used in some types of phytosanitary treatments (Camargo et al. 2007). Therefore, the lack of studies on papaya acceptance prevents a direct comparison of the results. Only the comparison of the controls is used. On the other
TABLE II
The relative importance of the traits (Sing method) and estimate of eigenvectors associated to the principal components.
Relative Importance Eigenvectors
S.j S% CP Av Av % Cumulative %
Aroma 11.0568 12.33 CP1 3.613254 64.6156 64.6156
Flavor 11.3395 12.65 CP2 1.570491 28.085 92.7006
Texture 11.5603 12.89 CP3 0.318741 5.70002 98.4006
OI 11.6658 13.01 CP4 0.048906 0.87458 99.2752
PI1 12.3972 13.83 CP5 0.019362 0.34625 99.6214
ExtAp 6.88 7.67 CP6 0.012328 0.22045 99.8419
PI2 6.875 7.65 CP7 0.006183 0.11057 99.9525
IntAp 9.108 10.16 CP8 0.00246 0.04399 99.9964
PC3 8.749 9.76 CP9 0.000199 0.00356 100
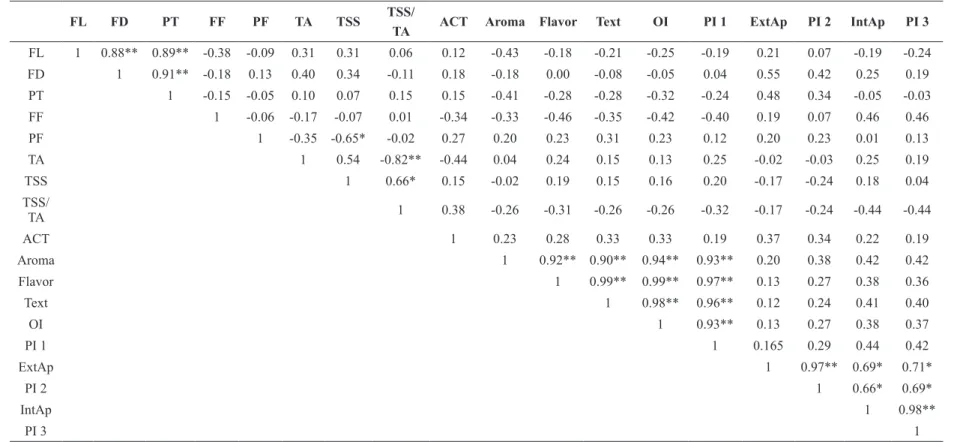
hand, a correlation analysis between the sensory, physical and biochemical variables assessed can help interpreting the results obtained (Fig. 2).
The correlation coefficient between the physical
variables FL, FD and TP, Fig. 2, shows statistical
significance, with high magnitude, ranging from
0.88 (FL x FD), 0.89 (FL x TP) to 0.91 (FD x PT). The correlations involving physical characters that refer to the qualitative aspects of the fruits are well known in papaya (Silva et al. 2007, Oliveira et al. 2010, 2012) and are consistent with those described herein for the variables investigated. Variations in length, diameter and thickness of fruit pulp are usually positively associated.
No significant correlation was observed between FL, FD and PT and the variables FF and PF, which corroborates that these traits do not change according to the type of fruit, either big or small. On the other hand, PF showed high negative correlation (-0.65) with SS. This correlation cannot be easily explained, although it is already known
that, in papaya, the loss of firmness due to advanced
ripening stage is caused by the decomposition of cell walls via the activity of some hydrolytic
enzymes such as cellulase and β-galactosidase
(Gallon et al. 2009, Pinto et al. 2013). This, in turn,
due to the decomposition of the cell walls, increases the sugar levels in the cell. Besides, according to Yao et al. (2012), it can explain the magnitude and direction of the correlation observed between PF and SS (-0.65). A similar result for this correlation (-0.81) was described by Oliveira et al. (2012), but the authors did not explain the origin of such correlation.
The content of SS and TA showed correlation only for the TSS/TA ratio with magnitude of 0.66 (SS x SS/TA) and -0.82 (TA x SS/TA), which is quite numerically logic. Correlations presenting similar magnitude and orientation were described by Oliveira et al. (2010) for SS x SS/TA (0.50) and for TA x SS/TA (-0.38).
The content of total sugars (TS), on the other hand, showed no relation even with SS. This may have occurred because the analyses were conducted in an advanced state of ripening, and the genotypes possibly had already reached the limit values for these traits. The data in Tables III and IV corroborate this assumption, since there is no significant difference between the hybrids evaluated for the aforementioned traits.
Otherwise, the biochemical variables (TA, SS, SS/TA, TS) were expected to present some
TABLE III
Analysis of variance of the fruit qualitative variables.
S.V. F.D.
M.S.
FL FD PT FF PF TA SS SS/TA TS
Block 3 181.11 1.028 0.066 105.01 170.48 0.0006 2.553 2037.12 0.357
Hybrids 9 6970.71** 665.81** 0.306* 336.62 63.47 0.0009 0.832 821.52 5.623
Waste 27 449.30 82.27 0.064 200.54 98.30 0.0009 0.702 1017.97 3.017
Average 199.14 108.14 25.6 27.11 8.55 0.098 10.95 117.92 9.05
CV% 10.64 8.38 9.88 32.21 35.13 31.44 7.65 27.05 19.17
FL: fruit length (mm).; FD: fruit diameter (mm).; PT: pulp thickness.; FF: fruit firmness (N).; PF: pulp firmness (N).; TA: titratable acidity (g ml-1
(2018)
90
(4)
LUCAS N. DA
LUZ et al.
FL FD PT FF PF TA TSS TSS/
TA ACT Aroma Flavor Text OI PI 1 ExtAp PI 2 IntAp PI 3
FL 1 0.88** 0.89** -0.38 -0.09 0.31 0.31 0.06 0.12 -0.43 -0.18 -0.21 -0.25 -0.19 0.21 0.07 -0.19 -0.24
FD 1 0.91** -0.18 0.13 0.40 0.34 -0.11 0.18 -0.18 0.00 -0.08 -0.05 0.04 0.55 0.42 0.25 0.19
PT 1 -0.15 -0.05 0.10 0.07 0.15 0.15 -0.41 -0.28 -0.28 -0.32 -0.24 0.48 0.34 -0.05 -0.03
FF 1 -0.06 -0.17 -0.07 0.01 -0.34 -0.33 -0.46 -0.35 -0.42 -0.40 0.19 0.07 0.46 0.46
PF 1 -0.35 -0.65* -0.02 0.27 0.20 0.23 0.31 0.23 0.12 0.20 0.23 0.01 0.13
TA 1 0.54 -0.82** -0.44 0.04 0.24 0.15 0.13 0.25 -0.02 -0.03 0.25 0.19
TSS 1 0.66* 0.15 -0.02 0.19 0.15 0.16 0.20 -0.17 -0.24 0.18 0.04
TSS/
TA 1 0.38 -0.26 -0.31 -0.26 -0.26 -0.32 -0.17 -0.24 -0.44 -0.44
ACT 1 0.23 0.28 0.33 0.33 0.19 0.37 0.34 0.22 0.19
Aroma 1 0.92** 0.90** 0.94** 0.93** 0.20 0.38 0.42 0.42
Flavor 1 0.99** 0.99** 0.97** 0.13 0.27 0.38 0.36
Text 1 0.98** 0.96** 0.12 0.24 0.41 0.40
OI 1 0.93** 0.13 0.27 0.38 0.37
PI 1 1 0.165 0.29 0.44 0.42
ExtAp 1 0.97** 0.69* 0.71*
PI 2 1 0.66* 0.69*
IntAp 1 0.98**
PI 3 1
Figure 2 - Pearson´s correlation coefficient among the sensory and qualitative variables of fruits. Text: Texture.; FL: fruit length (mm).; FD: fruit diameter (mm).; PT: pulp thickness (mm).; FF: fruit firmness (N).; PF: pulp firmness (N).; TA: titratable acidity (g ml-1
correlation with the sensory attributes, particularly SS/TA, which indicates fruit ripening. However, it did not occur (Table IV). The data presented do not lead to an immediate conclusion about the level of the relationship between the biochemical variables mentioned and the sensory attributes.
The main sensory attributes correlated to each other showed that aroma had positive and high magnitude correlation with flavor, texture and overall impression (0.92, 0.90 and 0.94),
respectively. Similar behavior was found for flavor,
with texture and overall impression (0.99 and 0.99), respectively; and between texture and overall impression (0.98). These correlations show that
the attributes flavor and aroma are closely linked
to the taster’s sensation of satisfaction, expressed in the overall appearance of the samples under analysis. It must be pointed out that no correlation was observed between flavor and total soluble solids and sugar content, as mentioned above. On the other hand, there was high correlation between
aroma and flavor (0.92) (Fig. 2).
In papaya, the aromatic compounds seem to play an important role in the perception of the sensory attributes of the fruit. More than
300 volatile compounds have been identified in papaya (Pino 2014), but with a wide range of compositions in the different cultivars (Franco et al. 1994). Among these compounds, the most
cited are linalool, with floral and sweet notes, and
oxide-linalool, with green and bitter notes. Almora et al. (2004) mentioned benzyl isocyanate with striking odor in cv. ‘Maradol’ papaya, with strong notes of green. This odor decreases sharply during fruit ripening, which induces the activity of other compounds, mainly butanol and 3-methylbutanol at full ripe stages of the fruit. According to Wijaya and Chen (2013), papaya flavor results from a complex interaction between sugars, organic acids and volatile compounds, which may vary according to the cultivars studied and the season when evaluation is performed. The mentioned authors believe that the volatile compounds present in the hybrids assessed are important for the sensory perception of taste, although the present work did not use any methodology to corroborate it. Franco et al. (1994) associated the presence of linalool in varieties of papaya from the ‘Solo’ group to the taste of nectar (sweet), and to notes of
green, associated with the bitter flavor in varieties
TABLE IV
Averages of the fruit qualitative variables.
Genotypes Physical Biochemical
FL FD PT FF PF TA SS SS/TA TS
UC 03 191.97c 108.87b 25.0ab 22.51a 5.00a 0.101a 11.34a 115.21a 10.72a
UC 10 272.38a 131.67a 28.5a 19.69a 4.88a 0.135a 11.85a 101.21a 8.37a
UC 12 215.81bc 112.72ab 26.9a 29.85a 11.19a 0.077a 11.17a 140.53a 11.39a
UC 13 187.75c 108.90b 26.2a 23.36a 7.59a 0.110a 10.72a 101.59a 7.77a
UC 14 169.54cd 108.02b 25.3ab 24.37a 5.78a 0.092a 11.02a 125.88a 8.85a UC 15 177.99cd 100.01bc 23.2ab 28.85a 7.91a 0.105a 11.02a 106.85a 8.74a UC 16 176.74cd 108.27b 25.5ab 32.29a 17.30a 0.092a 10.31a 113.33a 8.90a
‘Golden’ 128.89d 79.48c 19.4b 27.62a 8.32a 0.095a 10.97a 121.30a 7.99a
‘Calimosa’ 219.43bc 110.47ab 26.5a 22.70a 12.62a 0.095a 10.37a 112.62a 9.58a ‘Tainung 01’ 251.01ab 113.53ab 29.2a 20,46a 5.27a 0.085a 10.70a 141.27a 8.30a FL: fruit length (mm).; FD: fruit diameter (mm).; PT: pulp thickness (mm).; FF: fruit firmness (N).; PF: pulp firmness (N).; TA: titratable acidity (g ml-1).; SS: soluble solids (ºBrix).; SS/TA: ratio between total soluble solids and titratable acidity.; TS: total sugars (g ml-1
from the ‘Formosa’ group. In Table I, the highest average for aroma occurred exactly in a cultivar from the ‘Solo’ group, UC16 (7.0), and the lowest, in a cultivar from the ‘Formosa’ group, ‘Tainung 01’ (5.24).
Purchase intentions PI1, PI2 and PI3 were highly correlated to OI, ExtAp and IntAp (0.93,
0.97 and 0.98), respectively. These figures indicate that purchase intent is largely driven by the first
impression consumers have of the fruit and in this case, a healthy and beautiful fruit. If consumers had the chance to taste the fruit before purchase, they would surely have a favorable attitude towards taste, given the positive correlation and high
magnitude between flavor and PI1 (0.93).
REFERENCES
ALMORA K, PINO JA, HERNADÉZ M, DUARTE C, GONZÁLEZ J AND RONCAL E. 2004. Evaluation of colatiles from ripening papaya (Carica papaya L., var. Maradol roja). Food Chem 86: 127-130.
AOAC - ASSOCIATION OF OFFICIAL ANALYTICAL CHEMISTS. 1997. Official methods of analysis. 16th
ed., Washington, 105 p.
BERILLI SS, ALMEIDA SA, CARVALHO AJC, FREITAS SJ, BERILLI ACG AND SANTOS PC. 2011. Avaliação sensorial dos frutos de cultivares de abacaxi para consumo in natura. Rev Bras Frutic (Especial): 592-598.
BILODEAU M AND DUCHESNE P. 2002. Principal component analysis from the multivariate familial correlation matrix. J Multivar Anal 82: 457-470.
CAMARGO RJ, TADINI CC AND SABATO SF. 2007. Physical-chemical analyses of irradiated papayas (Carica papaya L.). Radiat Phys Chem 76: 1866-1868.
CRUZ CD. 2013. GENES - a software package for analysis in experimental statistics and quantitative genetics. Acta Sci Agro 35: 271-276.
CRUZ CD, REGAZZI AJ AND CARNEIRO PCS. 2013. Diversidade genética. In: Modelos biométricos aplicados ao melhoramento de plantas (Eds), 4ª ed., Viçosa: Editora UFV, p. 392-429.
FAO. 2013. Food and agriculture organization of the United Nations for a world without hunger. Area harvest, yield and production in 2011/ FAOSTAT/FAO Statistics Division. URL <http://faostat.fao.org/site/567/DesktopDefault. aspx?PageID=567#ancor>.
FRANCO MRB, RODRIGUEZ-AMAYA DR, DAMÁSIO MH AND LANOS-CARRILLO JL. 1994. Componentes
voláteis e sabor em mamão: uma reavaliação. Aliment Nutri 5: 99-107.
GALLON CZ, BROETTO SG AND SILVA DM. 2009. Atividade da celulase e β-galactosidaseno estudo da firmeza da polpa de mamões ‘Golden’ e ‘Grangolden’. Rev Bras Frutic 31: 1178-1183.
MACFIES HJH AND BRATCHELL N. 1989. Designs to balance the effect of order of presentation and first-order carry-over effects in hall tests. J Sens Stud 4: 129-148. MASCARENHAS RJ, GUERRA NB, AQUINO JS AND
LEÃO PCS. 2013. Qualidade sensorial e físico-química de uvas finas de mesa cultivadas no submédio São Francisco. Rev Bras Frutic 35: 546-554.
MATSUURA FCAU, CARDOSO RL AND RIBEIRO DE. 2002. Qualidade sensorial de frutos de híbridos de bananeira, cultivar pacovan. Rev Bras Frutic 24: 263-266. MEILGAARD M, CIVILLE GV AND CARR BT. 2006.
Sensory evaluation techniques. 4th
ed., Boca Raton, CRC Press, 448 p.
MIGUEL ACA, ALBERTINI S, BEGIATO GF, DIAS JRPS AND SPOTO MHF. 2010. Perfil sensorial de melão amarelo minimamente processado submetido a tratamentos químicos. Ciênc Tecnol Aliment 30: 589-598.
MONIDINI L. 2010. Frutas, legumes e verduras (FLV): uma comunicação sobre os níveis de consumo da população adulta urbana brasileira. Info Econ 40: 36-41.
NEVES MVM AND LIMA VLAG. 2010. Avaliação sensorial e caracterização físicoquímica de néctar de acerola adicionado de extrato comercial de própolis. Alim Nutr 21: 399-405.
OLIVEIRA EJ, FRAIFE FILHO GA, FREITAS JPX DE, DANTAS JLD AND RESENDE MDV. 2012. Plant selection in F2 segregating populations of papaya from comercial hybrids. Crop Breed Appl Biotech 12: 191-198. OLIVEIRA EJ AND GODOY IJ. 2006. Pod yield stability
analysis of runner peanut lines using AMMI. Crop Breed Appl Biotech 6: 311-317.
OLIVEIRA EJ, LIMA DZ, LUCENA RS, MOTTA TNM AND DANTAS JLL. 2010 Correlações genéticas e análise de trilha para número de frutos comerciais por planta em mamoeiro. Pesqui Agropec Bras 45: 855-862.
OLIVEIRA ENA, ROCHA APT, GOMES JP, SANTOS DC AND ARAÚJO GT. 2013. Perfil sensorial de geleias tradicionais de umbu-cajá. Biosci J 29: 1566-1575. PADILHA VM, ROLIM PM, SALGADO SM, LIVEIRA
AS, ANDRADE SAC AND GUERRA NB. 2010. Perfil sensorial de bolos de chocolate formulados com farinha de yacon (Smallanthus sonchifolius). Ciênc Tecnol Aliment 30: 735-740.
PERYAM DR AND GIRARDOT N. 1952. Advanced taste test method. Food Engin 24: 58-61.
PINTO FO, LUZ LN, PEREIRA MG, CARDOSO DL AND RAMOS HCC. 2013a. Metodologia dos modelos mistos para seleção combinada em progênies segregantes de mamoeiro. Rev Bras Cienc Agra 8: 211-217.
PINTO FO, RAMOS HCC, CARDOSO DL, LUZ LN AND PEREIRA MG. 2013b. Desenvolvimento de genótipos de mamoeiro tolerantes à mancha fisiológica. Rev Bras Frutic 35: 1101-1115.
PINTO LKA, MARTINS MLL, RESENDE ED, THIÉBAUT JTL AND MARTINS MA. 2013. Avaliação da atividade das enzimas pectina metilesterase e β-galactosidase em mamões cv. Golden armazenados sob diferentes concentrações de oxigênio. Rev Bras Frutic 35: 15-22. RESENDE JTV, CAMARGO LKP, ARGANDOÑA EJS AND
CAMARGO CK. 2008. Sensory analysis and chemical characterization of strawberry fruits. Hortic Bras 26: 371-374.
ROSSINI K, ANZANELLO MJ AND FOGLIATTO FS. 2012. Seleção de atributos em avaliações sensoriais descritivas. Produção 22: 380-390.
SANTANA LRR, MATSUURA FCAU AND CARDOSO RL. 2004. Genótipos melhorados de mamão (Carica papaya
L.): avaliação sensorial e físico-química dos frutos. Ciênc Tecnol Aliment 24: 217-222.
SHIGEMATSU E, MACHADO FMVF, PASINATO DA AND LIMA VBD. 2012. Análise sensorial de barra de cereais adicionada de sementes de mamão (Carica papaya L). Rev Alimentus 2: 20-35.
SHINAGAWA FB, DELIZA R, ROSENTHAL A AND ZARUR MA. 2013. Pressão hidrostática nos atributos sensoriais de néctar de mamão. Ciênc Rural 43:1898-1904. SILVA FF, PEREIRA MG, RAMOS HCC, DAMASCENO
JUNIOR PC, PEREIRA TNS AND IDE CD. 2007. Genotypic correlation of morpho-agronomic traits in papaya and implications for genetic breeding. Crop Breed Appl Biotechnol 7: 345-352.
SILVEIRA J, GALESKAS H, TAPETI R AND LOURENCINI I. 2011. Quem é o consumidor Brasileiro de frutas e hortaliças. Hortifuti Brasil 103: 8-22.
VIANA ES, JESUS JL, REIS RC, FONSECA MD AND SACRAMENTO CK. 2012. Caracterização físico-química e sensorial de geleia de mamão com araçá-boi. Rev Bras Frutic 34: 1154-1164.
WALL MM. 2006. Ascorbic acid, vitamin A, and mineral composition of banana (Musa sp.) and papaya (Carica papaya) cultivars grown in Hawaii. J Food Comp Anal 19: 434-445.
WIJAYA CH AND CHEN F. 2013. Flavour of papaya (Carica papaya L.) fruit. Biotropia 20: 50-71.