Avaliação de top crosses de milho em duas doses de nitrogênio
Fernando Lisboa Guedes1, João Cândido de Souza2, Emiliano Fernandes Nassau Costa3,
Matheus Costa dos Reis4, Gustavo Andrade Cardoso5, Hugo Junqueira Ematné5
ABSTRACT
Maize crops in Brazil have a wide diversity of management systems. There is a large contingent of family agriculture, which uses little or no agricultural inputs, compared to the rural enterprise which uses the most modern production systems. This difference in the management systems is particularly noticeable in relation to consumption of fertilizers, especially nitrogenous ones. Therefore it is necessary to obtain plants with efficient nitrogen (N) use that also respond to applied nitrogen. Thus, the aim of the study was to evaluate the performance of S0:1 progenies, in top crosses, under two nitrogen levels and select the best ones based on responsiveness and efficiency. Sixty seven S0:1 progenies from populations of single cross hybrids were crossed with two testers (T1 – single cross hybrid; T2 – population per se). A hundred and thirty four hybrid progenies plus ten controls were
evaluated in two field trials with different levels of nitrogen (one with average levels - 50 kg ha-1 of N - and the other with low levels
of nitrogen - 25 kg ha-1 of N) in a 12 x 12 triple lattice design. It is possible to identify and to select progenies from commercial
single cross hybrids that are efficient and responsive to nitrogen application. The non-additive effect was as important as the additive effect for grain yield under different nitrogen levels.
Index terms: Genetic breeding, Zea mays, S0:1 progenies, tester, abiotic stress.
RESUMO
A cultura do milho no Brasil tem uma ampla diversidade no sistema de manejo. Há um grande contingente de agricultura tipicamente familiar que usa pouco insumo agrícola, e também empresas rurais que utilizam o que há de mais moderno em sistema de produção. Essa diferença no sistema de manejo fica bem evidenciada no que refere ao consumo de fertilizantes, especialmente os nitrogenados.Por isso, é necessário obter plantas eficientes no uso de nitrogênio (N) e, ao mesmo tempo, que sejam responsivas ao N aplicado. Desse modo, neste trabalho, objetivou-se avaliar a resposta, a diferentes níveis de N, de progênies S0:1 de milho e sua capacidade de combinação, utilizando dois testadores diferentes. Foram utilizadas 67 progênies S0:1, oriundas de híbridos comerciais, em topcross com dois testadores (T1 - híbrido simples; T2 – população per ser das progênies S0:1). Os top crosses foram avaliados,
juntamente com 10 testemunhas, em dois experimentos com diferentes níveis de nitrogênio (nível médio – 50 kg ha-1 de N – e outro
com nível baixo – 25 kg ha-1 de N), no delineamento experimental látice triplo 12 x 12. Os resultados obtidos permitiram verificar
que não ocorreu alteração no comportamento dos top crosses em diferentes doses de nitrogênio, para produtividade de grãos. É
possível identificar e selecionar progênies parcialmente endogâmicas responsivas e eficientes na utilização de N, provenientes de híbridos comerciais. Os efeitos não-aditivos foram tão importantes quanto os efeitos aditivos para produtividade de grão sob diferentes níveis de nitrogênios.
Termos para indexação: Melhoramento genético, Zea mays, progênies S0:1, testadores, estresse abiótico.
(Received in may 12, 2011 and approved in july 6, 2011)
1Universidade Federal de Lavras/UFLA – Departamento de Biologia/DBI – Cx. P. 37 – 37200-000 – Lavras – MG – Brasil – [email protected] 2Universidade Federal de Lavras/UFLA – Departamento de Biologia/DBI – Lavras – MG – Brasil
3Empresa Brasileira de Pesquisa Agropecuária/Embrapa – Tabuleiros Costeiros – Aracaju – SE – Brasil 4Pioneer Sementes – Santa Cruz do Sul – RS – Brasil
5Universidade Federal de Lavras/UFLA – Lavras – MG – Brasil INTRODUCTION
Maize crops in Brazil have a wide diversity of management systems. There is a large contingent of family agriculture, which uses little or no agricultural inputs, compared to the rural enterprise which uses the most modern production systems. This difference in the management systems is particularly noticeable in relation to consumption of fertilizers, especially nitrogenous ones.
Variability for nitrogen use efficiency (NUE) and for responsiveness to N has been detected (MANSKE et al, 2001, O’NEILL et al. 2004). There are reports of recurrent selection in maize with an aim to increase the efficiency of nitrogen use (SANTOS et al. 2003).
An important point in a breeding program for NUE, is the kind of population and progenies that should be used. With use of inbred lines the expected gain will be greater, however there are some restrictions in the trials; due to the poor adaptation of this type of progenies, field trials usually have lower precision. Exploring the use of half-sib or full-sib progenies provides smaller additive variance than inbred lines, but the field trial precision is higher. Another option is to assess the partially endogamic progenies in top crosses. In this case, at the same time as identifying variability among partially endogamic progenies, it is possible to get information about combined ability, which has fundamental importance for hybrids programs. Thus, the objective of this work was to evaluate the differential response of S0:1 maize progenies and their combined ability, using two different testers, under two nitrogen levels.
MATERIAL AND METHODS
The field trial was conducted at the Experimental Farm of Universidade Federal de Lavras (UFLA), in Lavras, southern Minas Gerais, Brazil. The site is located at an elevation of 932 meters and the geographic coordinates 21º 12' South and 44º 58' West.
67 S0:1 progenies, from commercial hybrids were crossed with two testers in top crosses (T1 - commercial single cross hybrid with good yield potential and T2 -equal mixture of S0:1 progenies, equivalent to the population
per se). The major chemical characteristics of the field were
determined (Table 1).
Trials for evaluation of N are usually installed in areas previously prepared for that purpose. Therefore, there were successive crops of maize, without inputs, to remove this nutrient. The 134 top crossed hybrids and ten controls (a single cross hybrid, a double cross hybrid, two triple cross hybrid and six hybrids of partially endogamic progenies S0:1) were evaluated in two trials (one in an environment with average availability of nitrogen -‘Average N’, and another in an environment with ‘Low N’itrogen availability - ‘Low N’), in the agricultural year 2008/2009. The two trials were conducted in adjacent fields. A 12 x 12 triple lattice design was used. The plots consisted of two rows of three meters long, with 0.8 m spacing between rows and 0.20 m between plants, with a density of 62,500 plants per hectare.
At sowing, the both trials received 350 kg ha-1,
formulated 0-20-20, N, P2O5 and K2O, respectively. Nitrogen fertilization was performed using two levels of nitrogen (average and low), ammonium sulphate being used as a nitrogen source. In the trial with application of the average level of nitrogen (‘Average N’) 250 kg ha-1 ammonium sulfate
was used, that corresponds to 50 kg ha-1 of N, in side
dressing at the stage of plant development v4 (FANCELLI et al., 2001), and in experiment with application of ‘Low N’itrogen (‘Low N’) half of ammonium sulfate, corresponding to 125 kg ha-1, that correspond to 25 kg ha-1 of N was applied.
The traits that were evaluated were: male flowering (MF), corresponding to the number of days from sowing to 50% of plants in the plot with tassels releasing pollen; female flowering (FF), corresponding to the number of days from sowing to silking of 50% of the plants in the plot; prolificacy (PROL): ‘Average N’umber of ears per plant per plot, obtained by dividing the total number of ears by the stand of the plot; grain yield (GY): grain weight plot, obtained in kg plot-1, corrected for 13% moisture content
and for stand, according Schmildt (2001). This was subsequently converted to kg ha-1 using as useful plot
size 6.0 m x 0.80 m, which corresponds to 4.8 m2.
After checking the data, analyses of variance were performed for each individual environment, and results Table 1 – Chemical analysis of soil samples to a depth of 0 to 20 cm in the field trial1/.
1/ Analyses performed in the laboratories of the Department of
Soil Science (DCS), according to the methodology of the Empresa Brasileira de Pesquisa Agropecuária (EMBRAPA, 1997) and interpretation according to Alvarez et al. (1999). Mab average acidity, MBa very low level, Ba low level, M -average level, Bo - good level, MBO - very good level. 2/ SB
-sum of bases, t - effective CTC, m - Al saturation, T - CTC at pH 7.0, V - saturation for bases.
Component 2/ Trials
‘Average N’ ‘Low N’
pH H2O 5.3 cM 5.4 cM
P (mg dm-3) 5.6 M 6.0 M
K (mg dm-3) 47.3 M 43.3 M
Ca2+ (cmolc dm-3) 1.76 M 1.76 M
Mg2+ (cmolc dm-3) 0.4 Ba 0.4 Ba
Al3+ (cmolc dm-3) 0.26 Ba 0.3 Ba
SB (cmolc dm-3) 2.3 M 2.3 M
V (%) 29.0 Ba 33.1 Ba
m (%) 10.6 MBa 11.6 MBa
were subsequently analyzed by the two environments (Average and ‘Low N’). The data were analyzed statiscally by analysis of variance, and the statistical procedure described by Griffing (1956) modified by Geraldi and Miranda Filho (1988) was used to estimate general and specific combining ability.
The N use efficiency of the progenies in top crosses was estimated by the response index to nitrogen application, that is, mass of grain produced per kg of N applied, using the average data of grain yield (kg ha-1) of
top cross hybrids in both environments.
Spearman correlation between the two testers was estimated using the average yield of top cross hybrids. Different intensities of selection was simulated in both environments. The coincidence that the progeny would be selected in both environments was estimated using a procedure similar to that presented by Hamblin and Zimmermann (1986).
RESULTS AND DISCUSSION
In the evaluation of the two levels of fertilization the following was considered: the recommended under-average input of N, creating the environment called ‘Average N’, and the use of half that level for the ‘Low N’ environment. Usually, about 20 to 30 kg of nitrogen per
hectare are released for every 1% of organic matter (OM) during the soil mineralization. On average, trial ‘Average N’ was 9.2% more productive than ‘Low N’ and the source of variation levels (N) were highly significant for the trait GY (Table 2).
The difference in grain yield between the two environments was 618 kg ha-1, whereas the difference in
dosage of N applied was 25 kg ha-1, the average response
yield was 24 kg ha-1 of grain per kg of N applied. These
results resemble that of Fidelis et al. (2007), who found an average response of 17 kg of grain per kg of N applied in environments with average and intense nitrogen stress, when hybrids and open pollinated varieties, ancient and local populations were tested. On the other hand, Bolaños and Edmeades (1996) did not find variations in the levels of N in environments with ‘Low N’, ‘Average N’ and ‘Optimum N’. Monneveux et al. (2005) found an average reduction of 65,3% in grain yield in open pollinated varieties and 67.4% for hybrids in soils with ‘Low N’. According Bolaños and Edmeades (1996) in the characterization of stress, the yield obtained in abiotic stress should be among 20% and 30% smaller than that achieved by the same genetic pool in an environment without abiotic stress, considering trials from the same year and place.
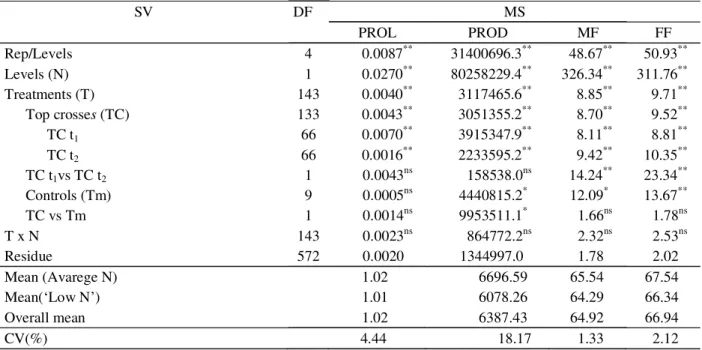
Table 2 – Mean squares and significance, coefficients of variation (CV%) and overall mean of analysis of variance for traits prolificacy (PROL), grain yield (kg.ha-1) (GY), number of days to male flowering (MF), number of days to female
flowering (FF).
SV DF MS
PROL PROD MF FF
Rep/Levels 4 0.0087** 31400696.3** 48.67** 50.93**
Levels (N) 1 0.0270** 80258229.4** 326.34** 311.76**
Treatments (T) 143 0.0040** 3117465.6** 8.85** 9.71**
Top crosses (TC) 133 0.0043** 3051355.2** 8.70** 9.52**
TC t1 66 0.0070** 3915347.9** 8.11** 8.81**
TC t2 66 0.0016** 2233595.2** 9.42** 10.35**
TC t1vs TC t2 1 0.0043ns 158538.0ns 14.24** 23.34**
Controls (Tm) 9 0.0005ns 4440815.2* 12.09* 13.67**
TC vs Tm 1 0.0014ns 9953511.1* 1.66ns 1.78ns
T x N 143 0.0023ns 864772.2ns 2.32ns 2.53ns
Residue 572 0.0020 1344997.0 1.78 2.02
Mean (Avarege N) 1.02 6696.59 65.54 67.54
Mean(‘Low N’) 1.01 6078.26 64.29 66.34
Overall mean 1.02 6387.43 64.92 66.94
CV(%) 4.44 18.17 1.33 2.12
The source of variation treatments revealed a significant F (P<0.01) for all traits. This was displayed into top crosses, controls and their contrasts. For both sources of variation top crosses and controls, the F test was significant, indicating the existence of genetic variability among the treatments, except for the trait PROL in the controls.
The contrast among testers was highly significant (P <0.01) for both male (MF) and female (FF) flowering. The top crosses evaluated in the environment ‘Average N’ were on average 1.25 days delayed for both male and female flowering, compared with ‘Low N’. On the other hand, the testers did not differ, on average, for the traits PROL and PROD.
The contrast “top crosses (TC) vs controls (Tm)” was significant (P>0.05) for GY (Table 2), indicating that, on average, the top crosses differed from controls for this trait. For all traits, there was no interaction between “treatment (T) x levels (N)” (P>0.05), indicating that the treatments had similar performances at the levels that were evaluated (Table 2).
On the diallel analysis significant differences (P 0.01) for the sources of variation levels (N) and top crosses (TC) were observed for all traits (Table 3). This confirms that there were differences between the
levels of nitrogen applied and that there is variability among the top crosses evaluated.
The effects of general combined abilities of the testers GCA (Test) and the progenies CGA (Prog) as well the specific combining ability (SCA) were significant for GY (P < 0.01), showing that additive genetic effects, sets of favorable alleles donated by progenies, non-additive genetic effects and genic complementation obtained from specific crossings were important (Table 3). For FF and MF only GCA (Prog) and GCA (Test) were significant (P < 0.01), showing predominance of additive genetic effects.
Regarding combined abilities, the interaction between “top crosses (TC) x levels (N)” was significant for PROL, MF, and FF (Table 3). Both the source of variation “GCA (Test) x N” as “SCA x N” were significant for PROL. So, alleles donated by the testers, in a determined level of N, cannot to contribute in the same way in another level of N. Furthermore, the effects of genic complementation showed differences in the expression of heterosis of the top crosses at different levels of N. For the traits MF and FF only ‘SCA x N’ was significant (P <0.01) (Table 3), there was difference in the expression of heterosis in different levels of N due to the effects of genic complementation.
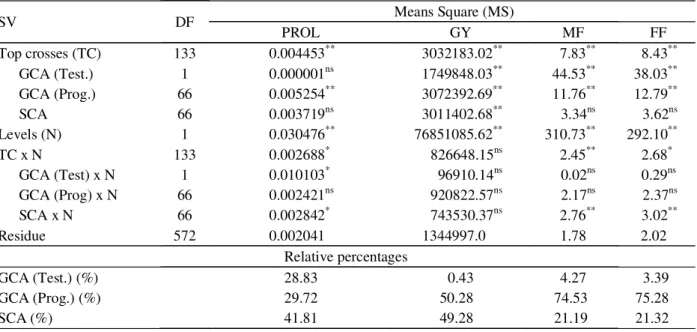
Table 3 – Mean squares, significance, relative percentages of the general (GCA%) and specific (SCA%) combination in relation to diallel analysis for the traits prolificacy (PROL), grain yield (kg ha-1) (GY) number of days to male
flowering (MF), number of days to female flowering (FF).
SV DF Means Square (MS)
PROL GY MF FF
Top crosses (TC) 133 0.004453** 3032183.02** 7.83** 8.43**
GCA (Test.) 1 0.000001ns 1749848.03** 44.53** 38.03**
GCA (Prog.) 66 0.005254** 3072392.69** 11.76** 12.79**
SCA 66 0.003719ns 3011402.68** 3.34ns 3.62ns
Levels (N) 1 0.030476** 76851085.62** 310.73** 292.10**
TC x N 133 0.002688* 826648.15ns 2.45** 2.68*
GCA (Test) x N 1 0.010103* 96910.14ns 0.02ns 0.29ns
GCA (Prog) x N 66 0.002421ns 920822.57ns 2.17ns 2.37ns
SCA x N 66 0.002842* 743530.37ns 2.76** 3.02**
Residue 572 0.002041 1344997.0 1.78 2.02
Relative percentages
GCA (Test.) (%) 28.83 0.43 4.27 3.39
GCA (Prog.) (%) 29.72 50.28 74.53 75.28
SCA (%) 41.81 49.28 21.19 21.32
ns, **, * not significant, significant at 1% and 5%, respectively, by F test.
There was no interaction between top crosses and levels for GY (Table 3). This suggests that the difference of N availability did not cause changes on top cross ranking. Different results were found by Medici et al. (2005), who reported the existence of the interaction “genotype x levels of N” to the grain yield of maize. The same authors showed that, for environments with high N availability, additive genetic effects showed slightly more important than non-additive genetic effects, and for environments with low availability of N, the addictive genetic effects and non-additive effects showed similar importance.
Regarding the relative percentages of the general and specific combined abilities among the traits, only in GY was the contribution of non-additive effect as important as the additive effects: the SCA contributed 49.28% of the variation top crosses and GCA contributed 50.71%, and the GCA (Test) contributed 0.43% and GCA (Prog) contributed 50.28%. For the other traits (PROL, MF and FF) there was higher contribution of additive effects in relation to non-additive effects, showing that additive genetic effects are more important under conditions of average and low availability of N. For MF and FF the GCA (Prog.) expressed higher contribution and for PROL both GCA (Test.) as GCA (Prog.) have similar magnitudes (Table 3).
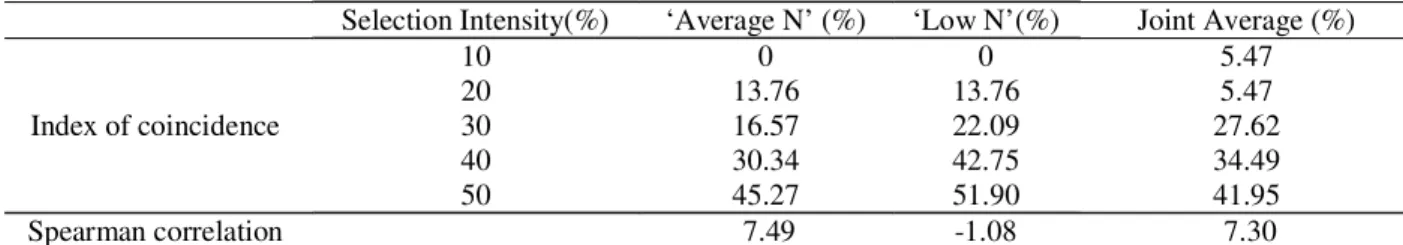
The correlation values for GY between the two testers ranged in different levels of N (Table 4). In the environment ‘Average N’ and in the joint average, the correlations were of small magnitude, however, with a positive sign, showing a trend that the best top crosses with tester 1 showed similar behavior with tester 2. In
the ‘Low N’ environment, the correlations were of small magnitude and negative effect, indicating that the behavior of top crosses between the two testers was inconsistent. This fact implies that the choice of tester for early selection is very difficult. In this aspect, the breeder needs to be attentive in the select of testers in accordance with the objectives of the breeding hybrids program.
An important question that needs to be answered is the percentage of coincidence of top crosses in different levels of N, considering the different intensities of selection. For a logical analysis, the intensity of 10% was even in top crosses between the testers in the ‘Average N’ and ‘Low N’, there was only 5.47% coincidence in the joint analysis (Table 4). From the intensity of 20%, the percentage of coincidence moved towards lower selection intensity. Therefore, whether to use an elite line or a single cross hybrid as a tester should be determined, to obtain single cross hybrids or triple cross hybrids, respectively. In this case, it is interesting to use more than one tester that can perform a selection with more reliability.
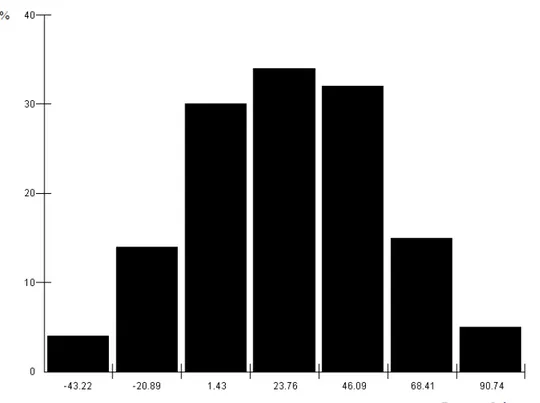
Distribution of frequencies of the response index to nitrogen (Figure 1), showed a similarity to normal distribution. It was observed that 13.42% of top crosses showed a negative response to the increase of N, there was no responsiveness of these genotypes in the trial ‘Average N’ in relation to ‘Low N’. On the other hand, 86.58% of top crosses showed a positive response to increasing N, and 14.92% of those obtained a yield higher 68 kg of grain for each kg of N applied, showing to be possible to select genotypes responsive to application of nitrogen.
Table 4 – Percentage of coincidence with different selection intensities (I) and Spearman correlation of selected the top crosses among the two testers for yield.
Selection Intensity(%) ‘Average N’ (%) ‘Low N’(%) Joint Average (%)
10 0 0 5.47
20 13.76 13.76 5.47
Index of coincidence 30 16.57 22.09 27.62
40 30.34 42.75 34.49
50 45.27 51.90 41.95
CONCLUSION
It is possible to identify and to select progenies from commercial single cross hybrids, that are efficient and responsive to nitrogen application. The non-additive effect was as important as the additive effects for grain yield under different nitrogen levels.
ACKNOWLEDGEMENTS
To Conselho Nacional de Desenvolvimento Científico e Tecnológico (CNPq) and Coordenação e Pessoal de Nível Superior (CAPES) for financial support.
REFERENCES
ALVAREZ, V. V. H. et al. Interpretação dos resultados das análises de solos. In: RIBEIRO, A. C.; GUIMARÃES, P. T. G.; ALVAREZ V. V. H. Recomendações para uso de corretivos e fertilizantes em Minas Gerais: 5ª aproximação. Viçosa: CFSEMG, 1999. p. 25-32.
BOLAÑOS, J.; EDMEADES, G. O. The importance of the anthesis-silking interval in breeding for drought tolerance in tropical maize. Field Crops Research, Amsterdam, v.48, n.1, p.65-80, jan./mar. 1996.
DANGL, J. L.; DIETRICH, R. A.; THOMAS, H. Senescence and programmed cell death. In: BUCHANAN, B.B.; GRUISSEM, W.; JONES, R. L. Biochemistry & Molecular Biology of Plants. Rockville: ASPB, 2000. p.1044-1100.
EMPRESA BRASILEIRA DE PESQUISA
AGROPECUÁRIA. Manual de métodos de análise de solo. Rio de Janeiro: EMBRAPA/CNPS, 1997. 212 p.
FANCELLI, A. L.; DOURADO NETO, D. Milho: fisiologia da produção e produtividade. In: FANCELLI, A. L.; DOURADO NETO, D. Milho: tecnologia e produtividade. Piracicaba: ESALQ/LPV, 2001. p.25-47.
FIDELIS, R. R. et al. Fontes de germoplasma de milho para estresse de baixo nitrogênio. Pesquisa Agropecuária Tropical, Goiânia, v.37, n.3, p.147-153, jul./set. 2007.
GERALDI, I. O.; MIRANDA-FILHO, J. B. Adapted models for the analysis of combining ability of varieties in partial diallel crosses. Revista Brasileira de
GERNER, H.; HARRIS, G. The use and supply of fertilizers in sub-Saharan Africa. In: VAN, R. H.; PRINS, W. H. The Role of Plant Nutrients for Sustainable Crop Production in Sub-Saharan Africa. Leidschendam: Vereniging van Kunstmest Producenten, 1993. p.107-126. GRIFFING, B. A. Concept of general and specific
combining ability in relation to diallel crossing systems. Australian Journal of Biological Sciences, Melbourne, v.9, n.6, p.463-493, jun. 1956.
HAMBLIN, J.; ZIMMERMANN, M. J. O. Breeding common bean for yield in mixtures. Plant Breeding Reviews, Connecticut, v.4, n.1, p.45-72, jan./dec. 1986.
MANSKE, G. G. B; ORTIZ-MONASTERIO, J. I. D.; VLEK, P. L. G. Techniques for measuring genetic diversity in Roots. In: REYNOLDS, M. P.; ORTIZ-MONASTERIO, J. I.; MCNAB, A. Application of Physiology in Wheat Breeding. México: CIMMYT, 2001. 240 p.
MEDICI, L. O. et al. Identification of maize lines with contrasting responses to applied nitrogen. Journal of
Plant Nutrition, New York, v.28, n.5, p.903-915, may. 2005.
MONNEVEUX, P.; ZAIDI, P. H.; SANCHES, C. Population density and Low Nitrogen affects yield: associated traits in tropical maize. Crop Science , Madison, v.45, n.1, p.535-545, jan./feb. 2005.
O’NEILL, P. M.; SHANAHAN, J. F.; SCHEPERS, J. S.; CALDWELL, B. Agronomic responses of maize hybrids from different eras to deficit and adequate levels of water and nitrogen. Agronomy Journal, Madison, v.96, n.6, p.1660-1667, nov./dec. 2004.
SANTOS, M. X. et al. Quinto ciclo de seleção recorrente na população de milho Sintético Elite NT em solos com baixo nível de nitrogênio. Revista Científica Rural, Bagé, v.8, n.1, p.79-84, jun. 2003.