Gene expression analysis reveals important pathways for drought response
in leaves and roots of a wheat cultivar adapted to rainfed cropping in the
Cerrado Biome
Liane Balvedi Poersch-Bortolon
1, Jorge Fernando Pereira
2, Antonio Nhani Junior
2,
Hebert Hernán Soto Gonzáles
2,3, Gisele Abigail Montan Torres
2, Luciano Consoli
2,
Rafael Augusto Arenhart
1, Maria Helena Bodanese-Zanettini
1and Márcia Margis-Pinheiro
1 1Departamento de Genética, Instituto de Biociências, Universidade Federal do Rio Grande do Sul,
Porto Alegre, RS, Brazil.
2Embrapa Trigo, Passo Fundo, RS, Brazil.
3Programa de Pós-Graduação em Recursos Naturais, Universidade Federal de Roraima,
Boa Vista, RR, Brazil.
Abstract
Drought limits wheat production in the Brazilian Cerrado biome. In order to search for candidate genes associated to the response to water deficit, we analyzed the gene expression profiles, under severe drought stress, in roots and leaves of the cultivar MGS1 Aliança, a well-adapted cultivar to the Cerrado. A set of 4,422 candidate genes was found in roots and leaves. The number of down-regulated transcripts in roots was higher than the up-regulated tran-scripts, while the opposite occurred in leaves. The number of common transcripts between the two tissues was 1,249, while 2,124 were specific to roots and 1,049 specific to leaves. Quantitative RT-PCR analysis revealed a 0.78 correlation with the expression data. The candidate genes were distributed across all chromosomes and component genomes, but a greater number was mapped on the B genome, particularly on chromosomes 3B, 5B and 2B. When considering both tissues, 116 different pathways were induced. One common pathway, among the top three acti-vated pathways in both tissues, was starch and sucrose metabolism. These results pave the way for future marker development and selection of important genes and are useful for understanding the metabolic pathways involved in wheat drought response.
Keywords: 454 sequencing, candidate genes, RT-qPCR, Triticum aestivum,water deficit.
Received: December 22, 2015; Accepted: June 27, 2016.
Introduction
The central part of Brazil, consisting mostly of the Cerrado biome, is considered to be the new frontier for in-creasing Brazilian wheat production. Although the wheat harvest in that region can reach more than 4,000 kg.ha-1on
average in irrigated areas (De Mori and Só e Silva, 2013), rainfed cropping has great potential to improve production once it requires little investment and has a large area for ex-pansion. To follow this path, rainfed wheat production in the Brazilian Cerrado must cope with three major abiotic stresses: soil acidity, heat and drought (Scheeren et al.,
2008).
Drought is broadly accepted as the most important environmental stress in agriculture and is a major constraint
on plant survival, productivity and quality (Nezhadahmadi
et al., 2013). Drought is forecast to be exacerbated by
incre-mental increases in temperature and changes in precipita-tion profiles. For instance, each degree °C of increase in global mean temperature is projected to reduce global wheat grain production by approximately 6% (Assenget al., 2015). In Brazil, wheat yield is theorized to be reduced
up to 31% with temperature increases of 3–4 °C, offsetting the positive effects of increased CO2levels on wheat grain
yield (Siqueiraet al., 2000; Streck and Alberto, 2006).
Be-cause water is largely used in irrigated agriculture (70–90% of global water use), this sector will be heavily affected by climate change (Bäret al., 2015). In this context, improving
drought tolerance of wheat cultivars is essential for yield increases in rainfed farming.
Plants have developed several mechanisms to address drought stress, and drought tolerance is a quantitative trait with a complex response at molecular, metabolic and phys-iological levels (Nezhadahmadiet al., 2013). In wheat,
sev-Genetics and Molecular Biology, 39, 4, 629-645 (2016)
Copyright © 2016, Sociedade Brasileira de Genética. Printed in Brazil DOI: http://dx.doi.org/10.1590/1678-4685-GMB-2015-0327
Send correspondence to Jorge Fernando Pereira. Embrapa Trigo, Laboratório de Biotecnologia, Rodovia BR-285 Km 294, Caixa Postal 3081, 99050-970, Passo Fundo, RS, Brazil. E-mail: [email protected]
eral traits, such as the timing of phenological stages, carbohydrate metabolism, stomatal conductance, osmotic adjustment, late senescence of the flag leaf, flowering time, increased root:shoot ratio, high values of soluble stem car-bohydrate shortly after anthesis, and increased early ground cover, among others, have been linked to the drought toler-ance response (Fischeret al., 1998; Foulkeset al., 2007;
Reynoldset al., 2007; Nezhadahmadiet al., 2013). To
un-derstand the mechanisms underlying this response, gene expression analysis using subtractive cDNA libraries and microarrays have been performed in wheat (Zhanget al.,
2004; Wayet al., 2005; Xueet al., 2006, 2008;
Moham-madiet al., 2008; Ergenet al., 2009; Liet al., 2012; Reddy et al., 2014). However, nowadays, the most preferred
tech-nique to evaluate gene expression is high-throughput cDNA sequencing (RNA-Seq) based on next-generation sequencing technology. Up till now, the use of RNA-seq, which is not limited to the number of transcripts pre-defined in probes, to study the drought response in bread wheat (Triticum aestivum) has been rare (Okayet al., 2014;
Liuet al., 2015; Budaket al., 2015). One obstacle to that
type of study in bread wheat is the complexity of its hexa-ploid genome, which is estimated to be 17 gigabases in size and encoding more than 124,000 genes, of which approxi-mately 76% of the assembled sequences contain repeats (IWGSC- International Wheat Genome Sequencing Con-sortium, 2014).
In the present study, a gene expression analysis was performed aiming at the identification of candidate genes involved in the drought responses in a wheat cultivar adapted to the Brazilian Cerrado region. A set of 4,422 can-didate genes was obtained, with 2,124 specific to roots, 1,049 specific to leaves, and 1,249 sequences that were common between both tissues. A strong correlation be-tween RNA-seq and RT-qPCR (quantitative reverse tran-scription polymerase chain reaction) data was observed. The importance of specific chromosome regions and geno-mes, as well as the most activated pathways, are reported. These results are also applied to the understanding of the metabolic pathways involved in wheat drought response.
Materials and Methods
Plant material, drought stress and RNA extraction
The Brazilian wheat cultivar MGS1 Aliança (Triticum aestivum) was used in this study due its good
pro-ductivity in rainfed farming in the Brazilian Cerrado. This cultivar showed the highest yield across different sowing dates among 152 wheat genotypes tested under drought conditions in the Cerrado (Ribeiro Júnior et al., 2006).
MGS1 Aliança was released in 1990 by EPAMIG (Em-presa de Pesquisa Agropecuária de Minas Gerais) and it is still recommended for wheat production in the Cerrado (Comissão Brasileira de Pesquisa de Trigo e Triticale (2016). Seeds of MGS1 Aliança were surface-sterilized in
NaClO (0.2% of active chlorine) for 1 min, washed three times with sterile distilled water (1 min each) and germi-nated at 23 °C in the dark for two days. Germigermi-nated seeds were transferred to pots (3 seeds per pot) containing 6.5 kg of a mixture of soil, sand and vermiculite (2:1:1) and incu-bated in a glasshouse with natural light at 22±4 °C. Plants
were watered daily. Control plants were grown for five weeks at 100% of field capacity while, in the stress treat-ment, plants were watered for 2 weeks at 75% of field ca-pacity followed by 3 weeks of water deprivation. The water status of the plants was monitored by measurement of the leaf relative water content (RWC) (Barrs and Weatherley, 1962) and the water potential (Scholander pump). All three plants from one pot were pooled and the leaves and roots were collected separately, immediately frozen in liquid ni-trogen, and stored at -80 °C. Total RNA was extracted with TRIzol® reagent (Invitrogen) according to the manufac-turer’s instructions, and purified using an RNeasy Mini Kit (Qiagen). During the purification, a DNase digestion step was performed with an RNase-free DNase Set (Qiagen). RNA quality was assessed using a Bioanalyzer (Agilent) and samples with an RIN (RNA integrity number) > 7.5 and rRNA ratio > 1.5 were used in subsequent analyses.
454 Sequencing
Total RNA was sent to Macrogen Inc. (South Korea) for sequencing of four libraries (control root, treated root, control leaf, and treated leaf) on a Genome Sequencer FLX Titanium instrument (Roche) according to standard proto-cols.
Sequence data analysis,de novoassembly and
functional annotation
The sequence data analysis, assembly and annotation followed the protocol available from Macrogen. Briefly, raw data were processed using the Roche GS FLX software v 2.8. The reads were assembled using GS De Novo As-sembler software v 2.6. The assembly parameters were kept at default values for both the assembly and cDNA option. Singleton cleaning (elimination of contaminants, low qual-ity, low-complexity and vectors) was performed in SeqClean (http://sourceforge.net/projects/seqclean/), with a minimum length of 100 bp and Lucy (http://lucy.sourceforge.net/). Similarity analysis was per-formed using BLAST (1.0e-3 cutoff) and the Gene Ontol-ogy (GO) (http://www.geneontolOntol-ogy.org/) database to ob-tain sequence annotations. The data discussed in this study have been deposited in NCBI Gene Expression Omnibus (Edgaret al., 2002) and are accessible through GEO Series
accession number GSE81833
(www.ncbi.nlm.nih.gov/geo).
Statistical analysis
performed with the DEGseq v 2.6 R package (http://www.bioconductor.org/packages/2.6/bioc/html/ DEGseq.html), using the MARS model. Isotigs with a p-value < 0.001 were considered significantly different. The compared samples were: control leaf assembled se-quences (isotigs) versus drought-stressed leaf assembled sequences (isotigs), and control root assembled sequences (isotigs) versus drought-stressed root assembled sequences (isotigs).
CAP3 assembly, Blast2GO, genome assembly and functional annotation
A second round of assembly was performed with two aims: (1) to group sequences lacking previous significant identity that could belong to the same transcript but may have come from different genomic regions; and (2) to com-pare the expression of transcripts in each tissue (leaf and root). All the isotigs and singleton sequences from roots and leaves, as well as the quality sequence files, were used as input. The analysis was performed with CAP3 (Huang and Madan, 1999) software using default parameters, ex-cept for a 40 overlap length cutoff and a 90 overlap percent identity cutoff. Assembled sequences that contained one or more differentially expressed transcript in their composi-tion and had previously been determined (by DEGseq) were considered as differentially expressed (DE) as well. These DE sequences (contigs and singletons) from CAP3 assembly were annotated using Blast2GO software (Götz
et al., 2008) with default parameters. Blast2GO performs
searches against the Gene Ontology (GO), the Kyoto Ency-clopedia of Genes and Genomes (KEGG) and Interpro da-tabases in order to determine the metabolic pathways they belong to. After annotation, the sequences obtained from the Cap3 assembly were mapped against the available Ensembl genomic sequences ofTriticum aestivum(v. 1.26;
http://plants.ensembl.org/Triticum_aestivum/Info/Index) using BWA (Li and Durbin, 2010) and SAMtools (Liet al.,
2009) to analyze the distribution of these sequences over the wheat chromosomes and genomes. Mapping was car-ried out using BWA-SW “-t 6” or 6 threads. A chi-square test was used to determine if the distribution among theT. aestivum component genomes was statistically different.
To identify transcriptions factors (TFs) encoding tran-scripts among the genes differentially expressed under drought, the sequences were compared by similarity search (BlastP cutoff 1e-100) against the Plant Transcription Fac-tor Database version 3.0 (PlantTFDB) (http://www.bmicc.org/web/english/search/planttfdb) (Jin
et al., 2014).
RT-qPCR
Drought stress treatment was similar to the procedure described previously, except that five plants were culti-vated per pot and incubated in a growth cabinet with con-trolled conditions (22 °C with 16/8 hours light/dark and
humidity at 60%). Root and leaf samples, from a pool of five plants belonging to the same pot, were collected at two time points: after two weeks of growth and after five weeks of growth. The experiment was performed in triplicate bio-logical samples. RNA extraction and purification were per-formed as described above. RNA quality and quantity were assessed using a NanoDrop 2000 Spectrophotometer (Thermo Scientific) and 1.5% agarose gels. Synthesis of cDNA was done with the Thermo ScriptTM RT-PCR Sys-tem (Invitrogen) using 2mg of DNA-free RNA and Oligo
(dT)20primers. Gene-specific primers were designed using
Primer3Plus (http://www.bioinformatics.nl/cgi-bin/ primer3plus/primer3plus.cgi/). RT-qPCR assays were con-ducted in technical triplicates using a 7500 Real Time PCR System (Applied Biosystems) with 7500 Software v2.0.6. The cycles and reactions were as follows: 10 min at 95 °C, followed by 40 cycles for 15 s at 95 °C, 30 s at 60 °C, 30 s at 72 °C, and a final melting curve analysis protocol consist-ing of heatconsist-ing to 95 °C for 15 s, 60 °C for 1 min and heatconsist-ing to 95 °C. Reactions were performed in a final volume of 25mL, containing 12.5mL of SYBR®Green PCR Master
Mix (Applied Biosystems), 10 mL of diluted cDNA
(1:100), 0.25mL of primers (10mM each) and 2.25mL of
water. Relative expression data analyses were performed by comparative quantification of the amplified products us-ing the 2-DDCTmethod (Schmittgen and Livak, 2008). The
reference genes used for normalization of expression were those encoding ATPase, Ribosylation Factor, RNAseL (Paolacciet al., 2009), Ta10105, Ta14126 and Ta27922 (Long et al., 2010). The geNorm v3.5 software (http://medgen.ugent.be/ ~jvdesomp/genorm/) was used to select the two best reference genes for the respective exper-imental condition.
Results
Sequencing analysis
In order to search for candidate genes and metabolic pathways associated to drought stress in wheat, high-throughput sequencing was done using 454 sequencing technology with cDNA originating from drought-stressed and control roots and leaves. When harvested, the mean values for leaf water potential and for RWC were, respec-tively, -0.38 MPa and 98% in the control plants and -2.12 MPa and 50.1% in the stressed plants, indicating that, based on the parameters detailed by Hsiao (1973), the treated plants were severely drought-stressed. The se-quencing analyses yielded 1,225,438 reads from the four li-braries (control and treated roots, control and treated leaves). Among these, 305,731 reads were obtained for the root control sample and 300,578 for roots under drought stress. From the total 606,309 reads, 453,218 reads (74.7%) were fully assembled and 32,085 isotigs were identified, with an average size of 1,085 bases and an N50 of 1,299. Fifteen percent (90,933 reads) were partially assembled,
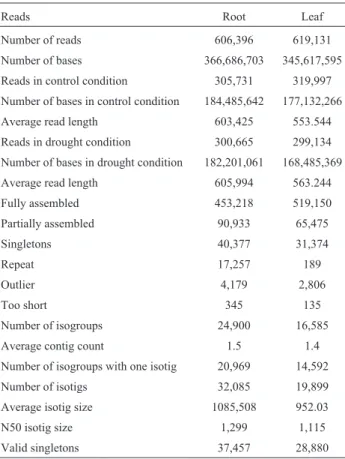
and 6.6% (40,377 reads) remained as singletons, with 37,457 reads considered valid. Additionally, 17,257 reads were anchored to repeat regions, 4,179 were considered outliers and 345 were too short to be used in the computa-tional analysis (Table 1).
Regarding the leaf-derived sequences, 619,131 reads were used in the assembly computation (319,997 from leaves in control sample and 299,134 from leaves under drought stress). From the total, 519,150 reads (83.8%) were fully assembled and 19,899 isotigs were identified, with an average size of 952 bases and an N50 isotig size of 1,115. Approximately 10% of the reads (65,475 reads) were par-tially assembled and 5% (31,374 reads) were singletons, with 28,880 reads considered valid. Furthermore, 189 reads anchored to repeat regions, 2,806 were considered outliers and 135 were too short to be used in the computational anal-ysis (Table 1).
Search for candidate genes
After assembly and annotation, we searched for can-didate genes differentially expressed between control and treated samples. The homogeneous distribution of the four libraries is presented in Figure S1. A total of 4,422 candi-date genes was identified in both tissues (p < 0.001) (Table
S1). Among those, 2,808 isotigs were obtained from roots, with 1,100 up-regulated and 1,708 down-regulated isotigs under stress conditions. Statistical analysis showed that 1,614 isotigs in leaves were significantly different (p-value < 0.001). Up-regulation occurred in 1,017 isotigs, while down-regulation was observed in 597.
Gene Ontology (GO) categories of the candidate genes are shown in Figure 1. The functional annotation of the root and leaf isotigs revealed that 41% and 40% of the sequences were, respectively, involved in biological pro-cess, 25% and 24% in molecular function, 33% and 36% were cellular components, while the remaining sequences were no-hits. The comparison of GO terms among the four main categories revealed that the distribution of candidate genes was similar between root and leaf. Among the se-quences annotated in biological processes, cellular and metabolic processes were highly represented. Among mo-lecular functions, sequences related to binding and catalytic activity were the most represented GO terms. Regarding cellular component, the most represented category was cell part.
Expression profile validation
For validation of the gene expression analysis, a sec-ond and independent experiment was performed where plant samples were collected after two and five weeks of growth. For the two-week-old plants, mean leaf water po-tential and RWC values were -0.37 MPa and 96.7% for the control plants and -0.39 MPa and 95.8% for the treatment. After five weeks of growth, the mean values for leaf water potential and RWC were -0.42 MPa and 95.6% for the con-trol plants and -2.04 MPa and 54.6% for the drought-stressed plants. This indicates that the plants had a similar water status before water was withheld but a different status after five weeks of growth. The analyses of the expression profile in two-week-old control (just before the irrigation withholding) as well as in five-week-old control and treated plants, allowed for the comparison of candidate gene ex-pression not only after the drought period but also before the stress.
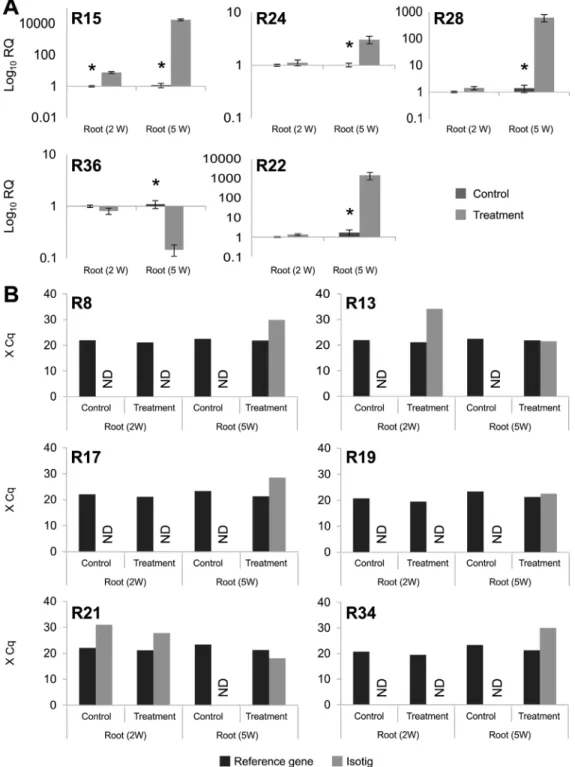
The relative expression of 15 root- and 20 leaf-deri-ved transcripts (Table S2) was measured by RT-qPCR for experimental validation of the RNA-seq data. These 35 transcripts were chosen for validation because they showed different levels of expression (up- or down-regulated), are associated to different enzymes from the same pathway or belong to different metabolic pathways (Table S1). The ex-pression of four root isotigs was not validated because the control and the drought-stressed samples after five weeks of growth were statistically similar. On the other hand, the expression of five root isotigs (R15, R24, R28, R36 and R22) were significantly different between treated and con-trol plants after five weeks of growth (Figure 2A). When comparing the samples collected from two-week-old plants, only the R15 sequence was significantly different Table 1- Analyses of the reads obtained from the four libraries (root
con-trol, root stressed, leaf concon-trol, and leaf stressed)
Reads Root Leaf
Number of reads 606,396 619,131
Number of bases 366,686,703 345,617,595
Reads in control condition 305,731 319,997
Number of bases in control condition 184,485,642 177,132,266
Average read length 603,425 553.544
Reads in drought condition 300,665 299,134
Number of bases in drought condition 182,201,061 168,485,369
Average read length 605,994 563.244
Fully assembled 453,218 519,150
Partially assembled 90,933 65,475
Singletons 40,377 31,374
Repeat 17,257 189
Outlier 4,179 2,806
Too short 345 135
Number of isogroups 24,900 16,585
Average contig count 1.5 1.4
Number of isogroups with one isotig 20,969 14,592
Number of isotigs 32,085 19,899
Average isotig size 1085,508 952.03
N50 isotig size 1,299 1,115
Valid singletons 37,457 28,880
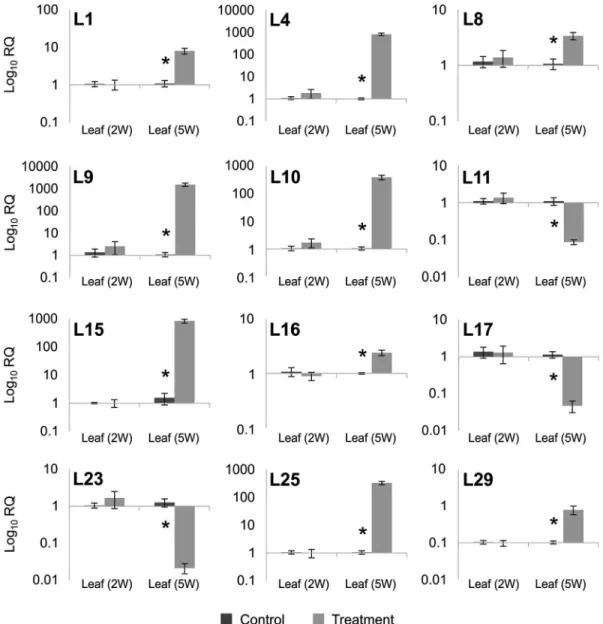
between treatments. For the other six isotigs, expression in control samples was not detected, but was detected in the drought-treated samples, indicating that their expression changed in response to water deprivation. Because of this change, the mean Cq values are presented (Figure 2B). A set of 20 transcripts from leaves was also evaluated by RT-qPCR. The expression of 12 isotigs (L1, L4, L8, L9, L10, L11, L15, L16, L17, L23, L25 and L29) were signifi-cantly different between the control and treated samples of five-week-old plants (Figure 3). Excluding the six root se-quences with non-detected Cq values, the Pearson’s corre-lation between the RNA-seq and RT-qPCR data for the other 29 transcripts was 0.78 (Figure S2).
Genome localization and tissue-specificity of the candidate genes
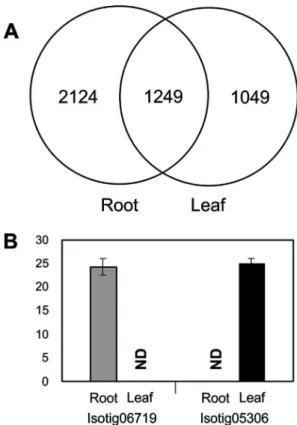
After comparing the candidate genes between root and leaf samples (2,808 and 1,614, respectively), 2,124 se-quences were found to be specifically expressed in roots, 1,049 specifically in leaves, and 1,249 sequences were common to both tissues (Figure 4A). One sequence specific for each tissue (isotig06719, the same as the one used to de-sign the primer R33 listed on Table S2), and isotig05306 (annotated as “AT1G47890 - defense response - kinase ac-tivity”) for root and leaf, respectively, were used for RT-qPCR analyses. The positive amplification of these se-quences in specific tissues (Figure 4B) corroborates ourin
silico analysis. Searches against KEGG failed to detect
pathways for these specific sequences.
An additional assembly (performed with the CAP3 software) allowed for the comparison of transcript expres-sion between the two tissues. A total of 118,321 sequences were used (32,085 isotigs and 37,457 singletons from roots and 19,899 isotigs and 28,880 singletons from leaves). Af-ter the assembly, 11,746 contigs and 69,407 singlets were obtained with 1,393 and 2,594, respectively, considered as differentially expressed and, consequently, as candidate genes. The 3,987 candidate genes (1,393 contigs and 2,594 singlets) were analyzed for functional annotation, with 96.4% of sequences annotated and 4.5% showed mapping results (Figure S3).The highest similarity rate corre-sponded to sequences fromAegilops tauschii(30%),
fol-lowed by Hordeum vulgare (29.5%), Triticum urartu
(15%),T. aestivum(13%) and Brachypodium distachyon
(5.5%) (Figure S3). With regards to the GO distribution of the sequences assembled by CAP3 (Figure 5), the catego-ries with the most abundant sequences in biological pro-cesses were metabolic propro-cesses, cellular propro-cesses, response to stimulus, single-organism processes, localiza-tion and biological regulalocaliza-tion; for molecular funclocaliza-tion the most prevalent categories were catalytic activity and bind-ing; and for cellular components the categories were cell, organelle and membrane.
To identify biological pathways that are active in wheat drought response, the 3,987 candidate genes
de-Genes in wheat under drought 633
Figure 1- Functional annotation of the 4,422 candidate genes detected in root and leaf tissues of the wheat cultivar MGS1 Aliança under drought stress.
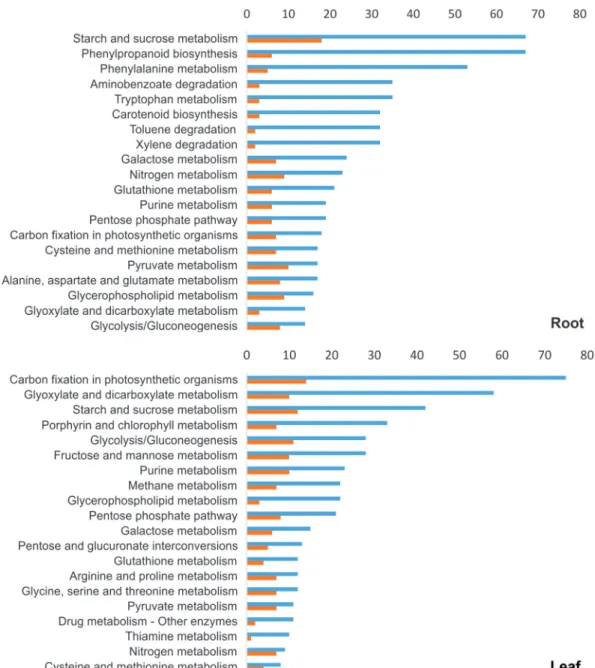
scribed above were analyzed using Blast2GO software a-gainst KEGG pathways. The results revealed 116 different pathways (Table S3) involved in wheat drought response. The top 20 pathways (with the highest number of se-quences) for root and leaf tissues are presented in Figure 6.
Among the top 20 pathways in both tissues, 28 different pathways were detected, with 12 pathways in common but ranked in different positions. Starch and sucrose metabo-lism pathway-related transcripts had the highest ranking in roots but were the third most commonly identified ones in Figure 2- RT-qPCR analysis of selected root transcripts. Expression is shown for 11 transcripts that were validated by RT-qPCR. Wheat roots were
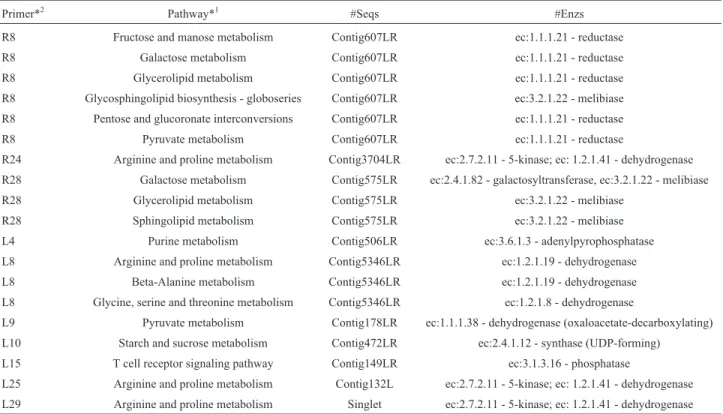
leaves. In addition, the number of sequences for the fruc-tose and mannose pathways was 3.5 times higher in leaves, while the arginine and proline metabolism pathway pre-sented a similar number of sequences for both tissues. We also analyzed putative pathways related to the 22 up-regulated sequences with annotation that were tested by RT-qPCR (Table S2). Among the 22 transcripts, 10 gener-ated results when searched against KEGG, revealing 13 dif-ferent pathways (Table 2). With the exception of L4, whose function was not linked to a specific pathway, all isotigs re-mained in the same enzyme classes and pathways as identi-fied before the assembling with CAP3.
An analysis of the distribution of candidate genes across the wheat genome was done by BLAST searches against the sequencedT. aestivumcv. Chinese Spring
ge-nome (Figure 7, Figure 8). Among the 3,987 candidate genes assembled by CAP3, 158 transcripts could not be mapped. More candidate genes were located in the B ge-nome (p < 0.001 by the chi-square test) compared to the A and D genomes (Figure 7A). In addition, chromosomes 3B, 5B and 2B had more sequences related to drought response (Figure 7B). Candidate genes specific to roots or leaves and in common between the two tissues were detected in all genomes and chromosomes (Figure 7C-E). Although chro-mosomes 3B, 5B and 2B showed the highest number of candidate genes, most of the transcripts mapping to these chromosomes were down-regulated. In fact, only chromo-somes 5A, 6B, 7B and 3D presented at least 10% more up-regulated transcripts than down-regulated ones. The chromosomes with more up-regulated sequences were 3B,
Genes in wheat under drought 635
Figure 3- RT-qPCR analysis of selected leaf transcripts. Expression is shown for the 12 transcripts that were validated by RT-qPCR. Wheat leaves were
5B and 2A. The CAP3 assembly also allowed for the identi-fication of no-hits candidate genes per chromosome (ex-pression only in root or leaf and ex(ex-pression in both tissues), where 88 no-hit sequences were detected (Figure 8). The two chromosomes with the highest numbers of no-hit se-quences were chromosomes 2B and 3B. In these chromo-somes, most of the no-hit sequences was specific to roots (Figure 8B).
Transcription factors
Transcription factors (TFs) play a central role in the plant response to drought (Tuberosa and Salvi, 2006). Thus, we searched for TFs among the differentially ex-pressed sequences. To achieve this, the similarity of the se-quences was evaluated against a plant transcription factor database (PlantTFDB) with an E-value cutoff of e-100. Several TFs, such as E2F/DP, SRS, WOX, M-type, NF-YB, GRF, LBD, CPP, GeBP, STAT, BBR-BPC, Whirly, BES1, NF-YA, NF-YC, HB-PHD, GATA, DBB, NF-X1, VOZ, CO-like, AP2, B3, SBP, Dof, ARR-B, HB-other, MIKC, EIL, Nin-like, Trihelix, G2-like, HD-ZIP, CAMTA, MYB, HSF, ERF, TALE, WRKY,
C2H2, FAR1, bHLH, NAC, bZIP, MYB related, C3H, ARF, GRAS and DREB were found (Figure S4). The spe-cies with the greatest numbers of hits wereOryza sativa ja-ponica, Sorghum bicolor, T. aestivumand B. distachyon
(data not shown).
Discussion
Rainfed wheat plants growing in the Cerrado Biome need to cope with different abiotic stresses, with drought being one of the most important factors. In this context, a wheat cultivar adapted to that region represents an excel-lent model to study drought response mechanisms. Here, we identified 4,422 candidate genes associated to severe drought response in both root and leaf tissues during the tillering stage of the wheat cultivar MGS1 Aliança. Al-though the early stages of pollen development are the most vulnerable to drought in cereals (Fischer, 1973), seed ger-mination and early seedling growth are also considered critical stages for wheat establishment (Zhanget al., 2014).
Therefore, the early phase of wheat development is an im-portant stage to evaluate the effect of drought. Moreover, for wheat farming in the Cerrado, dry spells can occur dur-ing the tillerdur-ing stage (Ribeiro Júnioret al., 2006).
The functional annotation of the transcripts reported here (Figure 1) is in agreement with other reports (Deokar
et al., 2011; Liet al., 2012; Zhouet al., 2012). However,
one important difference is the technique used here (454 se-quencing technology) in comparison to the one used to evaluate the gene expression in previous studies. The 454 technology is an `open’ system in which gene expression can be accurately measured by counting the detected identi-cal transcripts, potentially capturing all the transcripts in a sample (Coramet al., 2008). Although the Blast2GO
analy-sis showed similarity of the bread wheat expressed se-quences with A. tauschii and H. vulgare (Figure S3),
sequences with unknown function or no-hits were also found (Figure 8B). The no-hit sequences are an important contribution of high-throughput sequencing techniques be-cause they represent a more complete description of gene expression and should be important to understand drought stress response in wheat. In our survey, the distribution of the no-hit sequences was higher on chromosome 2B (38, considering both chromosome arms). Regarding the three wheat genome components, the B genome harbored the highest number of no-hit sequences (44) when compared to the D genome (27) and A genome (17) (Figure 8B).
The total number of identified repressed transcripts in response to drought (2,305 for roots and leaves) was higher than the number of induced transcripts (2,117 for both tis-sues). However, when considering each tissue separately, the number of repressed transcripts was lower than the duced transcripts in leaves (597 repressed and 1,017 duced) but higher in roots (1,708 repressed and 1,100 in-duced). A higher number of repressed transcripts under drought conditions in hexaploid wheat was also reported by Figure 4- Root or leaf specific candidate genes identified in response to
other authors (Mohammadiet al., 2008; Liet al., 2012). To
validate the repression/induction detected by the RNA-seq experiment, we used RT-qPCR to confirm the expression profile of 35 candidate genes (15 from roots and 20 from leaves). These candidate genes are representative of differ-ent pathways or code for differdiffer-ent enzymes in the same pathway (Table S2), providing a broad validation of the RNA-seq experiment. The RT-qPCR assays revealed sta-tistically significant differences for 73.3% and 80% se-quences from root and leaf, respectively (Figure 2, Figure 3). Significant differences were not detected for the remain-ing sequences, but the direction of the expression profile
was generally the same, and the Pearson’s correlation be-tween the RNA-seq and RT-qPCR data was 0.78 (Figure S2). It is important to note that the RT-qPCR assays were done as a second and independent experiment for confirma-tion of the gene expression. For RNA-seq experiments re-ported previously by others, the RT-qPCR correlation coef-ficients varied from 0.58 to 0.98 (Nagalakshmiet al., 2008;
Kogenaruet al., 2012). The RT-qPCR technique was also
used to confirm the expression of two tissue-specific se-quences found among the candidate genes (Figure 4).
An important mechanism used by plants to tolerate drought is osmotic adjustment (Nezhadahmadi et al.,
Genes in wheat under drought 637
2013). In this process, accumulation of solutes in cells al-lows to decrease the osmotic potential and to maintain the cell turgor as drought stress develops. Osmoprotectants synthesized in response to drought stress include low mo-lecular weight and highly soluble compounds, such as sug-ars, proline, polyols, and quaternary ammonium (Pintó-Marijuan and Munné-Bosch, 2013). In wheat, osmotic ad-justment is positively associated with higher yield under drought stress and could partly explain the genotypic varia-tion in stomatal response of wheat cultivars thatdifferin
their responses to drought (Morgan and Condon, 1986; Izanlooet al., 2008). Here, we identified the sucrose metab-olism as an important pathway for drought response in the cultivar MGS1 Aliança (Figure 6). When considering both tissues separately, the sucrose metabolism pathway was still found to be among the three most important ones. There are four enzymes that play a key role in starch metab-olism: EC 2.4.1.13 - Susase, EC 2.7.7.27 - AGPase, EC 2.4.1.21 - STSase and EC, 2.4.1.18 - SBE (Yang et al.,
2004), and all these enzymes, except for AGPase, were ac-tivated during the water stress evaluated in this study. These enzymes also played an important role when previ-ously evaluated in wheat plants grown under water stress conditions (Ahmadi and Baker, 2001). In addition, starch and sucrose metabolism, phenylpropanoid biosynthesis, and glyoxylate and dicarboxylate metabolism were also the
most frequently detected KEGG pathways in a trans-criptome analysis of Paulownia australis grown under
drought conditions (Dong et al., 2014). Furthermore,
proline is a solute that plays a role as a protective agent for cells under osmotic stress, performing an important func-tion in the drought stress response (Nezhadahmadiet al.,
2013). In our study, the P5CS1 and DELTA-OAT tran-scripts, related to proline biosynthesis, were up-regulated in leaf and root tissues (Table S4). In contrast, the ALDH12A1 and P5CS2 transcripts were up-regulated only in leaves, and the ALDH1 transcript was up-regulated in roots only. In fact, the arginine and proline metabolism pathway is among the top 20 pathways found to be induced in leaves (Figure 6).
Other transcripts already linked to the drought re-sponse were found among the candidate genes (Table S4). These transcripts include glutathione S-transferase and oth-ers related to glutathione biosynthesis and catabolism (GGT1, GSTU25, AT1G65820 and GSTU18 down-regu-lated in roots; GSH1 and OXP1 up-regudown-regu-lated in roots; GR1 up-regulated in leaves; GSTL3 up-regulated in leaves and roots, and ERD9 down-regulated in roots and up-regulated in leaves); dehydrins (DHN1 up-regulated in leaves and roots); and other late embryogenesis abundant (LEA) pro-teins (LEA7 was down- and up-regulated in leaves, while up-regulation was observed for AtLEA4-1, LEA14, LEA, Table 2- Biological pathways related to 10 sequences validated by RT-qPCR and the respective contigs where they assemble in CAP3.
Primer*2 Pathway*1 #Seqs #Enzs
R8 Fructose and manose metabolism Contig607LR ec:1.1.1.21 - reductase
R8 Galactose metabolism Contig607LR ec:1.1.1.21 - reductase
R8 Glycerolipid metabolism Contig607LR ec:1.1.1.21 - reductase
R8 Glycosphingolipid biosynthesis - globoseries Contig607LR ec:3.2.1.22 - melibiase
R8 Pentose and glucoronate interconversions Contig607LR ec:1.1.1.21 - reductase
R8 Pyruvate metabolism Contig607LR ec:1.1.1.21 - reductase
R24 Arginine and proline metabolism Contig3704LR ec:2.7.2.11 - 5-kinase; ec: 1.2.1.41 - dehydrogenase R28 Galactose metabolism Contig575LR ec:2.4.1.82 - galactosyltransferase, ec:3.2.1.22 - melibiase
R28 Glycerolipid metabolism Contig575LR ec:3.2.1.22 - melibiase
R28 Sphingolipid metabolism Contig575LR ec:3.2.1.22 - melibiase
L4 Purine metabolism Contig506LR ec:3.6.1.3 - adenylpyrophosphatase
L8 Arginine and proline metabolism Contig5346LR ec:1.2.1.19 - dehydrogenase
L8 Beta-Alanine metabolism Contig5346LR ec:1.2.1.19 - dehydrogenase
L8 Glycine, serine and threonine metabolism Contig5346LR ec:1.2.1.8 - dehydrogenase
L9 Pyruvate metabolism Contig178LR ec:1.1.1.38 - dehydrogenase (oxaloacetate-decarboxylating)
L10 Starch and sucrose metabolism Contig472LR ec:2.4.1.12 - synthase (UDP-forming)
L15 T cell receptor signaling pathway Contig149LR ec:3.1.3.16 - phosphatase
L25 Arginine and proline metabolism Contig132L ec:2.7.2.11 - 5-kinase; ec: 1.2.1.41 - dehydrogenase L29 Arginine and proline metabolism Singlet ec:2.7.2.11 - 5-kinase; ec: 1.2.1.41 - dehydrogenase
Analysis was performed with Blast2GO against the Kyoto Encyclopedia of genes and Genomes (KEGG). #Seqs means the number of sequences in that pathway; #Enzs indicates the number of enzymes corresponding to the sequences.
LEA4-5 and dehydrin DHN1; in roots, LEA14, AT2G46140, AtLEA4-1 and LEA7 were up-regulated, while ACC1 was down-regulated). These proteins are im-portant enzymes involved in stress responses, helping to cope with detoxification and reducing cellular damage by recovering denatured proteins and stabilizing membranes (Koaget al., 2003; Umezawaet al., 2006). For example, the
wheat LEA genes PMA1959 and PMA80, improved water deficit resistance in rice (Chenget al., 2002), and the wheat
dehydrin, DHN-5, improved drought tolerance when over-expressed in Arabidopsis thaliana (Brini et al., 2007).
Moreover, these proteins are among the differentially ex-pressed transcripts detected in hard red winter wheat
cultivars submitted to water-deficit conditions (Reddy et al., 2014).
Another strategy to decrease the effects of drought is to retard leaf senescence (a process that is accelerated in drought-sensitive genotypes). In practical terms, leaf senes-cence leads to reduced yield, meaning that the suppression of drought-induced leaf senescence is desirable (Jewellet al., 2010). In the MGS1 Aliança genotype analyzed here,
candidate genes with GO terms related to leaf senescence were found in both tissues (RCA, HAI1 and LTI65 in leaf and SAG12, SAG29, LTI65, ARF1, WRYK70 and OPR1 in root) (Table S4). Moreover, many candidate genes re-lated to the biosynthesis of the hormone abscisic acid
Genes in wheat under drought 639
Figure 6- Top 20 biological pathways of root and leaf tissues activated in the wheat cultivar MGS1 Aliança under drought conditions. Sequences were
(ABA) were also found in our study; for example, the AAO3 and NCED3 (9-cis-epoxycarotenoid dioxygenase) transcripts, which code for important enzymes in the ABA biosynthesis pathway (Table S4). Overexpression of the NCED3 transcript in Arabidopsis leads to tolerance of drought (Iuchi et al., 2001). ABA synthesis increases in plants under water stress, inducing stomatal closure, reduc-ing water loss via transpiration, and shapreduc-ing transcript ex-pression, which is also important for response to salinity and cold (Shinozaki and Yamaguchi-Shinozaki, 1997;
Mahajan and Tuteja, 2005; Guóthet al., 2009). In addition,
transcripts related to ABA transduction signaling were also identified; for example, the OST1 transcript, which re-sponds to ABA stimulus controlling stomatal closure (Mustilliet al., 2002; Yoshidaet al., 2002).
The candidate genes induced by drought stress and classified as “transcription factors” were less numerous than reported by Liet al.(2012). In this category, TFs such
lyzed by others, being up-regulated in roots of a drought-tolerant genotype (Okay et al., 2014) and induced by
drought stress in different species ofTriticum(Baloglu et al., 2014). A large number of TFs has also been found to be
differentially regulated in response to heat, drought and their combination (Liuet al., 2015). In addition, an increase
in drought tolerance has been demonstrated in transgenic plants over-expressing some of those TFs, such as trans-genic Arabidopsis expressing NAC TF or TaMYB2A (Mao
et al., 2011; Liet al., 2014), rice expressing the DREB1A
from Arabidopsis (Ravikumaret al., 2014), wheat plants
overexpressing MYB-TF (TaPIMP1) or TaERF3 (Zhanget al., 2012; Rong et al., 2014) and tobacco expressing
TaABP1 (bZIP-TF) or TaWRKY10 (Cao et al., 2012;
Wanget al., 2013).
One of the practical applications of the isolation of drought-related genes is the development of transgenic plants that are more tolerant to drought stress. So far, several papers have reported on that approach, using tran-scripts belonging to some of the functional groups dis-cussed above. Examples in transgenic wheat include osmoprotectant genes (Abebeet al., 2003; Vendruscoloet al., 2007), LEA proteins (Sivamaniet al., 2000; Bahieldin et al., 2005), a gene from the C4pathway (Qinet al., 2015)
and TFs (Morranet al., 2011; Xueet al., 2011; Saint Pierre et al., 2012; Zhanget al., 2012). In these reports, the
experi-ments were performed with genes obtained from A. thaliana(DREB),Atriplex hortensis(BADH),Escherichia coli(mtlDorbetA), barley (HVA1), cotton (GhDREB), rice
(SNAC1), orVigna aconitifolia(P5CS). Only a few studies
have been performed with genes isolated from wheat, such as TaDREB2, TaDREB3, TaNAC69-1, or TaPIMP1
(Morranet al., 2011; Xueet al., 2011; Zhanget al., 2012).
So far, field data regarding the performance of these trans-genic plants have not been conclusive, with the transtrans-genic lines not outperforming the controls or showing unstable performance along the years (Bahieldinet al., 2005; Saint
Pierreet al., 2012). Nonetheless, it should be interesting to
evaluate the production of these plants in the Cerrado region.
The candidate genes found here are distributed across all component genomes and chromosomes of the wheat ge-nome (Figure 7, Figure 8). The number of sequences be-longing to the B genome was higher in comparison with the A and D genomes. During evolution, the diploid genomes A and B (T. urartu and an unknown species of section Sitopsis, respectively) underwent an alloploydization event
to form the tetraploid wheatT. turgidum, followed by
an-other alloploydization with the D genome (T. turgidum)
(Leachet al., 2014). It has been shown that there is a
ten-dency of B genome homoeoloci to contribute more to gene expression in wheat than A or D genome homoeoloci
Genes in wheat under drought 641
Figure 8- Heat map showing the localization of the candidate genes associated to drought response in the wheat cultivar MGS1 Aliança. Hit distribution
(Leach et al., 2014). Moreover, the wild T. turgidum
(AABB genome), which is the ancestor of cultivatedT. turgidumandT. aestivum(Budaket al., 2013), contains a
gene pool enriched for various agronomic traits, including drought tolerance (Peleget al., 2008; Ergenet al., 2009).
That information could encourage investigations on drought response in tetraploid wheat, and that tolerance could be incorporated into synthetic lines. However, it is important to note that the interaction among the A, B and D genomes could activate or silence homeologous genes (Wanget al., 2011), making the introduction of genes from
the B genome into the hexaploid genome a laborious task. Figures 7 and 8 also show that chromosomes 3B, 5B and 2B contribute with a greater number of drought-related tran-scripts in both roots and leaves. In wheat, quantitative trait loci (QTL) identified under different water regimes have been reported for traits like, for example, canopy tempera-ture, carbon isotope discrimination, photosynthetic param-eters and yield or yield components (Sheoranet al., 2016).
Virtually all wheat chromosomes and component genomes contain QTL for drought tolerance, most of them explain-ing a small fraction of the observed phenotypic variation. When focusing on chromosomes 3B, 5B and 2B, the major regions identified in our study, QTL for a number of traits correlated to drought tolerance have been described like, for instance, abscisic acid, canopy temperature, carbon iso-tope discrimination, chlorophyll content, coleoptile length, flag leaf rolling index, flag leaf senescence, grain number, grain size, grain weight, normalized difference vegetation index, water soluble carbohydrates, phenology (anthesis, heading, maturity), plant height, and yield (Sheoranet al.,
2016). The co-localization of the QTL with some of the candidate genes obtained in this survey could be an inter-esting target for future work.
In conclusion, the present study allowed for the iden-tification of genes related to important pathways for drought response in the wheat cultivar MGS1 Aliança, a well-adapted cultivar for rainfed farming in the Cerrado Biome. Clearly, our results showed that the main pathways activated under water deprivation differ for roots and leaves. Increments in drought tolerance through conven-tional and biotechnological approaches should take this dif-ference into consideration. The drought stress-related tran-scripts described here will be further characterized to provide targets of interest for breeders. They are also im-portant to elucidate the complex regulatory network(s) of the drought response. The characterization of candidate genes that are differentially expressed among drought-tolerant and -sensitive genotypes can help identify useful molecular markers and candidate genes. In the long run, the interesting targets and molecular markers can be used to achieve more sustainable wheat production.
Acknowledgments
We thank the Coordenação de Aperfeiçoamento de Pessoal de Nível Superior (CAPES) for a PhD scholarship granted to LBPB. The study received financial support from Embrapa (Projects “Fenotipagem, avaliação de meca-nismos de tolerância e associação genômica aplicadas ao desenvolvimento de recursos genéticos de cereais adap-tados à seca” and “Desenvolvimento de recursos genéticos de cereais tolerantes à seca”). We also thank Dr. Márcio Só e Silva (Embrapa Trigo) for providing the MGS1 Aliança seeds, Dr. Edson Costenaro (Embrapa Trigo) for helping with the water potential measurements and Dr Cláudio Brondani (Embrapa Arroz e Feijão) for the RNA quality analysis using Bioanalyzer.
References
Abebe T, Guenzi AC, Martin B and Cushman JC (2003) Toler-ance of mannitol-accumulating transgenic wheat to water stress and salinity. Plant Physiol 131:1748-1755.
Ahmadi A and Baker DA (2001) The effect of water stress on the activities of key regulatory enzymes of the sucrose to starch pathway in wheat. Plant Growth Regul 35:81-91.
Asseng S, Ewert F, Martre P, Rötter RP, Lobell DB, Cammarano D, Kimball BA, Ottman MJ, Wall GW, White JW, et al.
(2015) Rising temperatures reduce global wheat production. Nat Clim Change 5:143-147.
Bahieldin A, Mahfouz HT, Eissa HF, Saleh OM, Ramadan AM, Ahmed IA, Dyer WE, El-Itriby HA and Madkour MA (2005) Field evaluation of transgenic wheat plants stably ex-pressing theHVA1 gene for drought tolerance. Physiol Plant 123:421-427.
Baloglu MC, Inal B, Kavas M and Unver T (2014) Diverse ex-pression pattern of wheat transcription factors against abio-tic stresses in wheat species. Gene 550:117-122.
Bär R, Rouholahnedjad E, Rahman K, Abbaspour KC and Lehmann A (2015) Climate change and agricultural water resources: A vulnerability assessment of the Black Sea catchment. Environ Sci Policy 46:57-69.
Barrs HD and Weatherley PE (1962) A re-examination of the rela-tive turgidity technique for estimating water deficits in leaves. Aust J Biol Sci 15:413-428.
Brini F, Hanin M, Lumbreras V, Amara I, Khoudi H, Hassairi A, Pagès M and Masmoudi K (2007) Overexpression of wheat dehydrin DHN-5 enhances tolerance to salt and osmotic stress in Arabidopsis thaliana. Plant Cell Rep 26:2017-2026.
Budak H, Hussain B, Khan Z, Ozturk NZ and Ullah N (2015) From genetics to functional genomics: Improvement in drought signaling and tolerance in wheat. Front Plant Sci 6:102.
Budak H, Kantar M and Yucebilgili Kurtoglu K (2013) Drought tolerance in modern and wild wheat. Sci World J ID 548246. Cao XY, Chen M, Xu ZS, Chen YF, Li LC, Yu YH, Liu YN and
MA YZ (2012) Isolation and functional analysis of the bZIP transcription factor gene TaABP1 from a chinese wheat landrace. J Integr Agr 11:1580-1591.
toler-ance of transgenic rice (Oryza sativa L.). Mol Breeding
10:71-82.
Comissão Brasileira de Pesquisa de Trigo e Triticale (2016) In-formações Técnicas para Trigo e Triticale - Safra 2016. In: 9ª Reunião da Comissão Brasileira de Pesquisa de Trigo e Triticale. Passo Fundo, 228 p.
Coram TE, Brown-Guedira G and Chen X (2008) Using tran-scriptomics to understand the wheat genome. CAB Persp Agric, Vet Sci, Nutr Nat Resour 3:1-9.
De Mori C and Só e Silva M (2013) Panorama da triticultura no Brasil e em Minas Gerais. Inf Agropec 34:7-18.
Deokar AA, Kondawar V, Jain PK, Karuppayil SM, Raju NL, Vadez V, Varshney RK and Srinivasan R (2011) Compara-tive analysis of expressed sequence tags (ESTs) between drought-tolerant and -susceptible genotypes of chickpea un-der terminal drought stress. BMC Plant Biol 11:70. Dong Y, Fan G, Zhao Z and Deng M (2014) Transcriptome
ex-pression profiling in response to drought stress inPaulownia australis. Int J Mol Sci 15:4583-4607.
Edgar R, Domrachev M and Lash AE (2002) Gene Expression Omnibus: NCBI gene expression and hybridization array data repository. Nucleic Acids Res 30:207-210.
Ergen NZ, Thimmapuram J, Bohnert HJ and Budak H (2009) Transcriptome pathways unique to dehydration tolerant rel-atives of modern wheat. Funct Integr Genomic 9:377-396. Fischer RA (1973) The effect of water stress at various stages of
development on yield processes in wheat. In: Slatyer RO (ed) Plant Response to Climate Factors. UNESCO, Paris, pp 233-241.
Fischer RA, Rees D, Sayre KD, Lu ZM, Condon AG and Saavedra AL (1998) Wheat yield progress associated with higher stomatal conductance and photosynthetic rate, and cooler canopies. Crop Sci 38:1467-1475.
Foulkes MJ, Sylvester-Bradley R, Weightman R and Snape JW (2007) Identifying physiological traits associated with im-proved drought resistance in winter wheat. Field Crop Res 103:11-24.
Götz S, García-Gómez JM, Terol J, Williams TD, Nagaraj SH, Nueda MJ, Robles M, Talón M, Dopazo J and Conesa A (2008) High-throughput functional annotation and data min-ing with the Blast2GO suite. Nucleic Acids Res 36:3420-3435.
Guóth A, Tari I, Gallé Á, Csiszár J, Pécsváradi A, Cseuz L and Erdei L (2009) Comparison of the drought stress responses of tolerant and sensitive wheat cultivars during grain filling: Changes in flag leaf photosynthetic activity, ABA levels, and grain yield. J Plant Growth Regul 28:167-176. Hsiao TC (1973) Plant responses to water stress. Ann Rev Plant
Physiol 24:519-570.
Huang X and Madan A (1999) CAP3: A DNA sequence assembly program. Genome Res 9:868-877.
Iuchi S, Kobayashi M, Taji T, Naramoto M, Seki M, Kato T, Tabata S, Kakubari Y, Yamaguchi-Shinozaki K and Shino-zaki K (2001) Regulation of drought tolerance by gene ma-nipulation of 9-cis-epoxycarotenoid dioxygenase, a key en-zyme in abscisic acid biosynthesis inArabidopsis. Plant J 27:325-333.
Izanloo A, Condon AG, Langridge P, Tester M and Schnurbusch T (2008) Different mechanisms of adaptation to cyclic water stress in two South Australian bread wheat cultivars. J Exp Bot 59:3327-3346.
IWGSC - International Wheat Genome Sequencing Consortium (2014) A chromosome-based draft sequence of the hexa-ploid bread wheat (Triticum aestivum) genome. Science 345:1251788.
Jewell MC, Campbell BC and Godwin ID (2010) Transgenic plants for abiotic stress resistance. In: Kole C, Michler CH, Abbott AG and Hall TC (eds) Transgenic Crop Plants. Vol-ume 2: Utilization and Biosafety. Springer, Berlin, pp 67-132.
Jin J, Zhang H, Kong L, Gao G and Luo J (2014) PlantTFDB 3.0: A portal for the functional and evolutionary study of plant transcription factors. Nucleic Acids Res 42:D1182-D1187. Koag MC, Fenton RD, Wilkens S and Close TJ (2003) The
bind-ing of maize DHN1 to lipid vesicles. Gain of structure and lipid specificity. Plant Physiol 131:309-316.
Kogenaru S, Yan Q, Guo Y and Wang N (2012) RNA-seq and microarray complement each other in transcriptome profil-ing. BMC Genomics 13:629.
Leach LJ, Belfield EJ, Jiang C, Brown C, Mithani A and Harberd NP (2014) Patterns of homoeologous gene expression shown by RNA sequencing in hexaploid bread wheat. BMC Genomics 15:276.
Li H and Durbin R (2010) Fast and accurate long-read alignment with Burrows-Wheeler transform. Bioinformatics 26:589-595.
Li H, Handsaker B, Wysoker A, Fennell T, Ruan J, Homer N, Marth G, Abecasis G, Durbin R and 1000 Genome Project Data Processing Subgroup (2009) The Sequence Align-ment/Map (SAM) Format and SAMtools. Bioinformatics 25:2078-2079.
Li X, Yang X, Hu Y, Yu X and Li Q (2014) A novel NAC tran-scription factor from Suaeda liaotungensis K. enhanced
transgenicArabidopsisdrought, salt, and cold stress
toler-ance. Plant Cell Rep 33:767-778.
Li YC, Meng FR, Zhang CY, Zhang N, Sun MS, Ren JP, Niu HB, Wang X and Yin J (2012) Comparative analysis of water stress-responsive transcriptomes in drought-susceptible and -tolerant wheat (Triticum aestivumL.). J Plant Biol
5:349-360.
Liu Z, Xin M, Qin J, Peng H, Ni Z, Yao Y and Sun Q (2015) Tem-poral transcriptome profiling reveals expression partitioning of homeologous genes contributing to heat and drought ac-climation in wheat (Triticum aestivumL.). BMC Plant Biol 15:152.
Long XY, Wang JR, Ouellet T, Rocheleau H, Wei YM, Pu ZE, Jiang QT, Lan XJ and Zheng YL (2010) Genome-wide iden-tification and evaluation of novel internal control genes for Q-PCR based transcript normalization in wheat. Plant Mol Biol 74:307-311.
Mahajan S and Tuteja N (2005) Cold, salinity and drought stres-ses: An overview. Arch Biochem Biophys 444:139-158. Mao X, Jia D, Li A, Zhang H, Tian S, Zhang X, Jia J and Jing R
(2011) Transgenic expression of TaMYB2A confers
en-hanced tolerance to multiple abiotic stresses inArabidopsis. Funct Integr Genomic 11:445-465.
Mohammadi M, Kav NN and Deyholos MK (2008) Transcript ex-pression profile of water-limited roots of hexaploid wheat (Triticum aestivum‘Opata’). Genome 51:357-367.
Morgan JM and Condon AG (1986) Water use, grain yield, and osmoregulation in wheat. Funct Plant Biol 13:523-532.
Morran S, Eini O, Pyvovarenko T, Parent B, Singh R, Ismagul A, Eliby S, Shirley N, Langridge P and Lopato S (2011) Im-provement of stress tolerance of wheat and barley by modu-lation of expression of DREB/CBF factors. Plant Biotech J 9:230-249.
Mustilli AC, Merlot S, Vavasseur A, Fenzi F and Giraudat J (2002) Arabidopsis OST1 protein kinase mediates the regu-lation of stomatal aperture by abscisic acid and acts up-stream of reactive oxygen species production. Plant Cell 14:3089-3099.
Nagalakshmi U, Wang Z, Waern K, Shou C, Raha D, Gerstein M and Snyder M (2008) The transcriptional landscape of the yeast genome defined by RNA sequencing. Science 320:1344-1349.
Nezhadahmadi A, Prodhan ZH and Faruq G (2013) Drought toler-ance in wheat. Sci World J ID 610721.
Okay S, Derelli E and Unver T (2014) Transcriptome-wide identi-fication of bread wheat WRKY transcription factors in re-sponse to drought stress. Mol Genet Genomics 289:765-781. Paolacci AR, Tanzarella OA, Porceddu E and Ciaffi M (2009) Identification and validation of reference genes for quantita-tive RT-PCR normalization in wheat. BMC Mol Biol 10:11. Peleg ZVI, Saranga Y, Krugman T, Abbo S, Nevo E and Fahima T
(2008) Allelic diversity associated with aridity gradient in wild emmer wheat populations. Plant Cell Environ 31:39-49.
Pintó-Marijuan M and Munné-Bosch S (2013) Ecophysiology of invasive plants: Osmotic adjustment and antioxidants. Trends Plant Sci 18:660-666.
Qin N, Xu W, Hu L, Li Y, Wang H, Qi X, Fang Y and Hua X (2015) Drought tolerance and proteomics studies of trans-genic wheat containing the maize C4phosphoenolpyruvate
carboxylase (PEPC) gene. Protoplasma DOI
10.1007/s00709-015-0906-2.
Ravikumar G, Manimaran P, Voleti SR, Subrahmanyam D, Sun-daram RM, Bansal KC, Viraktamath BC and Balachandran SM (2014) Stress-inducible expression ofAtDREB1A
tran-scription factor greatly improves drought stress tolerance in transgenicindicarice. Transgenic Res 23:421-439.
Reddy SK, Liu S, Rudd JC, Xue Q, Payton P, Finlayson SA, Mahan J, Akhunova A, Holalu SV and Lu N (2014) Physiol-ogy and transcriptomics of water-deficit stress responses in wheat cultivars TAM 111 and TAM 112. J Plant Physiol 171:1289-1298.
Reynolds M, Dreccer F and Trethowan R (2007) Drought-adap-tive traits derived from wheat wild relaDrought-adap-tives and landraces. J Exp Bot 58:177-186.
Ribeiro Junior WQ, Ramos MLG, Vasconcelos U, Trindade MG, Ferreira FM, Siqueira MMH, Silva HLM, Rodrigues GC, Guerra AF, Rocha OC, et al. (2006) Fenotipagem para Tolerância à Seca Visando o Melhoramento Genético do Trigo no Cerrado. Circular Técnica Online 27. Embrapa Trigo, Passo Fundo, 17 p.
Rong W, Qi L, Wang A, Ye X, Du L, Liang H, Xin Z and Zhang Z (2014) The ERF transcription factor TaERF3 promotes tol-erance to salt and drought stresses in wheat. Plant Bio-technol J 12:468-479.
Saint Pierre C, Crossa JL, Bonnett D, Yamaguchi-Shinozaki K and Reynolds MP (2012) Phenotyping transgenic wheat for drought resistance. J Exp Bot 63:1799-1808.
Scheeren PL, Caierão E, Silva MS, Nascimento AJ, Caetano VR, Bassoi MC, Brunetta D, Albrecht JC, Quadros WJ, Sousa PG,et al.(2008) Challenges to wheat production in Brazil. In: Reynolds MP, Pietragalla J and Braun HJ (eds) Interna-tional Symposium on Wheat Yield Potential: Challenges to International Wheat Breeding. CIMMYT, Mexico City, DF, pp 167-170.
Schmittgen TD and Livak KJ (2008) Analyzing real-time PCR data by the comparative CT method. Nat Protoc
3:1101-1108.
Sheoran S, Malik R, Narwal S, Tyagi BS, Mittal V, Kharub AS, Tiwari V and Sharma I (2016) Genetic and molecular dis-section of drought tolerance in wheat and barley. J Wheat Res 7:1-13.
Shinozaki K and Yamaguchi-Shinozaki K (1997) Gene expres-sion and signal transduction in water-stress response. Plant Physiol 115:327-334.
Siqueira OJW, Steinmetz S, Ferreira MF, Costa AC and Wozniak MA (2000) Mudanças climáticas projetadas através dos mo-delos GISS e reflexos na produção agrícola brasileira. Rev Bras Agrometeorol 8:311-320.
Sivamani E, Bahieldin A, Wraith JM, Al-Niemi T, Dyer WE, Ho THD and Qu R (2000) Improved biomass productivity and water use efficiency under water deficit conditions in trans-genic wheat constitutively expressing the barley HVA1 gene. Plant Sci 155:1-9.
Streck NA and Alberto CM (2006) Estudo numérico do impacto da mudança climática sobre o rendimento de trigo, soja e milho. Pesq Agropec Bras 41:1351-1359.
Tuberosa R and Salvi S (2006) Genomics-based approaches to improve drought tolerance of crops. Trends Plant Sci 11:405-412.
Umezawa T, Fujita M, Fujita Y, Yamaguchi-Shinozaki K and Shinozaki K (2006) Engineering drought tolerance in plants: Discovering and tailoring genes to unlock the future. Curr Opin Biotechnol 17:113-122.
Vendruscolo ECG, Schuster I, Pileggi M, Scapim CA, Molinari HBC, Marur CJ and Vieira LGE (2007) Stress-induced syn-thesis of proline confers tolerance to water deficit in trans-genic wheat. J Plant Physiol 164:1367-1376.
Xue GP, McIntyre CL, Chapman S, Bower NI, Way H, Reverter A, Clarke B and Shorter R (2006) Differential gene expres-sion of wheat progeny with contrasting levels of transpira-tion efficiency. Plant Mol Biol 61:863-881.
Xue GP, McIntyre CL, Glassop D and Shorter R (2008) Use of ex-pression analysis to dissect alterations in carbohydrate me-tabolism in wheat leaves during drought stress. Plant Mol Biol 67:197-214.
Xue GP, Way HM, Richardson T, Drenth J, Joyce PA and McIntyre CL (2011) Overexpression ofTaNAC69leads to enhanced transcript levels of stress up-regulated genes and dehydration tolerance in bread wheat. Mol Plant 4:697-712. Yang J, Zhang J, Wang Z, Xu G and Zhu Q (2004) Activities of
key enzymes in sucrose-to-starch conversion in wheat grains subjected to water deficit during grain filling. Plant Physiol 135:1621-1629.
Wang C, Deng P, Chen L, Wang X, Ma H, Hu W, Yao N, Feng Y, Chai R, Yang G,et al.(2013) A wheat WRKY transcription factor TaWRKY10 confers tolerance to multiple abiotic stresses in transgenic tobacco. PloS One 8:e65120. Wang J, Liu D, Guo X, Yang W, Wang X, Zhan K and Zhang A
(2011) Variability of gene expression after polyhaplo-idization in wheat (Triticum aestivumL.). G3 (Bethesda) 1:27-33.
Way H, Chapman S, McIntyre L, Casu R, Xue GP, Manners J and Shorter R (2005) Identification of differentially expressed genes in wheat undergoing gradual water deficit stress using a subtractive hybridisation approach. Plant Sci 168:661-670. Zhang D, Choi DW, Wanamaker S, Fenton RD, Chin A, Malatrasi M, Turuspekov Y, Walia H, Akhunov ED, Kianian P,et al.
(2004) Construction and evaluation of cDNA libraries for large-scale expressed sequence tag sequencing in wheat (Triticum aestivumL.). Genetics 168:595-608.
Zhang H, Cui F and Wang H (2014) Detection of quantitative trait loci (QTLs) for seedling traits and drought tolerance in wheat using three related recombinant inbred line (RIL) populations. Euphytica 196:313-330.
Zhang Z, Liu X, Wang X, Zhou M, Zhou X, Ye X and Wei X (2012) An R2R3 MYB transcription factor in wheat, TaPIMP1, mediates host resistance toBipolaris sorokiniana
and drought stresses through regulation of defense-and stress-related genes. New Phytol 196:1155-1170.
Zhou Y, Gao F, Liu R, Feng J and Li H (2012)De novo sequenc-ing and analysis of root transcriptome ussequenc-ing 454
pyrose-quencing to discover putative genes associated with drought tolerance inAmmopiptanthus mongolicus. BMC Genomics 13:266.
Supplementary Material
The following online material is available for this article: Figure S1 - Gene expression distribution between control and drought-stressed (treated) roots and leaves of the wheat cultivar MGS1 Aliança.
Figure S2 - Correlation of transcript levels between RNA-seq and RT-qPCR data.
Figure S3 - Results of the Blast2GO analysis with the 3,987 candidate genes.
Figure S4 - Transcription factor distribution by family. Table S1 - The set of 4,422 candidate genes identified in root and leaf tissues of the wheat cultivar MGS1 Aliança under drought.
Table S2 - Group of transcripts used in validation by RT-qPCR.
Table S3 - Biological pathways activated in wheat drought response (Blast2GO and KEGG analysis)
Table S4 - Details of selected candidate genes.
Associate Editor: Dario Grattapaglia
License information: This is an open-access article distributed under the terms of the Creative Commons Attribution License (type CC-BY), which permits unrestricted use, distribution and reproduction in any medium, provided the original article is properly cited.