RESUMO.- [Peso e crescimento morfométrico
de pacu (Piaractus mesopotamicus), tambaqui
(Colossoma macropumum) e seus híbridos da primavera ao inverno.] Este estudo teve como objetivo avaliar o peso e crescimento morfométrico dos produtos do cruzamento dialélico completo entre pacu e tambaqui. 20 peixes de cada grupo foram coletados, pesados e submetidos à análise morfométrica a cada 28 dias. O modelo que obteve o maior coeficiente de determinação e que melhor se ajuste ao método de Akaike foi verificado. A função logística foi ajustada para melhor descrever o crescimento do peso corporal e as medidas morfométricas para a idade em todos os grupos genéticos. Os quatro grupos estudados apresentaram comportamento semelhante para o peso corporal, bem como para as medidas ABSTRACT.- Mourad N.M.N., Costa A.C., Freitas R.T.F., Serafini M.A., Reis Neto R.V. & Felizardo
V.O. 2018. Weight and morphometric growth of Pacu (Piaractus mesopotamicus), Tambaqui (Colossoma macropumum) and their hybrids from spring to winter. Pesquisa Veterinária Brasileira 38(3):544-550. Departamento de Zootecnia, Universidade Federal de Lavras, Av. Doutor Sylvio Menicucci 1001, Kennedy, Cx. Postal 3037, Lavras, MG 37200-000, Brazil. E-mail: [email protected].br
This study aimed to evaluate weight and morphometric growth of the products of the complete diallel cross-breeding between pacu and tambaqui during the period from the end of spring to the beginning of winter. Was used 400 pacu, tambaqui, tambacu and paqui. 20 fish from each group were collected, weighed and submitted to morphometric evaluation every 28 days. The Logistic function adjusted better to describe the growth in body weight and the morphometric measures for age on all the genetic groups. The studied groups presented similar behavior of growth for body weight and morphometric measures. There were significant differences between the genetic groups regarding parameters A (asymptotic value) and B (integration constant) for body weight and for all the morphometric measures evaluated. For the parameter K (maturity rate), there were significant difference between groups for body weight, head length and body height. The groups possibly were affected the decrease of temperature. The Tambacu was superior to the Paqui in all the variables evaluated for the parameter A, and was also superior to the pure breed, except for head length and body width.
INDEX TERMS: Pacu, Piaractus mesopotamicus, tambaqui, Colossoma macropumum, growth curve, cross-breeding, body form, fishes, poikilotherm animals.
Vet 2338 pvb-4808 LD
Weight and morphometric growth of Pacu
(
Piaractus mesopotamicus
)
, Tambaqui
(
Colossoma macropumum
) and their hybrids from
spring to winter
1Natália M.N. Mourad2, Adriano C. Costa3, Rilke T.F. Freitas2, Moacyr A. Serafini4, Rafael V. Reis Neto5 and Viviane O. Felizardo2*
1 Received on June 10, 2016.
Accepted for publication on January 11, 2017.
2 Departamento de Zootecnia, Universidade Federal de Lavras,
Campus universitário, Av. Doutor Sylvio Menicucci 1001, Kennedy, Cx. Postal 3037, Lavras, MG 37200-000, Brazil. E-mails: [email protected], [email protected]; *Corresponding author: [email protected]
3 Instituto Federal Goiano, Câmpus Rio Verde, Rodovia Sul Goiana
Km 1, Cx. Postal 66, Zona Rural, Rio Verde, GO 75901-970, Brazil. E-mail: [email protected]
4 Instituto Federal do Espírito Santo, Campus Sta Teresa, MEC, Rodovia
Armando Martinelli ES-080 Km 20, São João de Petrópolis, Santa Teresa, ES 29660-000, Brazil. E-mail: [email protected]
5 Departamento de Engenharia de Pesca, Universidade Estadual Paulista
morfométricas. Houve diferenças significativas entre os grupos genéticos sobre os parâmetros A (valor assintótico) e B (constante de integração) para o peso corporal e para todas as medidas morfométricas avaliadas. Para o parâmetro K (taxa de maturação), houve diferença significativa entre os grupos para o peso corporal, comprimento da cabeça e altura do corpo. Os grupos possivelmente foram afetados pela diminuição da temperatura. O tambacu foi superior ao Paqui em todas as variáveis avaliadas para o parâmetro A, e também foi superior para a raça pura, exceto para o comprimento e largura do corpo de cabeça.
TERMOS DE INDEXAÇÃO: Pacu, Piaractus mesopotamicus, tambaqui, Colossoma macropumum, peso, crescimento, cruzamento de raças, forma do corpo, peixes, animais poiquilotermos.
INTRODUCTION
In the last ten years the intensification of tropical native fish cultivation has been increasing in Brazil, particularly of species such as pacu and tambaqui, which present a great potential for production. Both species are considered promising for possessing meat of excellent flavor, high filet yield (45%), low demand on water quality, easy adaptation to the cultivating, resistance to pathogens, in addition to being two of the most appreciated species for game fishing (Signor et al. 2010).
The pacu and the tambaqui present the same number of chromosomes (2n = 54), which allows the paring and formation of normal embryos between the cross-breeding of these two species. The hybrids derived from this cross-breeding are known as tambacu, female tambaqui and male pacu, and paqui, female pacu and male tambaqui (Saracura & Castagnolli 1990). These cross-breedings are very commonly done in national pisciculture sectors, however, scientific papers evaluating the productive indexes of these genetic groups are scarce.
Among the productive indexes, growth is the most important parameter to be improved in a selection program, according to Huang & Liao (1990). One of the means to evaluate growth is by non-linear models. The studies on these growth models summarize a series of data in a small set of parameters biologically interpretable. To this end, adjustments are made to prediction equations which use weight based on the age of the animal (Freitas 2007).
The study on non-linear model adjustment for body weight and morphometric measures based on age, are scarce for fish. The emergence of species cross-breeding of zootechnical interest, such as pacu and tambaqui, generate hybrids, which demand this kind of evaluation in different environments and cultivating systems for future comparisons (Santos et al. 2007). These studies are important, since they might provide data on the evaluation of productive and economic performance of the cultivation.
Many factors can affect the growth of fish, such as: genetics, nutrition and temperature. Thus, this work was done with the objective of evaluating weight and morphometric growth of the products of the diallel cross-breeding between pacu and tambaqui during the cultivating period comprehended between the end of spring and the beginning of winter in the Southeast region.
MATERIALS AND METHODS
The experiment was carried out in the pisciculture sector of the Escola Agrotécnica Federal de Colatina, ES (EAFCOL), situated at 17 km from Colatina, during a period of 271 days, in the months of October to July.
The diallel cross-breeding between the pacu and the tambaqui was done, aiming at obtaining juveniles of four genetic groups. This cross-breeding was done by means of harmonization, according to protocol described by Andrade & Yasui (2003).
The experiment began three hundred days after the reproduction, with 400 pacu, tambaqui, tambacu and paqui juveniles, with average weight of 66.18±13.49g; 54.59±11.01g; 91.30±13.44g and 73.98±10.76g, respectively. The juveniles were stored and cultivated separately in hapas of 6x11 meters, manufactured in polypropylene netting of 9x9mm, and allocated inside excavated ponds of 400 m2.
The fish were fed extruded commercial feed containing 35% of crude protein according to the biomass of each genetic group and cultivation phase (5% in the first week to 1% in the last week).
The water quality parameters were monitored, and the water temperature measured at the beginning and the end of each day with a “mercury thermometer”; the oxygen and pH were measured weekly, using a “digital dissolved oxygen gauge HI98186” and a portable pH meter ORP-HI 8424”.
Twenty fishes were sampled every 28 days, and were evaluated after fasting for 24 hours. The fish were anesthetized with 2-phenoxyethanol (Mello et al. 2012) and subsequently desensitize with a 20cm stainless steel knife, which was introduced through one of the fish’s opercula at a 30° angle, until reaching the medula, immediately sectioning it. Next, the fish were weighed and submitted to morphologic evaluation.
The standard length was measured using a digital ictiometer and the other measures were done with a digital paquimeter graduated in millimeters (mm).
The morphometric measures (cm) evaluated are illustrated in Figure 1.
Standard length (SL), comprehended between the anterior extremity of the head and the smallest perimeter of the peduncle
(insertion of the caudal fin); head length (HL), comprehended between the anterior extremity of the head and the caudal edge of the operculum; body height (BH) measured in front of the 1st radius of the dorsal fins; body width (BW) taken in the region of the 1st radius of the dorsal fins.
For the data analyses, it was admitted that the error be normally distributed and independent. The hypothesis of residue serial correlation was not tested, because each fish was analyzed a single time, since they were slaughtered and desiccated to perform other studies (Gomieiro et al. 2009).
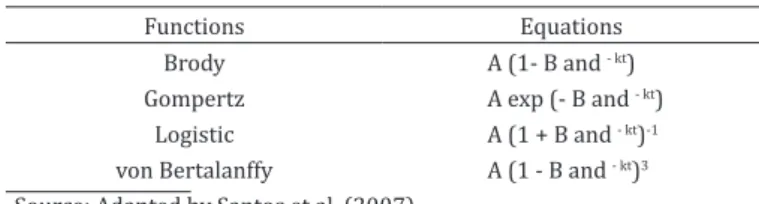
The following non-linear regression models to describe the weight and morphometric measurements by age of fish were tested: Brody, Gompertz, Logistic and von Bertalanffy, which best describes the growth of each genetic group for each evaluated variable (Table 1).
In these models, “A” is the asymptotic value or the maximum value for the dependent variable, however, when this value is not reached, it is represented by the last values measured (Freitas 2007); “B” is the constant of integration and its values do not have a biological interpretation, nevertheless, it is important to shape the sigmoid curve, from the hatching to adulthood, and its sign (positive or negative) indicative of the direction of the curve (Freitas 2005, Gomieiro et al. 2009); “e” is the base of the natural logarithm; “K” is the relative growth rate of the studies variable and its value when the animal reaches maturity, thus, the larger the value of K, the more precocious the animal (Mazzini et al. 2003); “t” is the independent variable, that is, the age of each animal.
To choose the model that best described the growth of the variables during the experimental period, the coefficient of determination and the Akaike criteria (AIC) were used.
The inflection point, which is the point in which the instantaneous absolute growth rate changes from increasing to decreasing, is given by the equation yt/A = m1/(1 - m), which corresponds to yt/A = ½, in the Logistic model.
Subsequently, the parameters of the chosen models and the inflection points were compared by their confidence intervals with the probability of 95%. All the analyses were determined by means of the software R (R Development Core Team 2010).
RESULTS AND DISCUSSION
During the experimental period the dissolved oxygen mean value and standard deviation was of 4.33±0.45mg/L and 6.89±0.16 of pH. The values of dissolved oxygen and pH are inside the range considered adequate for fish cultivation, which vary between 4 and 6mg/L and between 6 and 8, respectively (Ostrensky & Boeger 1998).
The monthly average temperatures during the experimental period are illustrated in Figure 1. A decrease in temperature occurred in the period correspondent to autumn and winter (159 to 271 experimental days), when they vary from 26°C to 21°C. Therefore, during autumn and winter, the
temperature remained below the range considered optimum for the growth, which is between 25°C and 32°C (Cyrino 1987).
In all genetic groups, body weight and the morphometric measures regarding age, adequately adjusted to the tested models for presenting high coefficient of determination (R2>80.00) and lower values for the Akaike (AIC) criterium.
Among the tested models, the Logistic was the one which presented smaller values for AIC and larger values for R2
in all studied variables and genetic groups. Therefore, it was the model best adjusted to the data and, thus, selected for comparing the growth parameters (Garcia et al. 2011, Vergara-Parente et al. 2010).
For the tilapia varieties Chitralada and Supreme, the Gompertz and von Bertalanffy were the models which best describe the morphometric growth regarding body weight (Santos et al. 2007). Moreover, Allaman et al. (2013) observed that the exponential model that best adjusted to assess the growth of body weight in four strains of tilapia. Since the deposition of crude protein, fat and ash in the carcass of this species observed that the model logistic was the best set of data (Allaman et al. 2014). For piracanjuba, the Brody and von Bertalanffy models those which best described the morphometric growth regarding body weight (Gomieiro et al. 2009). This may be due to the fact that the species evaluated in this study (round fish) presented body shape different from piracanjuba and tilapia.
According to the results obtained, the four genetic groups studied presented similar growth behavior for body weight as well as for morphometric measures. The same behavior was observed in tilapia (Santos et al. 2007), and piracanjuba (Gomieiro et al. 2009).
The estimates and the confidence intervals of the parameters of the Logistic models for pacu, paqui, tambacu and tambaqui are presented in Table 2 and 3. Significant differences occurred between the genetic groups regarding parameters A and B for body weight and for all the evaluated morphometric measures. As for the parameter K, there was significant difference between the groups for body weight, head length and body height.
When different species are used and different body shapes are involved, the parameters of the growth models may present more accentuated differences (Santos et al. 2007), which was confirmed in this work, by the difference in the curve parameters between the pacu and the tambaqui and their hybrids.
Analyzing the estimates and the confidence intervals studied (Table 2), it can be verifies that the values of B were positive for all the studied variables.
The tambacu presented the largest asymptotic weight (A) (1244.62 g), followed by the tambaqui (1056.82g), pacu (928.38 g) and lastly the paqui (797.85g). In relation to the maturity index (k), the tambacu (0.0271) presented smaller values then the tambaqui (0.0343), and was similar to the others. Therefore, the tambaqui revealed itself as more precocious then the tambacu, for it reached its point of inflection quickly. This reverse relation among the estimates of asymptotic weight and maturity rate is quite known in literature, showing that animals which present large weight as adults grow at a relatively smaller rate then animals presenting smaller asymptotic weight (Freitas 2005).
Table 1. Non-linear functions used
Functions Equations
Brody A (1- B and - kt)
Gompertz A exp (- B and - kt)
Logistic A (1 + B and - kt)-1
von Bertalanffy A (1 - B and - kt)3
Table 2. Estimates of the parameters A, B and K and their respective confidence intervals based on the Logistic model, for the
variables body weight, standard length, head length, body height and body width of the genetic groups Pacu, Paqui, Tambacu and Tambaqui
Genetic
groups Variables
Parameters
A CI B CI K CI
Pacu
Weight
928.38c (896.62-960.15) 18.01ab (12.70-23.32) 0.0283ab (0.0251-0.0315)
Paqui 797.82d (772.85-822.79) 14.85b (9.86-19.84) 0.0335ab (0.0291-0.0379)
Tambacu 1243.62ª (1211.32-1275.91) 15.00b (11.97-18.04) 0.0271b (0.0248-0.0294)
Tambaqui 1056.82b (1029.54-1056.82) 29.57a (19.87-39.27) 0.0343a (0.0308-0.0379)
Pacu
SL
27.96c (27.41-28.43) 1.53bc (1.45-1.60) 0.0165a (0.0154-0.0177)
Paqui 27.63c (27.13-28.13) 1.51c (1.44-1.59) 0.0159a (0.0148-0.0171)
Tambacu 31.50ª (31.01-31.99) 1.55b (1.48-1.62) 0.0163a (0.0154-0.0173)
Tambaqui 30.47b (30.02-30.92) 1.87a (1.78-1.95) 0.0178a (0.0168-0.0188)
Pacu
HL
6.93d (6.81-7.06) 0.92c (0.85-0.99) 0.0193b (0.0170-0.0215)
Paqui 8.17c (8.02-8.32) 1.12b (1.05-1.19) 0.0166b (0.0150-0.0182)
Tambacu 8.68b (8.58-8.78) 1.16b (1.09-1.23) 0.0245a (0.0225-0.0264)
Tambaqui 9.69a (9.56-9.83) 1.44a (1.37-1.52) 0.0190b (0.0177-0.0203)
Pacu
BH
14.22c (13.90-14.54) 1.51b (1.41-1.61) 0.0164ab (0.0149-0.0180)
Paqui 14.36c (14.05-14.68) 1.34b (1.25-1.43) 0.0164ab (0.0148-0.0180)
Tambacu 16.41a (16.08-16.74) 1.38b (1.30-1.46) 0.0160b (0.0146-0.0173)
Tambaqui 15.35b (15.08-15.62) 1.86a (1.74-1.97) 0.0194a (0.0179-0.0208)
Pacu
BW
4.35a (4.22-4.49) 2.13a (1.92-2.33) 0.0179a (0.0159-0.0199)
Paqui 3.82c (3.70-3.94) 1.69b (1.51-1.87) 0.0186a (0.0160-0.0211)
Tambacu 4.07bc (3.94-4.19) 1.38b (1.24-1.52) 0.0175a (0.0150-0.0200)
Tambaqui 4.10b (3.99-4.21) 2.11a (1.89-2.33) 0.0210a (0.0186-0.0234)
CI = confidence intervals, SL = standard length, HL = head length, BH = body height, BW = body width. Different lowercase letters in the column differ from each other by not overlapping the confidence interval with probability of 95%.
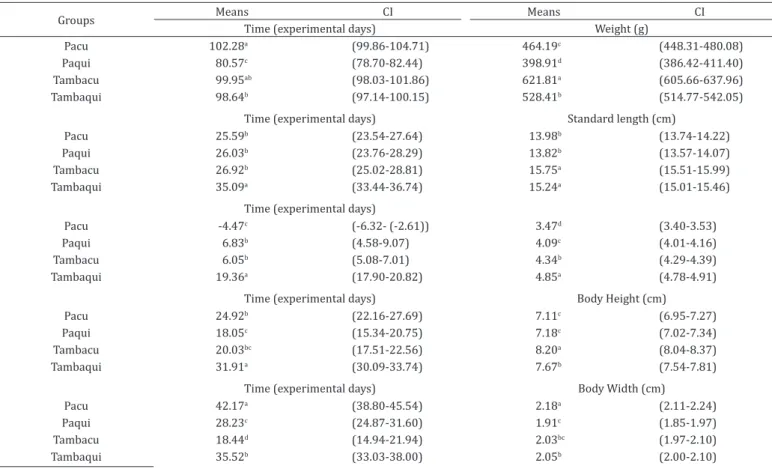
Table 3. Average cultivating time in which each genetic group (pacu, paqui, tambacu e tambaqui) reached the point of
inflection and their respective confidence interval for body weight, standard length, head length, body height and body width
Groups Means CI Means CI
Time (experimental days) Weight (g)
Pacu 102.28a (99.86-104.71) 464.19c (448.31-480.08)
Paqui 80.57c (78.70-82.44) 398.91d (386.42-411.40)
Tambacu 99.95ab (98.03-101.86) 621.81a (605.66-637.96)
Tambaqui 98.64b (97.14-100.15) 528.41b (514.77-542.05)
Time (experimental days) Standard length (cm)
Pacu 25.59b (23.54-27.64) 13.98b (13.74-14.22)
Paqui 26.03b (23.76-28.29) 13.82b (13.57-14.07)
Tambacu 26.92b (25.02-28.81) 15.75a (15.51-15.99)
Tambaqui 35.09a (33.44-36.74) 15.24a (15.01-15.46)
Time (experimental days)
Pacu -4.47c (-6.32- (-2.61)) 3.47d (3.40-3.53)
Paqui 6.83b (4.58-9.07) 4.09c (4.01-4.16)
Tambacu 6.05b (5.08-7.01) 4.34b (4.29-4.39)
Tambaqui 19.36a (17.90-20.82) 4.85a (4.78-4.91)
Time (experimental days) Body Height (cm)
Pacu 24.92b (22.16-27.69) 7.11c (6.95-7.27)
Paqui 18.05c (15.34-20.75) 7.18c (7.02-7.34)
Tambacu 20.03bc (17.51-22.56) 8.20a (8.04-8.37)
Tambaqui 31.91a (30.09-33.74) 7.67b (7.54-7.81)
Time (experimental days) Body Width (cm)
Pacu 42.17a (38.80-45.54) 2.18a (2.11-2.24)
Paqui 28.23c (24.87-31.60) 1.91c (1.85-1.97)
Tambacu 18.44d (14.94-21.94) 2.03bc (1.97-2.10)
Tambaqui 35.52b (33.03-38.00) 2.05b (2.00-2.10)
The evaluated genetic groups presented asymptotic weight below the adult weight during the evaluated period, which occurs around the third year of life of this species. This may be explained by the fact that the fish have been evaluated only until one year and seven months of life (571 days).
As may be observed in Figure 2, the decrease in temperature to 24.6°C and 21°C in the last seventy days may have affected the body weight growth of all the genetic groups. The estimate of asymptotic weight for all genetic groups maybe should have been superior to that found if the temperature remained between 26°C and 29°C (Fig. 3).
Various works performed with pacu in the South, Southeast and Center-West regions of Brazil have indicated a relation between growth and temperature, with decrease in growth speed during autumn and winter (Ferrari et al. 1990, Angelini et al. 1992, Borghetti & Canzi 1993). The role of temperature in feeding and growth regulation is known in fish. It is known that most fish feed more and the growth rates tend to be higher during spring.
Veras et al. (2013), working with Nile tilapias, also reported the influence of the photo period over length and weight gain, with the period of 18 light superior for length gain and the periods of 18 Light and 24 light better for weight gain. According
to the author’s discussion, the growth of the fish submitted to long periods of light may be due to the development of muscular mass because of the larger locomotive activity of these animals (Boeuf & Bail 1999) or because of the release of growth hormone under continuous periods of light, which presents a positive effect on appetite, which increases with longer periods of light (Mccormick et al. 1995), among others. This reinforces the importance of light hours in the growth and development of the animals.
Moreover, Navarro et al. (2014) found that a photoperiod of 24 hours of light decreased the growth rate of female lambari (Astyanax bimaculatus) regarding processing where the fish were exposed to a period of dark, thereby demonstrating the need for such species remain for some time without lighting.
It was observed for the morphometric measures standard length and body height, that the tambacu presented the largest values of A (31, 50 and 16.41cm, respectively, followed by the tambaqui (30.47 and 15.35cm, respectively) and lastly the pacu and paqui which did not differ among each other. In regard to head length, the tambaqui presented the largest values for A (9.69cm), and the pacu (6.93cm) the smallest, and the hybrids with intermediate values, with the tambacu (8.68 cm) obtaining a larger value then the paqui (8.17cm). As for body width, the pacu (4.35cm) was the genetic group which presented the largest asymptotic value, and the paqui (3.82cm) the smallest, the last did dot differ from the tambacu (4.07cm).
Working with round fish (pacu and tambaqui), Reis Neto et al. (2012) demonstrated the efficiency of the use of morphometry as well as its reasons for the determination of weight and body yield, with HL and BH as important measures for the determination of the weight; the HL/BH ratio, variable most directly associated to carcass yield; and BW/HL ratio, variable most appropriate to measure filet, filet and ribs and rib yield.
In regard to the k parameter estimates of the morphometric measures, it was observed that the tambacu (0.0245) presented larger values for head length, and the other groups did not differ among each other. As for body height, it was observed that the tambaqui (0.0194) presented larger values of K and the tambacu (0.0160), the smallest. Therefore, the tambaqui turned out to be the most precocious for body height and the latest for head length along with the pacu and the paqui.
Fig.3. (A) Average monthly temperature and weight estimated by the Logistic model for each genetic group during the cultivating period. (B) Average duration of the day and weight estimated by the Logistic model for each genetic group durint the cultivating period. Fig.2. Average temperature and average day duration regarding
The decrease of temperature in the last seventy experimental days also could be affected the growth of all the studies morphometric measures (Fig.4 and 5). Thus, the values should have been larger if the temperature had not decreased.
The evaluated morphometric measures presented smaller K values then body weight (Table 3) therefore the morphometric measures reached the inflection point more precociously then the body weight. This increment in weight may be occurring
with the increase of one or more measures which were not evaluated in this paper.
In evaluating the age in which the groups reached the inflection point, it was observed that the paqui generally reaches this point for weight and all evaluated morphologic measures in an inferior age then the other groups. The tambaqui also reached this inflection point for body weight and for the morphometric measures SL, HL and BH and the pacu for BW, at a more advanced age. The tambacu reached the inflection
Fig.5. Logistic model for each genetic group during the cultivation period. (A) Average body height and monthly temperature. (B) Body height and monthly day duration. (C) Body width and monthly temperature. (D) Body width and monthly day duration.
point with larger body weight and BH then the other groups (Table 3).
As expected, due to the species’ body characteristics, the pacu presented larger LC when reaching the inflection point and, also reached this point for head length before the experimental period, for the time, in days, is negative (Table 3).
The determination of the inflection point is important in animal production, for with it, feeding programs may be defined as well as the best age for slaughter (Lopes et al. 2011, Souza et al. 2011).
CONCLUSIONS
There was difference in weight and morphometric growth between the studied genetic groups, and the decrease in temperature possibly affected the growth.
Paqui reached the inflection point in an age inferior than the other groups, however with inferior body weight. The tambacu had larger body weight when reaching the inflection point.
Due to the results and according to the interest of processing industries, the highlighted genetic group is the tambacu.
Acknowledgements.- Funding was provided by FAPEMIG, CAPES and CNPq.
REFERENCES
Allaman I.B., Reis Neto R.V., Freitas R.T.F., Freato T.A., Lago A.A., Costa A.C. & Lima R.R. 2013. Weight and morphometric growth of different strains of tilapia (Oreochromis sp.). Revta Bras. Zootec. 42(5):305-311. http:// dx.doi.org/10.1590/S1516-35982013000500001.
Allaman I.B., Reis Neto R.V., Freitas R.T.F., Rosa P.V., Lago A.A. & Costa A.C. 2014. Deposition of bodily chemical components in the carcass of tilapia (Oreochromis sp.) strains. Ciênc. Agrotecnol. 38(5):487-496. http://dx.doi. org/10.1590/S1413-70542014000500008.
Andrade D.R. & Yasui G.S.O. 2003. Natural and artificial breeding management and its importance in fish production in Brazil. Revta Bras. Reprod. Anim. 27:166-172.
Angelini R., Cantelmo O.A. & Petrere Júnior M. 1992. Determinação da taxa de consumo de ração pelo pacu Piaractus mesopotamicus Holmberg, 1887, com diferentes tamanhos e sob distintas temperaturas. Bolm Tecnico CEPTA 5:11-22.
Boeuf G. & Le Bail P.-Y. 1999. Does light have na influence on fish growth? Aquacult. J. 177(1):129-152. http://dx.doi.org/10.1016/S0044-8486(99)00074-5. Borghetti J.R. & Canzi C. 1993. The effect of water temperature and feeding rate on the growth rate of pacu (Piaractus mesopotamicus) raised in cages. Aquaculture 114(1/2):93-101. http://dx.doi.org/10.1016/0044-8486(93)90253-U.
Cyrino J.E.P. 1987. Curso de Atualização em Piscicultura. Fundação de Estudos Agrários “Luiz de Queiroz”, Piracicaba, SP.
Ferrari V.A., Lucas A.F.B. & Gaspar L.A. 1990. Monocultura de pacu Piaractus
mesopotamicus Holmberg, 1887, em condições de viveiro-estufa. Bolm
Tecnico CEPTA 3:33-42.
Freitas A.R. 2005. Growth curves in animal production. Braz. J. Anim. Sci. 34:786-795.
Freitas A.R. 2007. Estimativas de curvas de crescimento na produção animal. Embrapa Pecuária Sudeste, São Carlos, SP.
Garcia F., Santos V.B. & Moraes F.R. 2011. Efficiency of feed supplementation for nile tilapia using exponential growth model. Arch. Zootec. 60:1239-1246. Gomieiro J.S.G., Freitas R.T.F., Santos V.B., Silva F.F., Rodrigues P.B. & Logato P.V.R. 2009. Morphometric growth curves of piracanjuba (Brycon
orbignyanus). Ciênc. Agrotecnol. 33:882-889. http://dx.doi.org/10.1590/
S1413-70542009000300031.
Huang C.M. & Liao I.C. 1990. Response to mass selection for growth rate
in Oreochromis niloticus. Aquaculture 85(1-4):199-205. http://dx.doi.
org/10.1016/0044-8486(90)90019-J.
Lopes F.B., Silva M.C., Marques E.G. & Ferreira J.L. 2011. Fitting of growth curves of Nellore cattle from Northern Brazil. Revta Bras. Saúde. Prod. Anim. 12:607-617.
Mazzini A.R., Muniz J.A., Aquino L.H. & Silva F.F. 2003. Growth curve analysis for Hereford cattle males. Ciênc. Agrotecnol. 27:1105-1112. http://dx.doi. org/10.1590/S1413-70542003000500019.
McCormick S.D., Björnsson B.T., Sheridan M., Eilerlson C., Carey J.B. & O’Dea M. 1995. Increased daylength stimulates plasma growth hormone and gill Na+, K+-ATPase in Atlantic salmon (Salmo salar). J. Comp. Physiol. B 165(4):245-254. http://dx.doi.org/10.1007/BF00367308.
Mello R.A., Costa L.S., Okamura D., Araújo F.G., Ribeiro P.A.P. & Corrêa F.M. 2012. Evaluation of 2-phenoxyethanol and menthol as anaesthetic agent in tilapia. Bull. Fish Int. 1:53-59.
Navarro R.D., Navarro F.K.S.P., Felizardo V.O., Murgas L.D.S. & Pereira M.M. 2014. Cryopreservation of semen of Thailand tilapia (Oreochromis spp.) fed diet with different oil sources. Acta Sci. Technol. 36(3):399-404. http:// dx.doi.org/10.4025/actascitechnol.v36i3.20076.
Ostrenskv A. & Boeger W.A. 1998. Piscicultura: fundamentos e técnicas de manejo. Guaíba: Agropecuária. 211p.
R Development Core Team 2010. R: a language and environment for statistical computing. R Foundation for Statistical Computing, Vienna.
Reis Neto R.V., Freitas R.T.F., Serafini M.A., Costa A.C., Freato T.A., Rosa P.V. & Allaman I.B. 2012. Interrelationships between morphometric variables and rounded fish body yields evaluated by path analysis. Braz. J. Anim. Sci. 41:1576-1582.
Santos V.B., Freitas R.T.F., Silva F.F. & Freato T.A. 2007. Evaluation of morhometric growth curves of tilapia of Nilo (Oreochromis niloticus) strains. Ciênc. Agrotecnol. 31(5):1486-1492. http://dx.doi.org/10.1590/ S1413-70542007000500032.
Saracura V.F. & Castagnolli N. 1990. Comparação do desempenho entre alevinos de Pacu (Piaractus mesopotamicus) e híbridos de Pacu e Tambaqui
(Colosoma macropomum). Ciênc. Zootecnica 5:17-19.
Signor A.A., Boscolo W.R., Bittencourt F., Feiden A., Gonçalves G.S. & Freitas J.M.A. 2010. Desempenho de juvenis de tilápia-do-nilo alimentados com rações contendo complexo enzimático. Revta Bras. Zootec. 39(5):977-983. http://dx.doi.org/10.1590/S1516-35982010000500006.
Souza L.A., Carneiro P.L.S., Malhado C.H.M., Paiva S.R., Caires D.N. & Barreto D.L.F. 2011. Growth curves in morada nova sheep raised in the state of Bahia. Braz. J. Anim. Sci. 40:1700-1705.
Veras G.C., Murgas L.D.S., Zangeronimo M.G., Oliveira M.M., Rosa P.V. & Felizardo V.O. 2013. Ritmos biológicos e fotoperíodo em peixes biological rhythms and photoperiod in fish. Arch. Zootec. 62(1):25-43.