Planting density and yield of cassava roots
1Densidade de plantio e rendimento de raízes de mandioca
Tiago Santos Silva2, Paulo Sérgio Lima e Silva3*, Jéfferson Dantas Braga3, Lindomar Maria da Silveira2 e
Roberto Pequeno de Sousa2
ABSTRACT - In Mata Fresca, an area located on the border of the states of Rio Grande do Norte and Ceará, in Brazil,
small farmers have a source of income from the production of cassava roots, using planting densities of around 5,000 plants ha-1. This procedure might be helping to limit higher yields of the roots, since some studies have shown that it is possible to obtain higher yields of cassava using higher densities. The objective of this study was to evaluate the root yield and other characteristics of the cassava, as a response to planting density. The Vermelhinha cultivar was submitted to planting densities of from 5,000 to 21,000 plants ha-1, at intervals of 2,000 plants ha-1, in an experiment under irrigation. A completely randomized block design with four replications was used. The ideal planting densities in order to maximise leaf green matter, stems and branches, total roots, total marketable roots, number of marketable roots, marketable-root dry matter and stem dry matter, were 17,800; 17,077; 14,416; 13,594; 16,436; 12,361; and 18,149 plants ha-1 respectively. When adopting the planting density used by the farmers, a yield for marketable roots of 15,837 kg ha-1 was obtained. By using the optimal density as found in this work (13,594 plants ha-1), the yield was more than double that of the farmers. Increasing planting density reduced both the length of the marketable roots and the harvest index (the ratio of marketable-root dry matter to total plant dry matter).
Key words: Manihot esculenta. Spacing. Plant populations.
RESUMO - Na Mata Fresca, área situada na divisa dos Estados do Rio Grande do Norte e Ceará, pequenos agricultores têm como
fonte de renda a obtida com a produção de raízes de mandioca, usando densidades de plantio em torno de 5.000 plantas ha-1. Esse procedimento pode estar limitando a obtenção de maiores rendimentos de raízes, pois alguns trabalhos demonstraram que é possível a obtenção de rendimentos maiores da mandioca, com maiores densidades. O objetivo do trabalho foi avaliar o rendimento de raízes e outras características da mandioca em resposta à densidade de plantio. A cultivar Vermelhinha foi submetida às densidades de plantio de 5.000 a 21.000 plantas ha-1, com intervalos de 2.000 plantas ha-1, em experimento irrigado. Utilizou-se o delineamento de blocos completos casualizados com quatro repetições. As densidades de plantios ideais para maximizar a obtenção de matérias frescas de folhas, caule + ramos, total de raízes, de raízes comercializáveis, número de raízes comercializáveis, e de matérias secas de raízes comercializáveis e da parte aérea foram de 17.800; 17.077; 14.416; 13.594; 16.436; 12.361 e 18.149 plantas ha-1, respectivamente. Com a adoção da densidade de plantio usada pelos agricultores, obtiveram-se 15.837 kg ha-1 de raízes comercializáveis. Com o uso da densidade ideal encontrada no presente trabalho (13.594 plantas ha-1), o rendimento foi mais do dobro do rendimento do agricultor. O aumento da densidade de plantio reduziu o comprimento das raízes comercializáveis e o índice de colheita (relação entre a matéria seca das raízes comercializáveis e a matéria seca total da planta).
Palavras-chave: Manihot esculenta. Plantas-populações. Plantas-espaçamento.
*Autor para correspondência
1Recebido para publicação em 21/10/2010; aprovado em 11/09/2012
Part of the graduation dissertation of the first author
2Departamento de Fitotecnia, Universidade Federal Rural do Semi-Árido/UFERSA, Caixa Postal 137, Mossoró-RN, Brasil, 59.600-970,
[email protected], [email protected], [email protected]
3Departamento de Fitotecnia/UFERSA, Caixa Postal 137, Mossoró-RN, Brasil, 59.600-970, [email protected], eng.jefferson@uol.
INTRODUCTION
The cassava (Manihot esculenta Crantz) is the crop that produces a higher energy quantity, followed by corn, rice cocoyam, sorghum and potato (ROJAS et al., 2007). It is the major staple starch of the people in most parts of the tropics (AYOOLA; MAKINDE, 2007).
In the so-called Mata Fresca region, an area located on the border between the states of Rio Grande do Norte and Ceará, Brazil, the main source of income for small growers is obtained from the exploitation of cassava, whose roots are sold commercially. The production system has the following characteristics, among others: monocrops of cassava under drip irrigation, no fertilization, at planting densities around 5,000 plants ha-1 (2.0 m × 1.0 m). The
adoption of such low planting density may limit higher yields, since it is possible to obtain higher cassava yields at higher planting densities in monocropping (GUERRA et al., 2003; ROJAS et al., 2007) and intercropping (AYOOLA; MAKINDE, 2008).
Planting density probably influences all crop traits. In cassava, the distance between plant rows has influenced plant height, stem and canopy diameter, number of leaves, and root yield (ROJAS et al., 2007). The distance between plants on the row has influenced all traits previously mentioned, except plant height and stem diameter (ROJAS et al., 2007). In addition, planting density maintains a relation with other components of the crop’s production system, including cultivars, water, and applied nutrients, competition with weeds, and incidence of diseases and pests (AYOOLA; MAKINDE, 2007; LÓPEZ-BELLIDO et al., 2005; OPARA-NADI; LAL, 2006).
Due to the importance of planting density, several studies have been conducted with cassava, at planting densities that ranged from 6,666 plants ha-1 (ROJAS et al., 2007)
to 27,777 plants ha-1 (GUERRA et al., 2003). Larger
populations (of up to 50,000 plants ha-1) have been tested
to determine their effects on the above-ground part of the plant (LIMA et al., 2002). Densities to evaluate their effects on root yield were obtained both by varying of the spacing between plants and keeping the spacing between rows constant or by varying of the spacing between rows and between plants. Studies (GUERRA et al., 2003; ROJAS et al., 2007) have demonstrated that the planting density effect on root yield varies with cultivar. In other words, an increased planting density may increases, reduces, or maintains cassava root yield, depending on the cultivar that is evaluated.
The objective of this study was to evaluate root yield and other cassava traits as a response to increased planting density.
MATERIAL AND METHODS
The experiment was carried out at Martins Ranch, (-4o 50’ 41’’ South and -37o 26’ 52’’ West), located in
the city of Aracati-CE, Brazil, during the period from February/2009 to January/2010. The ranch is located in the Mata Fresca region, an area that lies on the border between the states of Rio Grande do Norte and Ceará, by the BR 304 Road. According to Gaussen’s bioclimatic classification, the climate in the region is classified as type 4ath, or distinctly xerothermic, which means tropical hot with a pronounced, long dry season, lasting from seven to eight months and with a xerothermic index between 150 and 200. The mean minimum temperature in the region is 32.1 °C and the maximum is 34.5 °C, with June and July as the coolest months, while the mean annual precipitation is around 825 mm (CARMO FILHO; OLIVEIRA, 1989). Insolation increases from March to October, with a mean of 241.7 h; the maximum relative humidity reaches 78% in April while the minimum is 60% in September. The soil in the area was classified as a Red-Yellow Argisol, according to the Brazilian Soil Classification System (EMPRESA BRASILEIRA DE PESQUISA AGROPECUÁRIA, 1999a). The analysis of a soil sample from the experiment area, conducted according to recommendations by Empresa Brasileira de Pesquisa Agropecuária (1999b), gave the following results: pH = 6.60; P = 139.0 mg dm–3; K+ = 101.0 mg dm–3; Ca2+ = 2.10 cmol cdm –3; Mg2+ = 0.90 cmol cdm –3; Al3+
= 0.00 cmolcdm –3; Na+= 5.6 mg dm –3, textural class
corresponding to sand. The soil was tilled with a tractor, with two cross harrowings. The crop received between 1,200 and 1,500 mm water, applied by drip irrigation during three hours, on alternate days.
The planting material was produced at the ranch and was arranged horizontally in the planting furrows at a 0.10 m depth. Stem cuttings (manivas) were 0.15 m in length with five viable buds each, apparently in satisfactory health conditions. Vermelhinha Cultivar, a traditional variety widely grown in the region, was submitted to the following spacing between plant rows: 2.0 m (with spacing between plants of 1.0 m; 0.71 m; 0.55 m; and 0.45 m); 1.5 m (with spacing between plants of 0.51 m and 0.44 m), and 1.0 m (with spacing between plants of 0.58 m; 0.52 m; and 0.47 m). Those spacing combinations provided nine planting densities, varying from 5,000 plants ha-1 (planting
density used by farmers in the region) to 21,000 plants ha-1,
at intervals of 2,000 plants ha-1.
Each plot consisted of four 6.0 m-long rows. The area employed to evaluate traits (usable area) was considered as the area occupied by the plants in the two central rows, with the elimination of plants from one pit at each end. A completely randomized block design with
four replicates was used. Plant height was evaluated monthly during six months, by measuring the distance from ground level to the plant’s apex in all plants in the usable area. A randomized block design with split-plots (planting densities in plots) was adopted for the statistical analysis of plant height data.
The following traits were evaluated during harvest: height at first branching, stem diameter, mean number of roots, mean root diameter and length, total and marketable root yields, dry weight of leaves, stems + branches, and roots. Height at first branching and stem diameter were measured in all usable plants of the plot. Stem diameter was estimated from the average between two perpendicular measurements taken at 0.1 m above the ground with a digital caliper rule. Mean root diameter and length were evaluated in ten marketable roots obtained at random from the production of each plot. Total root yield corresponded to the weight of all roots produced in the usable area of each plot. Marketable root yield was obtained based on total root yield, disregarding very small roots or roots with significant deformations, selected by the grower himself. Two plants from the usable area of each plot were used to estimate leaf biomass and stems + branches biomass. The above-ground part was above-ground in a forage mill and a sample of approximately 500 g was placed in a forced air circulation oven adjusted to 75 °C until constant weight. In order to estimate root dry weight, “disks” around 0.05 m thick were obtained from the middle part and from the proximal and distal ends of five roots in each plot. The disks were placed in an oven, in a similar procedure as the one used to estimate dry biomass of the above-ground part. The harvest index was obtained by dividing dry matter weight of marketable roots by the plant’s total dry matter weight.
The data for the traits under evaluation were submitted to analysis of variance and regression analysis. The analysis of variance was carried out using software developed by Federal University of Viçosa (RIBEIRO JÚNIOR, 2001). The regression analysis was conducted with software created by Jandel (1992). The regression equations were selected based on the following criteria: biological explanation of the phenomenon, simplicity of the equation, and significant effect of equation parameters by Student’s t test at 5% significant level.
RESULTS AND DISCUSSION
The spacing variation between rows (BR) and between plants on the same row (BP) provided different plant arrangements, but no effect of the BR × BP interaction on cassava root yield was observed (ROJAS et al., 2007). Such fact, together with the existence of BR and BP effects (ROJAS et al., 2007) suggest that the number of plants
per unit area is more relevant than their distribution in the field. Whilst changes in planting density have usually produced a clear effect on cassava root yield, the crop appears to react much less to changes in planting pattern. The available information suggests that cassava is a rather flexible crop, keeping the same yield level, even when the strictly square arrangement is replaced by a variety of rectangular configurations (LEIHNER, 2002).
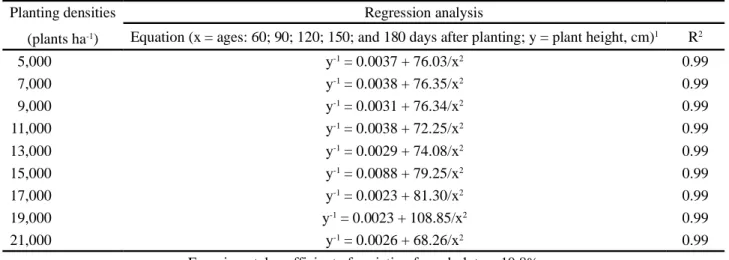
With respect to plant height, the analysis of variance (mean squares for blocks, densities, residue (a), measuring seasons, interaction, and residue (b) with values of 312; 1418; 804; 166.708; 217; and 109, respectively) indicated effects of measuring seasons (E) and of the planting densities x measuring seasons interaction at 1% probability, by the F test. The regression analysis also indicated a planting density effect, but that only occurred during the latest measuring season, i.e., at 180 days after planting (Table 1). In the initial seasons, increased planting densities did not influence plant height. Supporting this observation, Rojas et al. (2007) verified that for three spacing between rows (1.5 m, 2.0 m, and 3.0 m), plant height was only influenced from 90 days after planting, at the 1.5 m spacing. The discrepancies between the results of those authors and those observed in this study are due to genotypic (cultivars) and environmental differences (climate, soil, and planting densities tested). The equations adjusted for seasons, in each planting density, although having the same type of curve (y-1 = a + b/x2), showed
different coefficients (Table 2).
Planting density did not have an effect on root collar diameter, but influenced height at first branching and leaf and stems + branches green matter (Table 3). Increased planting densities increased height at first branching and leaf and stems + branches green matter. Those specific green matter yield values increased up to densities of 17,800 and 17,077 plants ha-1, respectively,
decreasing at higher densities (Table 4).
Planting density had an effect on total roots green matter yield and on green matter yield, number of roots, and marketable roots length, but did not influence the diameter of those roots (Table 5). Total root green matter (for both marketable and non-marketable roots), non-marketable roots green matter, and number of marketable roots increased as planting density increased, but decreased again after a certain density (Table 6). Reductions occurred above densities of 14,416; 13,594; and 16,436, respectively (Table 6). The planting density effect on root length was negative (Table 6). In other words, the mean marketable roots length decreased from the smallest to the highest planting density evaluated. It is interesting to point out that, by the fitted equation, it would be possible to obtain 15,837 kg ha-1 of marketable roots using the
1Parameters significant at 5% level by the t test
Table 1 - Plant height for cassava cv. Vermelhinha, as a function of planting density, at six ages
Table 2 - Plant height for cassava, cv. Vermelhinha, submitted to different planting densities, as a function of age
1Parameters significant at 5% level by the t test
Table 3 - Analysis of variance summary for root collar diameter, height at first branching, leaf green matter, and stems + branches green
matter in cassava, cv. Vermelhinha, submitted to different planting densities
Sources of variation Degrees of freedom
Mean squares
Root collar Height at first Leaf green Stems + branches
diameter branching matter green matter
Blocks 3 11.0 582.8 4,882,373.2 37,470,901.4
Planting densities 8 7.6ns 204.9* 55,234,715.9* 340,129,776.2*
Residue 24 8.5 45.4 3,812,877.0 38,535,657.8
ns, *Non-significant and significant at 1% level, by the F test, respectively
Planting densities (plants ha-1)
Ages (days after planting)
30 60 90 120 150 180 cm 5,000 13.5 41.3 72.9 115.4 142.9 162.8 7,000 11.1 38.0 71.3 115.5 139.6 161.8 9,000 10.7 37.4 73.9 125.1 154.7 180.8 11,000 11.5 39.7 78.6 127.9 157.6 184.1 13,000 12.3 38.8 76.6 129.8 162.3 189.5 15,000 10.7 36.6 73.7 127.1 158.0 189.9 17,000 12.2 36.4 72.9 131.7 170.4 205.9 19,000 12.2 29.9 54.9 103.6 140.9 175.8 21,000 12.2 41.5 84.9 140.3 176.9 207.2
Experimental coefficient of variation for plots = 29.3%
Equation (x = density)1 y = 11.8 y = 37.7 y = 73.3 y = 124.0 y = 155.9 y = 235.39 - 171.54/x0.5
R2 - - - - - 0.99
Planting densities (plants ha-1)
Regression analysis
Equation (x = ages: 60; 90; 120; 150; and 180 days after planting; y = plant height, cm)1 R2
5,000 y-1 = 0.0037 + 76.03/x2 0.99 7,000 y-1 = 0.0038 + 76.35/x2 0.99 9,000 y-1 = 0.0031 + 76.34/x2 0.99 11,000 y-1 = 0.0038 + 72.25/x2 0.99 13,000 y-1 = 0.0029 + 74.08/x2 0.99 15,000 y-1 = 0.0088 + 79.25/x2 0.99 17,000 y-1 = 0.0023 + 81.30/x2 0.99 19,000 y-1 = 0.0023 + 108.85/x2 0.99 21,000 y-1 = 0.0026 + 68.26/x2 0.99
Table 4 - Mean values for cassava traits,cv. Vermelhinha, submitted to different planting densities1 Planting density
(plants ha-1)
Root collar Height at Green matter (kg ha-1)
diameter (mm) first branching Leaves Stems + branches
5,000 29.2 74 4,213 7,500 7,000 28.9 63 6,020 11,393 9,000 28.9 76 7,380 16,425 11,000 28.2 80 8,883 16,638 13,000 29.3 75 12,448 26,065 15,000 28.4 84 12,750 28,050 17,000 30.0 77 14,677 33,943 19,000 25.2 71 12,873 31,493 21,000 27.8 88 13,160 25,480 CV2(%) 10.3 8.8 19.0 28.4 Equation (x = density)1 y = 28.4 y = 51.26 + 0.23 x0.5 y = 0.000002 + 0.0132x - 0.00000037x2 y1 = 0.0005 + 0.000000028x -0.0000073x0.5 R2 - 0.61 0.96 0.96
Ideal density (plants ha-1) - - 17,800 17,077
1Parameters significant at 5% level by the t test. Ideal density = density at which maximum yield is obtained;2Experimental coefficient of variation
planting density adopted by growers (5,000 plants ha-1).
On the other hand, according to the same equation, by adopting the ideal density (that provided maximum yield) it would be possible to obtain 32,259 kg ha-1 of
marketable roots. This yield is a little higher than twice the yield obtained by growers.
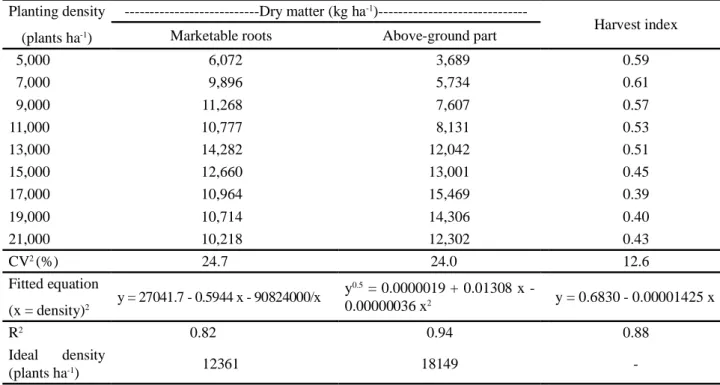
Planting density had an effect on marketable roots dry matter, dry matter of the above-ground part (stems + branches + leaves), and harvest index (Table 7). Increased planting densities provided increases in marketable root dry matter and dry matter of the above-ground part (stems + branches + leaves) (Table 8). Maximum dry matter values would be reached at densities of 12,361 and 18,149 plants ha-1, respectively (Table 8). Harvest
index, i.e., the ratio between marketable root dry matter
Table 5 - Analysis of variance summary for total roots green matter yield, green matter yield of the number of roots, marketable roots
length and diameter in cassava, cv. Vermelhinha, submitted to different planting densities
ns, *, **Non-significant and significant at 5% and 1% level, by the F test, respectively
Sources of variation Degrees of freedom
Quadrados médios
Total roots green matter Raízes comercializáveis
Green matter Number Length Diameter
Blocks 3 74,692,844.3 56,569,545.7 92,569,430.2 17.4 0.23
Planting densities 8 172,114,828.1** 124,387,635.2* 338,718,660.3** 39.7* 0.13ns
Residue 24 44,253,287.7 47,338,901.3 56,839,563.8 15.0 0.16
and the plant’s total dry matter decreased as planting density increased (Table 8).
The means for the agronomically more important traits evaluated in this study (green matter of leaves, stems + branches, total roots, marketable roots, number of marketable roots, and dry matter of marketable roots and the above-ground part) increased as planting density increased, up to a certain density (17,800; 17,077; 14,416; 13,594; 16,436; 12,361; and 18,149 plants ha-1, respectively), after which the
values started to decrease. This type of behavior is usually found in crops in general. At lower planting densities, there is a surplus of production factors (water, nutrients, and light), with a tendency for increased yields of roots, stems, and leaves. As planting densities increase, competition for those factors increases and, beyond a certain density, which varies with the trait being evaluated, yield values decrease.
Table 6 - Means for traits of cassava, cv. Vermelhinha, submitted to different planting densities1
Planting
densities Total roots green Marketable roots ha
-1 Marketable roots (cm)
(plants ha-1) matter (kg ha-1) Green matter (kg) Number Length Diameter
5,000 18,388 16,088 19,625 38.3 6.10 7,000 27,130 25,356 24,769 38.6 6.09 9,000 30,515 28,303 31,675 37.8 6.01 11,000 31,474 27,874 31,904 36.2 6.24 13,000 40,162 36,051 41,863 37.7 6.29 15,000 38,893 33,243 48,054 34.3 6.23 17,000 36,263 30,767 43,590 33.6 5.87 19,000 32,665 28,489 38,535 30.8 5.82 21,000 32,136 28,075 37,144 30.6 5.84 CV2 (%) 20.8 24.4 21.4 11.0 6.7 Fitted equation (x = density) y-1 = 0.0002 + 0.0000000102x -0.0000024x0.5 y = 51256.8 - 0.000034x2 -172850000/x y = 12157.1 + 0.00036x2 -0.000000015x3 y2 = 1537.5 -0.0000014x2 y = 6.05 R2 0.91 0.87 0.92 0.93 -Ideal density (plants ha-1) 14,416 13,594 16,436 -
-1Parameters significant at 5% level by the t test. Ideal density = density at which maximum yield values are obtained;2Experimental coefficient of variation
Table 7 - Analysis of variance summary for dry matter yield of marketable roots and the above-ground part, and harvest index of
cassava, cv. Vermelhinha, submitted to different planting densities
*, **Significant at 5% and 1% level by the F test, respectively
Sources of variation Degrees of freedom Mean squares
Marketable roots dry matter Dry matter of the above-ground part Harvest index
Blocks 3 8,012,395.6 5,873,357.1 0.0068
Planting densities 8 19,665,839.7* 66,799,380.6** 0.0242**
Residue 24 168,968,768.5 6,044,666.8 0.0039
Above the soil surface, the competition between plants occurs for light and space. Higher plant densities would result in mutual shading, with reductions in photosynthesis rates, which would in turn result in smaller plant growth. However, other factors are involved. In order to compete successfully, plants exploit a range of phenotypic plastic responses that help them increase the “capture” of resources, thus increasing their adaptation during competition (VIOLLE et al., 2009). These plastic responses comprise strategies that help prevent competitive interactions with neighboring plants, as well as strategies that inhibit the performance of nearby competitors (for example, by allelopathy) (NOVOPLANSKY, 2009).
In the competition for light, the responses that prevent competitive interactions consist in the development
of traits that prevent shading, such as low root/above-ground part ratios, thinner stems, and strong apical dominance with low branching intensity, which are traits that promote vertical stem growth, allowing the plants to rise above the branches of neighboring plants (KEGGE; PIERIK, 2009). In support of these observations, it was observed that increased planting densities decreased branch sizes, increased mortality of lower branches, made branch angles more acute, and decreased stem diameters in two tree species (ALCORN et al., 2007). This would explain the higher plant (Table 1) and first branching heights (Table 3) observed at higher planting densities (Table 1).
The traits that “prevent shading” occur even when neighboring plants are very small and therefore
Table 8 - Means for traits of cassava, cv. Vermelhinha, submitted to different planting densities1
1Parameters significant at 5% level by the t test. Harvest index = ratio between marketable roots dry matter and total dry matter (leaves + stems + branches +
marketable roots + unmarketable roots). Ideal density = density at which maximum yield values are obtained;2Experimental coefficient of variation
Planting density (plants ha-1)
---Dry matter (kg ha-1
)---Harvest index
Marketable roots Above-ground part
5,000 6,072 3,689 0.59 7,000 9,896 5,734 0.61 9,000 11,268 7,607 0.57 11,000 10,777 8,131 0.53 13,000 14,282 12,042 0.51 15,000 12,660 13,001 0.45 17,000 10,964 15,469 0.39 19,000 10,714 14,306 0.40 21,000 10,218 12,302 0.43 CV2(%) 24.7 24.0 12.6 Fitted equation (x = density)2 y = 27041.7 - 0.5944 x - 90824000/x y0.5 = 0.0000019 + 0.01308 x -0.00000036 x2 y = 0.6830 - 0.00001425 x R2 0.82 0.94 0.88 Ideal density (plants ha-1) 12361 18149
-do not cause shading (CALLAWAY, 2002). In other words, morphological changes that prevent shading occur before shading takes place, i.e., before photosynthesizing photon flux density becomes a limiting factor (RAJCAN; CHANDLER; SWANTON, 2004). The response of a plant to prevent shading caused by its neighbors would start when a low red/far-red (R/FR) ratio in the light reflected from the nearby vegetation is perceived (BALLARÉ, 1999). A reduced R/FR ratio is created by selective absorption of red light for photosynthesis and reflection of far-red light. The low R/FR ratio is perceived by photoreceptors, in a process that precedes actual shading and consequently precedes competition for light, and initiates the responses that prevent shading. Light quality also influences the architecture of the plant’s above-ground part (RAJCAN; CHANDLER; SWANTON, 2004).
Portulaca oleracea L. plantlets grow towards low far-red
radiation and get away from neighboring plants (high far-red radiation) (CALLAWAY, 2002). In addition to a perception of low R/FR ratios, there is evidence that in the presence of neighboring plants, alterations occur in the emission of biogenic, volatile organic compounds (produced by plants). These compounds may act both as allelochemicals and as signals for detection of neighboring plants (KEGGE; PIERIK, 2009).
Below the soil surface, competition occurs for water, nutrients, and space. In addition to the signals
emitted by plants above the soil surface, detection of neighboring plants also involves several signals below the ground, such as water and/or nutrient depletions, as a consequence of effective absorption by neighboring root systems (SCHENK, 2006) and organic exudates excreted by neighboring plants (BAIS et al., 2006). Competition between roots may affect the availability of a given resource for plants, either by depletion of that resource or by mechanisms that inhibit the access of other roots to the resource (by allelopathy) (SCHENK, 2006). Root competition is more intense under resource-poor conditions (PUGNAIRE; LUQUE 2001).
There must be interactions between the plants’ above-ground part and root system in the competition between plants for light, water, nutrients, and space (CAHILL, 2002). These interactions would influence growth of the various plant organs differently. In the competition for light, stem growth in height demands resources that would be used for the formation of roots and leaves (HENRY; AARSSEN, 1997). On the other hand, the water deficiency caused by competition between roots would induce the closure of stomata, resulting in photosynthesis reduction (SILVA; VARGAS; WERLANG, 2004), reducing the growth of roots, stems, and leaves. These would explain the yield reductions of roots, stems, and leaves observed in this study beyond certain planting densities (Tables 2 to 4).
CONCLUSIONS
1. Increased planting densities only increased plant height at 180 days after planting;
2. The ideal planting densities to maximize green matter of leaves and stems + branches, total roots (both marketable and unmarketable), marketable roots, number of marketable roots, marketable root dry matter, and dry matter of the above-ground part (stems + branches + leaves) were 17,800; 17,077; 14,416; 13,594; 16,436; 12,361; and 18,149 plants ha-1, respectively;
3. By adopting the planting density commonly used by growers (5,000 plants ha-1), a yield of 15,837 kg ha-1 marketable roots
was obtained. Using the ideal planting density identified in this study (13,594 plants ha-1), we obtained more than twice
the yield value obtained by growers;
4. Increased planting densities reduced the mean lenght of marketable roots and the harvest index.
REFERENCES
ALCORN, P. J. et al. Effects of initial planting density on branch development in 4-year-old plantation grown Eucalyptus
pilularis and Eucalyptus cloenziana trees. Forest Ecology and Management, v. 252, n. 1, p. 41-51, 2007.
AYOOLA, O. T.; MAKINDE, E. A. Fertilizer treatment effects on performance of cassava under two planting patterns in a cassava-based cropping system in South West Nigeria. Research Journal of
Agriculture and Biological Sciences, v. 3, n. 1, p. 13-20, 2007.
AYOOLA, O. T.; MAKINDE, E. A. Influence of cassava population density on the growth and yield performance of cassava-maize intercrop with a relayed cowpea. Tropical and
Subtropical Agroecosystems, v. 8, n. 3, p. 235-241, 2008.
BAIS, H. P. et al. The role of root exudates in rhizosphere interactions with plants and other organisms. Annual Review of
Plant Biology, v. 57, n. 1, p. 233-266, 2006.
BALLARÉ, C. L. Keeping up with the neighbours: phytochrome sensing and other signaling mechanisms. Trends in Plant
Science, v. 4, n. 1, p. 97-102, 1999.
CAHILL, J. F. Interactions between root and shoot competition vary among species. Oikos, v. 99, n. 1, p. 101-112, 2002. CALLAWAY, R. M. The detection of neighbors by plants. Trends
in Ecology and Evolution, v. 17, n. 1, p. 104-105, 2002.
CARMO FILHO, F.; OLIVEIRA, O. F. de. Mossoró: um município do semi-árido nordestino. Mossoró: Fundação Guimarães Duque/ ESAM, 1989. 62 p. (Coleção Mossoroense, 672. Série B). EMPRESA BRASILEIRA DE PESQUISA AGROPECUÁRIA. Centro Nacional de Pesquisa do Solo. Sistema brasileiro
de classificação de solos. Brasília: Serviço de Produção de
Informação, 1999a. 412 p.
EMPRESA BRASILEIRA DE PESQUISA AGROPECUÁRIA.
Manual de análises químicas de solos, plantas e fertilizantes.
Brasília: Embrapa, 1999b. 370 p.
GUERRA, A. F. et al. Produtividade e qualidade de raízes de
mandioca em resposta ao regime hídrico e a densidade de plantio. Planaltina: Embrapa, 2003. 12 p.
HENRY, H. A. L.; AARSSEN, L. W. On the relationship between shade tolerance and shade avoidance in woodland plants. Oikos, v. 80, n. 3, p. 575-582, 1997.
KEGGE, W.; PIERIK, R. Biogenic volatile organic compounds and plant competition. Trends in Plant Science, v. 15, n. 3, p. 126-132, 2009.
JANDEL. Jandel TBLCURVE. Table Curve 3.0. Curve fitting
software. Corte Madera: Jandel Scientific, 1992. 280 p.
LEIHNER, D. Agronomy and cropping systems. In: HILLOCKS, R. J.; THRESH, J. M.; BELLOTI, A. C. Cassava: biology, production and utilization. Oxon: CAB International, 2002. cap. 6, p. 91-112. BELLIDO, F. J.; BELLIDO, L.; LÓPEZ-BELLIDO, R. J. Competition, growth and yield of faba bean (Vicia faba L.). European Journal of Agronomy, v. 23, n. 2, p. 359-378, 2005.
LIMA, L. C. L. et al. Valor nutritivo da parte aérea da mandioca (Manihot esculenta Crantz) em função da densidade e altura da planta. Magistra, v. 14, n. 2, p. 89-96, 2002.
NOVOPLANSKY, A. Picking battles wisely: plant behavior under competition. Plant Cell and Environment, v. 32, n. 6, p. 726-741, 2009.
OPARA-NADI, O.; LAL, R. Effects of plant population on soil structure, soil moisture depletion and on yield of cassava (Manihot
esculenta) on an Ultisol in Southeast Nigeria. Journal of the Science of Food and Agriculture, v. 38, n. 4, p. 291-302, 2008.
PUGNAIRE, F. I.; LUQUE, M. T. Changes in plant interactions along a gradient of environmental stress. Oikos, v. 93, n. 1, p. 42-49, 2001.
RAJCAN, I.; CHANDLER, K. J.; SWANTON, C. J. Red-far-red ratio of reflected light: a hypothesis of why early-season weed control is important in corn. Weed Science, v. 52, n. 5, p. 774-778, 2004. RIBEIRO JÚNIOR, J. I. Análises estatísticas no SAEG. Viçosa: Universidade Federal de Viçosa, 2001. 301 p.
ROJAS, R. et al. Efecto de la densidad de plantación sobre el desarrollo y rendimiento del cultivo de la yuca Manihot
esculenta Crantz, bajo las condiciones agroecológicas de
la Altiplanicie de Maracaibo. Revista de la Facultad de
Agronomia, v. 24, n. 1, p. 94-112, 2007.
SCHENK, H. J. Root competition: beyond resource depletion.
Journal of Ecology, v. 94, n. 4, p. 725-739, 2006.
SILVA, A. A. da; VARGAS, L.; WERLANG, R. C. Manejo de plantas daninhas na cultura do milho. In: GALVÃO, J. C. C.; MIRANDA, G. V. Tecnologias de produção do milho. Viçosa: UFV, 2004. cap. 8, p. 269-310.
VIOLLE, C. et al. Competition, traits and resource depletion in plant communities. Oecologia, v. 160, n. 4, p. 747-755, 2009.