Acta Scientiarum
http://www.uem.br/acta ISSN printed: 1679-9275 ISSN on-line: 1807-8621
Doi: 10.4025/actasciagron.v39i1.30856
Population parameters and selection of kale genotypes using
Bayesian inference in a multi-trait linear model
Alcinei Mistico Azevedo1*, Valter Carvalho de Andrade Júnior2, Albertir Aparecido dos Santos2,
Aderbal Soares de Sousa Júnior2, Altino Júnior Mendes Oliveira2 and Marcos Aurélio Miranda
Ferreira2
1
Universidade Federal de Minas Gerais, Campus Regional de Montes Claros, Avenida Universitária, 1000, 39404-547, Montes Claros, Minas Gerais, Brazil. 2
Universidade Federal dos Vales Jequitinhonha e Mucuri, Diamantina, Minas Gerais, Brazil. *Author for correspondence. E-mail: [email protected]
ABSTRACT. Variance components must be obtained to estimate genetic parameters and predict breeding values. This information can be obtained through Bayesian inference. When multiple traits are evaluated, Bayesian inference can be used in multi-trait models. The objective of this study was to obtain estimates of genetic parameters, gains with selection, and genetic correlations among traits. Likewise, we aim to predict the genetic values and select the best kale genotypes using the Bayesian approach in a multi-trait linear model. The following traits were evaluated: stem diameter, plant height, number of shoots, number of marketable leaves and fresh weight of leaves using Bayesian inference in 22 kale genotypes. The experiment consisted of a randomized block design with three replications and four plants per plot. Genetic effects predominated over environmental effects. The highest correlation estimates were found between the fresh weight of leaves and stem diameter and between the plant height and number of marketable leaves. The following commercial cultivars and genotypes are recommended for cultivation and to integrate into breeding programs: UFLA 11, UFLA 5, UFLA 6, UFVJM 3 and UFVJM 19. The estimates of the gain with selection indicate the potential for improvement of the studied population.
Keywords:Brassica oleracea L. var. acephala DC., genetic parameters, crop breeding, statistical modeling, correlations.
Parâmetros populacionais e seleção de genótipos de couve por inferência bayesiana em
modelo linear multicaracterístico
RESUMO. Para selecionar genitores em programas de melhoramento deve-se obter os componentes de variância para estimar parâmetros genéticos e predizer valores genéticos, os quais podem ser obtidos vantajosamente pela inferência bayesiana. Quando várias características são avaliadas a inferência bayesiana pode ser utilizada em modelos multicaracterísticos. Objetivou-se obter estimativas de parâmetros genéticos, ganhos de seleção, conhecer as correlações genéticas entre as características, predizer valores genéticos e selecionar melhores genótipos de couve utilizando a abordagem bayesiana em modelo linear multicaracterístico. Foram avaliados o diâmetro do caule, altura da planta, número de brotações, número de folhas comercializáveis e massa fresca de folhas por inferência bayesiana em 22 genótipos de couve. Foi utilizado o delineamento em blocos casualizados com três repetições e quatro plantas por parcela. Verificou-se a predominância dos efeitos genéticos sobre os ambientais. As maiores estimativas de correlação foram encontradas entre a matéria fresca de folhas e as características diâmetro do caule, altura de plantas e número de folhas comercializáveis. Além das testemunhas comerciais, são indicados para o cultivo e para integrar programas de melhoramento os genótipos UFLA 11, UFLA 5, UFLA 6, UFVJM 3 e UFVJM 19. As estimativas do ganho de seleção indicaram o potencial de melhoramento para a população estudada.
Palavras Chave: Brassica oleracea L. var. acephala DC., parâmetros genéticos, melhoramento genético, modelagem estatística, correlações.
Introduction
Kale (Brassica oleracea L. var. acephala DC.) is an annual or biennial vegetable that belongs to the
Brassicaceae family. Due to its new uses in culinary dishes and recent discoveries about its nutraceutical properties, the kale consumption has gradually
higher stem diameter, and higher number of leaves (Azevedo et al., 2012).
To define strategies for breeding programs, it is necessary to estimate variance components, predict breeding values and obtain estimates of genetic parameters (Gonçalves-Vidigal, Mora, Bignotto, Munhoz, & Souza, 2008; Oliveira, Santana, Oliveira, & Santos, 2014). The variance components are unknown and are usually estimated by the method of moments, maximum likelihood (ML), or restricted maximum likelihood (REML). Generally, two or more traits are simultaneously evaluated in studies with kale. In this case, the multi-traits models can be applied, which allow the improvement of the predictions (Viana, Sobreira, Resende, & Faria, 2010) and the determination of associations among traits. In this case, Bayesian inference can be advantageously used because it enables the calculation of the densities of the marginal posterior distributions and the credibility intervals of the variance components, breeding values and genetic parameters, such as heritability, coefficient of genotypic variation, coefficient of residual variation, relative variation index and genotypic correlation (Waldmann & Ericsson, 2006).
Thus, the objective of this work was to use the Bayesian approach considering a multi-trait linear model to obtain estimates of the genetic parameters, assess the genetic correlation between traits, predict breeding values, and select the best kale genotypes available in the germplasm bank of the UFVJM (Federal University of the Valleys Jequitinhonha and Mucuri).
Material and methods
The experiment was carried out at the Diamantina-MG (18º12'01'' S; 43º34'20'' W, 1387 m asl). Three commercial cultivars and 19 kale accessions of the UFVJM germplasm bank were evaluated. A complete randomized block design with three replications and four plants per plot was used. Among the genotypes evaluated, twelve accessions were from farm collection in the region of Diamantina, Minas Gerais State (UFVJM-3, UFVJM-7, UFVJM-8, UFVJM-10, UFVJM-13, UFVJM-19 UFVJM-21, UFVJM- 24, UFVJM-26, UFVJM-32, UFVJM-34 and UFVJM-36), and seven accessions were donated by the Federal University of Lavras - UFLA (UFLA-1, UFLA-3, UFLA-5, UFLA-6, UFLA-8, UFLA, UFLA-12, and UFLA-11). The commercials genotypes were the following cultivars: "couve manteiga 900 legitima pé
alto", from the Feltrin® company (COM-1); "couve manteiga", from the Vidasul baby® company
(COM-2), and "couve de folha manteiga Geórgia", from the Horticeres® company (COM-3).
On June 7th, 2013, shoots were collected for
seedling formation. These shoots were three to four centimeters in height and had two leaflets. After collection, the shoots were planted in trays with 72 cells filled with a commercial substrate. These trays were kept in a greenhouse for 30 days for better rooting. On July 7th, 2013, the seedlings were
transplanted into 2.50 m wide and 0.30 m high beds, spaced at 1 m between rows and 0.50 m between plants. Fertilization was carried out according to the recommendations available for the crop.
In each plant, the number of shoots (when they were removed), number of marketable leaves and fresh weight of marketable leaves were evaluated. These assessments were made during 15 harvests in the period from September 8th, 2013 to March 4th,
2014. Fully expanded leaves with a leaf length larger than 15 cm and no signs of senescence were considered marketable (Azevedo et al., 2012). The plant height (using measuring tape) and stem diameter (measured with a pachymeter at half the height of the plant) were evaluated on January 6th, 2014.
Statistical analyses were carried out using the plot mean. We consider the multi-trait mixed model by Henderson and Quaas (1976). Let vector y1 represent the n1 observations for trait 1, y2 represent the n2 observations for trait 2 and ynrepresent the nn
observations for trait n. Then, the multi-trait mixed linear model for n traits can be written as follows:
yi = Xiβi + Ziui + ei, i=1,2,...,n;
where: Xi = is the incidence matrix of the block effects associated with trait i; βi = is the vector of fixed blocks effects summed to the overall mean associated with trait i; Zi= is the incidence matrix of
the genetic effect of each genotype for trait i; ui = is the vector of random effects of genotypes associated with trait i; ei = is the vector of random residual effects associated with trait i. The assumptions on the distribution of y, u, and e are described as:
~ ~
~ ~
~ ~
'
~
0
,
'
0
y
X
ZGZ
R
ZG
R
u
NMV
GZ
G
R
R
e
β
+
Φ
Φ
Genetic evaluation of kale genotypes 27
Here, R and G are covariance matrices associated with the vector e of residuals and vector
u of random effects. If R0 (of order 5 × 5) is the residual covariance for the five traits, then R can be calculated as R = R0 ⊗ I (here ‘⊗’ is the Kronecker product of two matrices and I is the identity matrix). Similarly, the genetic covariance matrix G can be calculated as G = G0⊗I. In the mixed model used, β is considered the vector of solutions for the systemic effects; however, from the Bayesian point of view, it is a vector of random effects in which the initial distribution values have uninformative priors; thus, they do not provide much information about the parameter and, therefore, have a uniform probability distribution (Everling, et al., 2014). This type of probability distribution indicates the same probability of occurrence of each of the possible variable values. Gaussian and inverted Wishart distributions were defined as a priori
distributions for random effects and (co)variance components, respectively. In all the cases were considered vague priori with flat probability (uninformative prior distributions).
The Bayesian inference was used for estimating the variance components and predicting the breeding values of the accessions. The data analysis was carried out with the R software (R Development Core Team, 2012) using the support of MCMCglmm package (Hadfield, 2010), through the Gibbs sampling algorithm. A Markov chain with 2,000,000 cycles was generated. It was considered a
burn in of 100,000 cycles and a thinning interval of 1,000 cycles, which ensured that the serial correlations were zero or very low. As a check criterion for convergence, the p-value of the Geweke test was analyzed.
From the posterior distribution, the following parameters were calculated: the genetic variation
coefficients:
CVg
(%)
=
(
σ
ˆ
g2/
m
ˆ
g).100;
theresidual coefficients of variation: 2
ˆ ˆ
(%) ( e / g).100;
CVe =
σ
m the variation index:/
;
v
I
=
CVg CVe
the genotypic correlationcoefficients:
r
g=
CoV X Y
ˆ
g( , ) /
σ
ˆ
g2( ).
X
σ
ˆ
g2( );
Y
the heritability in the broad sense: 2 ˆ2 ˆ2 ˆ2
(%) ( g/( g e)).100;
h =
σ
σ
+σ
and the gain withselection:
Gs
(%) 100. .(
=
h
2m
ˆ
s−
m
ˆ
g) /
m
ˆ
g ; where2
ˆ
gσ
is the genetic variance,σ
ˆ
e2 is the residualvariance,
CoV
ˆ
g is the genetic covariance obtainedby the multi-trait model,
m
ˆ
g is the trait overallmean, and
m
ˆ
s is the mean of the top 30% of individuals.For the variance components, genetic parameters and breeding values, we calculated the mean, median, mode and interval of higher density of posterior distribution (HPD) with the support of the boa package.
Results
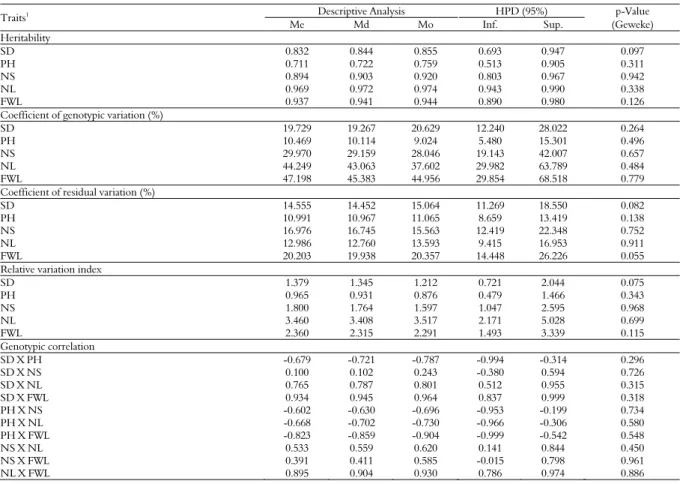
The p-value of the Geweke test was used as an indication of convergence with the Markov Chains (Table 1). All the p-value estimates obtained by the Geweke test were lower than 0.05. Values closer to the mean, median and mode for the marginal posterior distribution of the parameters obtained were found.
The highest heritability estimates were found for the number of leaves and fresh weight of leaves (Table 1). The plant height had the lowest heritability estimates. However, these estimates did not significantly differ from the credibility interval. The plant height also had the lowest estimate for the genetic variation coefficient. This estimate did not significantly differ from that found for the stem diameter. The number of leaves and fresh weight of leaves presented the highest coefficient of genetic variation.
The mode for the posterior distribution of the coefficient of environmental variation ranged from 8.659% for plant height to 14.448% for the fresh weight of leaves (Table 1). Only the plant height and fresh weight of leaves showed significant differences in the estimates of the coefficient of environmental variation. Moreover, only the plant height had a mode of the posterior distribution of the coefficient of relative variation lower than 1.00 (0.876). However, its estimates were not significantly lower than 1.00 according to the credibility interval (0.479-1.466). The number of leaves showed the highest coefficient of relative variation, which differ significantly from the estimates found for stem diameter and plant height.
Table 1. Mean (Me), median (Md), mode (Mo), higher posterior density intervals (HPD), and p-value of the Geweke test for the posterior distribution of the estimates of heritability, coefficient of genotypic variation (%), coefficient of residual variation (%), relative variation index, and genotypic correlation in kale genotypes. Diamantina, Universidade Federal dos Vales do Jequitinhonha e Mucuri (UFVJM, 2015).
Traits1 Descriptive Analysis HPD (95%) p-Value
Me Md Mo Inf. Sup. (Geweke) Heritability
SD 0.832 0.844 0.855 0.693 0.947 0.097
PH 0.711 0.722 0.759 0.513 0.905 0.311
NS 0.894 0.903 0.920 0.803 0.967 0.942
NL 0.969 0.972 0.974 0.943 0.990 0.338
FWL 0.937 0.941 0.944 0.890 0.980 0.126
Coefficient of genotypic variation (%)
SD 19.729 19.267 20.629 12.240 28.022 0.264
PH 10.469 10.114 9.024 5.480 15.301 0.496
NS 29.970 29.159 28.046 19.143 42.007 0.657
NL 44.249 43.063 37.602 29.982 63.789 0.484
FWL 47.198 45.383 44.956 29.854 68.518 0.779
Coefficient of residual variation (%)
SD 14.555 14.452 15.064 11.269 18.550 0.082
PH 10.991 10.967 11.065 8.659 13.419 0.138
NS 16.976 16.745 15.563 12.419 22.348 0.752
NL 12.986 12.760 13.593 9.415 16.953 0.911
FWL 20.203 19.938 20.357 14.448 26.226 0.055
Relative variation index
SD 1.379 1.345 1.212 0.721 2.044 0.075
PH 0.965 0.931 0.876 0.479 1.466 0.343
NS 1.800 1.764 1.597 1.047 2.595 0.968
NL 3.460 3.408 3.517 2.171 5.028 0.699
FWL 2.360 2.315 2.291 1.493 3.339 0.115
Genotypic correlation
SD X PH -0.679 -0.721 -0.787 -0.994 -0.314 0.296
SD X NS 0.100 0.102 0.243 -0.380 0.594 0.726
SD X NL 0.765 0.787 0.801 0.512 0.955 0.315
SD X FWL 0.934 0.945 0.964 0.837 0.999 0.318
PH X NS -0.602 -0.630 -0.696 -0.953 -0.199 0.734
PH X NL -0.668 -0.702 -0.730 -0.966 -0.306 0.580
PH X FWL -0.823 -0.859 -0.904 -0.999 -0.542 0.548
NS X NL 0.533 0.559 0.620 0.141 0.844 0.450
NS X FWL 0.391 0.411 0.585 -0.015 0.798 0.961
NL X FWL 0.895 0.904 0.930 0.786 0.974 0.886
Traits1: stem diameter (SD); plant height (PH); number of shoots (NS); number of leaves (NL) and fresh weight of leaves (FWL).
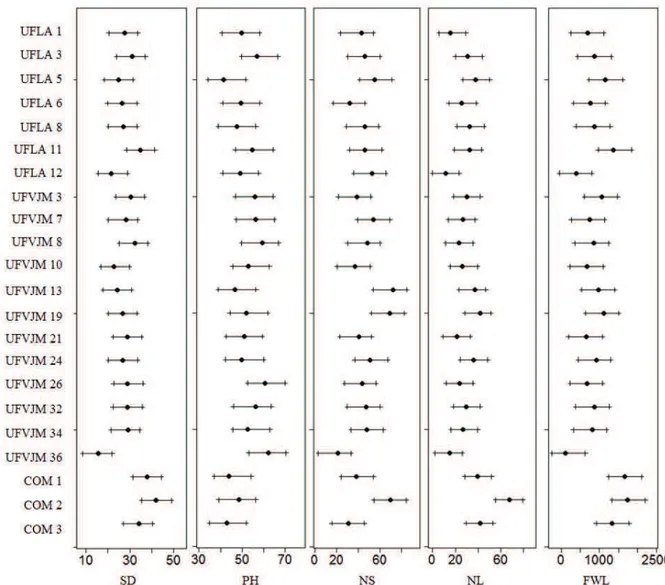
The commercial cultivars COM 1, COM 2 and COM 3 (Figure 1) presented the highest stem diameters, which were significantly different only from the UFVJM 36 genotype, according to the credibility interval. Accession UFLA 5 had the lowest height, which was significantly different only from the UFVJM 26 and UFVJM 36 genotypes. The genotype with the lowest number of shoots was UFVJM 36, and it did not significantly differ from the UFLA 5, UFLA 12, UFVJM 7, UFVJM 13, UFVJM 16, UFVJM 24, and COM 2 genotypes. For the number of leaves and fresh weight of leaves, the best results were found for the commercial cultivars, which were significantly different only from the UFLA 12 and UFVJM 36 genotypes.
The plant height presented the lowest gain with selection estimates (Figure 2). For this trait, the mode of the posterior distribution was -10%. The other traits showed higher estimates for gain with selection. The fresh weight of leaves, number of leaves and number of shoots had higher estimates of gain with selection.
Discussion
The obtained asymmetric credible intervals for the variance components, genetics parameters and breeding values are a peculiarity of Bayesian inference. They make this approach notably informative (Mathew et al., 2012) and facilitate hypothesis testing. According to Apiolaza, hauhan, and Walker (2011), asymmetric credibility intervals obtained by posterior distribution make the conclusions more realistic than those based on symmetric confidence intervals of frequentist statistics. Additionally, Bayesian inference allows the evaluation of unbalanced experiments and the study of more complex statistical models (Bink et al., 2007). Consequently, its use has become more common among breeders not only for the analysis of molecular data but also for phenotypic data.
Genetic evaluation of kale genotypes 29
The lowest heritability estimate found for plant height is the consequence of the lowest genotypic variation because the residual variation was low when compared with the other traits. This trait also presented the lowest estimate of genetic variation, which indicates a difficulty for the improvement of plant height in this population. However, there was overlap of the credibility intervals between the traits regarding heritability and coefficient of relative variation. This outcome shows that these estimates were not significantly different. The estimates obtained for heritability and for the relative coefficient of variation indicate a higher possibility of success with selection than the success observed by Azevedo et al. (2012), who
evaluated 30 kale genotypes. According to these authors, in kale genetic breeding, it is important to increase the stem diameter and reduce plant height, which reduces the need for staking. Likewise, according to Chakwizira et al. (2009), the stem diameter is not only influenced by genetic factors but also by weather conditions of the growing region. The reduction in the number of shoots is advantageous because it reduces the need for cultural practices, such as sprout thinning. From a commercial point of view, another advantage of a lower number of shoots is the reduction of the potential for vegetative propagation of the plant, which can increase the continuous sale of seeds (Azevedo et al., 2012).
F w t p b b p f b
Figure 2. Distrib (%) for five traits
According several traits o work, a bias correlated trai this bias and predictions of Quaas (1976 method. The analysis consid simultaneousl breeding valu et al., 2010; A study had f between stem leaves or fresh and SD x FW selection of p provide a redu number of l selection for increase in the leaves, which selection for t an increase in of leaves and undesirable. A (1996), the cor of pleiotropy undesirable c linkage, these recombination fertilization; c become major
bution of posterior evaluated in kale g
to Viana et al of interest, as in the select its are analyze d obtain mor f the breeding 6) proposed advantage of ders several tr y, which allow ues and corre Apiolaza et al.
favorable asso diameter and h weight of lea
WL). This re plants with lar
uction in plant leaves and le lower plant e number of le h is also de the lowest num n plant height
d fresh weig According to rrelations betw y or genetic correlations a e associations n caused b consequently, r impediments
r density of gain w genotypes.
l. (2010), whe occurred in t tion can happ ed individually
re accurate an g value, Hend
the multi-tr f this model raits and their
ws a greater a elation estima , 2011). The ociations for plant height, aves (SD x PH esult indicate rger stem diam t height and in eaf fresh we
height can eaves and fresh esirable. How mber of shoots
and reduce th ght of leaves,
Falconer an ween traits can linkage. Thu are caused b
can be broke by crossing
these factors s to breeding p
with selection
n there are the present pen if the y. To avoid
nd precise derson and
ait BLUP is that the
covariance accuracy of ates (Viana correlation r breeding number of H, NL x SD es that the
meters can ncrease the eight. The
enable an h weight of wever, the
s can cause he number which is nd Mackay n be a result
us, if the by genetic en through or self-might not programs. In addit following ge breeding pr the genotyp fresh weigh the genotyp because it h UFVJM 3 b the highest p All the t selection (F Azevedo et estimates of indicate the improvemen Conclusion
In the p genetic effec provides esti of variation f There a genetic impr height, num In addit following ge to integrate UFLA 5, UF
The estim the studied genetic impr Acknowledg The au FAPEMIG f to develop th
References
Apiolaza, L. A Genetic opposite w selection. Azevedo, A. Fernande A., & M performan Pesquisa A Bink, C. A. M
J., Voorri Bayesian populatio
tion to the c enotypes are r rograms: UFL pes with the l t of leaves; U pes with the has the lowes because it is o production of traits presente Figure 2) grea al. (2012), ex f gain with sel e potential of nt of the popu
resent study, t cts over the e mates of herita favorable to gen are favorable
rovement of th mber of leaves o
tion to the c enotypes are in e into breedi
FLA 6, UFVJM mates of gain w d population rovement. gements uthors thank for providing his study.
A., Chauhan, S. control of ve wood in Pinus r Tree Genetics & M., Andrade Jú es, J. S. C, Vala
Martins, R. A nce and genetic Agropecuária Brasi M., Boer, M. P. ips, R. E., & Va
analysis of com ons. Euphytica, 16
commercial c recommended LA 11 because
largest stem d FLA 5 becaus
lowest heigh st number of one of the gen
leaves. ed estimates o
ater than tho xcept for plant lection found f selection for lation evaluate
there is a pred environment e ability and relati netic improvem correlations he stem diame or fresh weigh commercial c ndicated for cu ng programs: M 3, and UFVJ
with selection has a great p
k CNPq, C scholarships a
S., & Walker, J ery early com radiata and its im
Genomes, 7(3), 5 únior, V. C., P adares, N. R., F A. V. (2012) c variability in k ileira, 47(12), 17
, Ter Braak, C. an De Wegwe, mplex traits in p
61(1), 85-96.
cultivars, the d to integrate e it is one of diameter and e it is one of ht; UFLA 6 f shoots; and notypes with
of gains with se found by t height. The in this study r the genetic ed. dominance of effects, which ive coefficient ment. between the eter and plant
t of leaves. cultivars, the ultivation and
: UFLA 11, VJM 19.
n indicate that potential for
CAPES and and resources
J. C. F. (2011). mpression and
mplications for 563-571. Pedrosa, C. E., Ferreira, M. R. ). Agronomic kale genotypes.
51-1758. J. F., Cansen,
Genetic evaluation of kale genotypes 31
Chakwizira, E., Fletcher, A. L., Ruiter, J. M., Meenken, E., Maley, S., & Wilson, D. R. (2009). Kale dry matter yield responses to nitrogen and phosphorus application. Agronomy New Zealand, 39(1), 59-70. Cowles, M. K., & Carlin, B. P. (1996). Markov Chain
Monte Carlo Convergenc Diagnostics: A Comparative Review. Journal of the American Statistical Association, 91(434), 883-904.
Everling, D. M., Bresolin, T., Rorato, P. R. N., Araujo, R. O., Boligon, A. A., Weber, T., … Campos, L. T. (2014). Finishing precocity visual score and genetic associations with growth traits in Angus beef cattle. Genetics and Molecular Research, 13(3), 7757-7765. Falconer, D. S., & Mackay, T. F. C. (1996). Introduction to
quantitative genetics. Edinburgh, SC: Addison Wesley Longman.
Gonçalves-Vidigal, M. C., Mora, F., Bignotto, T. S., Munhoz, R. E. F., & Souza, L. D. (2008). Heritability of quantitative traits in segregating common bean families using a Bayesian approach. Euphytica, 164(2), 551-560. Hadfield, J. D. (2010). MCMC Methods for
Multi-Response Generalized Linear Mixed Models:TheMCMCglmm R Package. Journal of Statistical Software, 33(2), 1-22.
Henderson, C. R., & Quaas, R. L. (1976). Multiple trait evaluation using relatives records. Journal of Animal Science, 43(434), 1188-1197.
Mathew, B., Bauer, A. M., Koistinen, P., Reetz, T. C., Léon, J., & Sillanpaa, M. J. (2012). Bayesian adaptive Markov chain Monte Carlo estimation of genetic parameters. Heredity, 109(4), 235-245.
Moreno, D. A., Carvajal, M., Lopez-Berenguer, C., & Garcia-Viguera, C. (2006). Chemical and biological
characterization of nutraceutical compounds of broccoli. Journal of Pharmaceutical and Biomedical Analysis, 41(5), 1508-1522.
Oliveira, E. J., Santana, F. A., Oliveira, L. A., & Santos, V. S. (2014). Genetic parameters and prediction of genotypic values for root quality traits in cassava using REML/BLUP. Genetics and Molecular Research, 13(3), 6683-6700.
R Development Core Team. (2012). R: A Language and Environment for Statistical Computing [Software]. Viena, AU: R Development Core Team.
Soengas, P., Sotelo, T., Velasco, P., & Cartea M. E. (2011). Antioxidant properties of Brassica vegetables. Functional Plant Science and Biotechnology, 5(2), 43-55. Viana, J. M. S., Sobreira, F. M., De Resende, M. D. V., &
Faria, V. R. (2010). Multi-trait BLUP in half-sib selection of annual crops. Plant Breeding, 129(6), 599-604.
Vilar, M., Cartea, M. E., & Padilla, G. (2008). The potential of kales as a promising vegetable crop. Euphytica, 1591(1), 153-165.
Waldmann, P., & Ericsson, T. (2006). Comparison of REML and Gibbs sampling estimates of multi-trait genetic parameters in Scots pine. Theoretical and Applied Genetics, 112(8), 1441-1451.
Received on February 4, 2016. Accepted on June 22, 2016