Departamento de Contabilidade
How does the market view interests in jointly controlled entities?
Sónia Raquel Baptista Fernandes
Dissertação submetida como requisito parcial para obtenção do grau de
Mestre em Contabilidade
Orientador:
Doutora Isabel Lourenço, Professora Auxiliar, ISCTE-IUL
I A
ACCKKNNOOWWLLEEDDGGEEMMEENNTTSS
The author wishes to thank Professor Isabel Costa Lourenço for all her help in this work. I am also grateful to Professor José Dias Curto for some assistance with the empirical work. And finally I want to thank my family for their on-going support.
R
REESSUUMMOO
Este estudo tem como objectivo de analisar a forma como os investidores avaliam os investimentos financeiros das entidades, nomeadamente em entidades conjuntamente controladas. Para isso, irá ser analisado se os activos e passivos deste tipo de entidades são semelhantes aos activos e passivos das empresas detentoras deste tipo de investimentos ou se são considerados que os riscos e benefícios associados activos e passivos estão apenas subjacentes às entidades conjuntamente controladas.
De forma a analisar esta questão irá ser utilizado um modelo de valorização utilizado pelo Landsman et al. (2008). Neste modelo são incluídos indicadores como os activos, passivos e resultado liquido das empresas detentoras de investimentos em entidades conjuntamente controladas, assim como, os activos e passivos das entidades conjuntamente controladas.
Os resultados são baseados em comparações de coeficientes dos activos e passivos. Os resultados apontam que os investidores avaliam os activos e passivos das entidades conjuntamente controladas de forma semelhante aos activos e passivos da empresa detentora deste tipo de investimentos, o que vem sustentar adopção do modelo proporcional ao invés da equivalência patrimonial. Consequentemente, este estudo fornece uma forte contribuição para o debate internacional que existe neste momento relativo a esta matéria, nomeadamente ao projecto de convergência do International Accounting Standards Board (IASB), que procura remover a opção existente na International Accounting Standard 31 (2003), Interests in Joint Ventures (IAS 31), entre o método proporcional e equivalência patrimonial para entidades conjuntamente controladas.
PALAVRAS-CHAVE: Empreendimentos conjuntos, Harmonização contabilística, Equivalência Patrimonial, Consolidação Proporcional
III A
ABBSSTTRRAACCTT
This study addresses whether the market views the venturers share of jointly controlled entities assets and liabilities as assets and liabilities of the venturer or whether the risks and rewards associated with the venturers’ share of jointly controlled entities assets and liabilities reside with the jointly controlled entities.
We estimate a cross-sectional valuation model based on that used in Landsman et al. (2008). The key valuation model is one that includes measures of the venturer’s assets, liabilities and net income and also measures of the venturer’s share of jointly controlled entities’ assets and liabilities.
Findings are based on comparisons of asset and liability coefficients. They suggest that investors view the venturer’s share of jointly controlled entities assets and liabilities similarly to the assets and liabilities of the venturer and thus support the adoption of proportionate consolidation as a feasible alternative to the equity method. Therefore, it provides a useful contribution to the international debate on this issue, including to the International Accounting Standards Board (IASB) joint convergence project to find a consensual solution and remove the option of accounting for interests in jointly controlled entities from International Accounting Standard 31 (2003), Interests in Joint
Ventures (IAS 31).
KEYWORDS: Jointly Controlled Entities, Accounting Harmonization, Equity Method, Proportionate Consolidation
INDEX ACKNOWLEDGEMENTS ... I RESUMO ... II ABSTRACT ... III INDEX OF FIGURES ... V INDEX OF GRAPHS ... V INDEX OF TABLES ... V ABBREVIATION GLOSSARY ... VI 1. INTRODUCTION ... 1
2. REPORTING METHODS FOR INTERESTS IN JOINTLY CONTROLLED ENTITIES ... 4
2.1 International Rule of Accounting for Joint Ventures ... 4
2.2 The Equity Method versus Proportionate Consolidation ... 5
2.3 Theoretical Discussion on the Accounting Method for Interests in JCEs ... 7
2.4 The IASB’s Exposure Draft on Joint Ventures ... 8
3. RELATED RESEARCH ... 12
4. RESEARCH DESIGN ... 17
4.1 Sample and data ... 17
5. FINDINGS ... 21
6. SUMMARY AND CONCLUSIONS ... 30
V I
INNDDEEXXOOFFFFIIGGUURREESS
FIGURE 1 - Proportional Consolidation versus equity method: Example of
balance sheet and income statement ... 6
I INNDDEEXXOOFFGGRRAAPPHHSS GRAPH 1 - Statistics of Comment Letters against or in favor of the removal proportionate consolidation ... 9
GRAPH 2 - Numbers of English/French entities and large international auditors supporting or not supporting the elimination of proportionate consolidation ... 11
I INNDDEEXXOOFFTTAABBLLEESS TABLE 1 - Descriptive Statistics for the 110 French and the 162 U.K. Observations ... 21
TABLE 2- Correlations ... 24
TABLE 3 - Benchmark Model Regressions ... 25
TABLE 4 - Extended Model Regressions (desegregation of assets) ... 28
A
ABBBBRREEVVIIAATTIIOONNGGLLOOSSSSAARRYY
AASB - Australia Accounting Standards Board
ED 9 - Exposure Draft 9 – Joint Arrangements
FASB - American Financial Accounting Standards Board
G4+1 - Group of accounting standard setters composed of representatives from Australia, Canada, New Zealand, the United Kingdom and the United States of America, with representatives from the IASB participating as observers.
IAS 31 - Accounting Standards 31 (2003), Interests in Joint Ventures
IASB - International Accounting Standards Board
IFRS - International Financial Reporting Standards
JCAs - Jointly Controlled Assets
JCEs - jointly controlled entities
1 1
1..IINNTTRROODDUUCCTTIIOONN
Joint ventures are an important form of inter-organizational cooperation because, without actually acquiring one another, they allow firms to accomplish complex mutual tasks, otherwise impossible using simple arm’s length contracts.1 Several empirical studies demonstrate that the markets view joint ventures as value enhancing for the venturer, be they domestic joint ventures2 or international joint ventures3. In light of the recent trend in globalization, this feature of joint ventures is very important to multinational companies (Moskalev and Swensen, 2007).
Joint ventures can be of two types, Jointly Controlled Assets or Operations (JCA/Os) and Jointly Controlled Entities (JCEs). JCEs are separate business entities that the partners establish in order to undertake an economic activity that is subject to joint control. JCA/Os are similar to JCEs but they do not involve the creation of a separate business entity.
All relevant accounting standards require the venturers to report their share of the joint venture’s assets, liabilities, expenses and revenues or, in other words, to use the proportionate consolidation method when the joint venture is a JCA/O.
Two different reporting methods for interests in JCEs are required or allowed by different standard setters around the world, the equity method and proportionate consolidation. The key question underlying this issue is whether the risks and rewards associated with the venturers’ share of JCEs’ assets and liabilities reside with the venturer or with the JCE. The proportionate consolidation method is preferable in the first case; the equity method should be used when the second scenario is true. The proponents of the proportionate consolidation argue that this method better reflects the substance and economic reality of JCEs; the equity method is preferred by those who
1 Some literature provides explanations for the creation of joint ventures, most of which are based on the transaction costs theory (Hennart, 1988; Hennart, 1991; Hennart and Reddy, 1997; and Chen and Hennart, 2004).
2 See, for example, McConnel and Nantell (1985), Koh and Venkatraman (1991), Elayan (1993), Park and Kim (1997) and Johnson and Houston (2000).
3 See, for example, Lee and Wyatt (1990), Etebari (1993), Prather and Min (1998) and Irwanto et al. (1999).
are uncertain about whether the venturer assumes the risks and rewards of its share of the JCE’s assets and liabilities.
Due to the lack of international consensus on this subject, the International Accounting Standards 31 (2003), Interests in Joint Ventures (IAS 31), allows either the equity method or proportionate consolidation to report interests in JCEs. Conscious of the need to find a consensual solution to this problem, the International Accounting Standards Board (IASB) and the American Financial Accounting Standards Board (FASB) have included this issue in their short-term convergence project which is aimed at reducing differences between international and American standards. When they find a consensual solution, the IASB will remove the option of accounting for interests in JCEs by the equity method or by the proportionate consolidation from IAS 31.
A gap in our knowledge about how the market views the venturer’s share of jointly controlled entities’ assets and liabilities hampers the efforts to find international consensus about the appropriate reporting method for interests in JCEs. We address this gap in the accounting literature by investigating whether the market views the venturers’ share of JCEs’ assets and liabilities as assets and liabilities of the venturer or whether the risks and rewards associated with the venturers’ share of JCEs’ assets and liabilities reside with the JCEs.
We answer this question by estimating a cross-sectional valuation model based on that used in Landsman et al. (2008). That study addresses a different but economically similar research question, i.e., whether the risks and rewards associated with the transferred assets and the debt issues by special purpose entities reside with the sponsor-originator or with the special purpose entity.
While we know that financial statements prepared under proportionate consolidation provide DuPont Ratios that better predict future return on shareholders’ equity than do financial statements prepared under the equity method (Graham et al., 2003), and additional information presented by venturers about their interests in joint ventures provides useful information for investors (Lim et al., 2003; Bauman, 2003; Kothavala, 2003 and Soonawalla, 2005), another fundamental question has not yet been adequately addressed. This question concerns whether the stock market views the venturer’s share of JCEs’ assets and liabilities, respectively, as part of the venturer’s assets and liabilities. A positive answer to this question allows us to remove the main argument presented against the proportionate consolidation.
3 Our analysis is conducted in the European setting where firms applying International Financial Reporting Standards (IFRS) are allowed to use either the equity method or proportionate consolidation and are required to disclose in the Notes the information needed to compute financial data as if the alternative method was chosen. We select two European countries whose firms were required to use different reporting method for interests in JCEs before the mandatory adoption of IFRS by 2005: U.K. and France. The final sample is composed of 110 French and 162 U.K. firm-year observations. The key valuation model is one that includes measures of the venturer’s assets, liabilities and net income and also measures of the venturer’s share of JCEs’ assets and liabilities. The models are estimated with industry fixed effects. In order to solve the heteroscedasticity problems of the observed errors, and following Easton and Sommers (2003), we estimate the models via a weighted least squares regression (WLS - the weight variable is the share price).
Our findings are based on comparisons of asset and liability coefficients and they suggest that the market views the venturer’s share of JCEs assets and liabilities similarly to the assets and liabilities of the venturer. Thus, we provide some support for the adoption of proportionate consolidation as a feasible alternative to the equity method.
Furthermore, the results of our study provide a useful contribution to the international debate on this issue, including to the IASB’s joint convergence project aimed at finding a consensual solution and removing the option of accounting for interests in JCEs from IAS 31.
The remainder of the paper is organized as follows. Section 2 provides an overview of the alternative reporting methods for interests in JCEs. Section 3 describes the related research. Section 4 describes the research design. Section 5 presents the findings and, finally, section 6 presents a summary and some concluding remarks.
2
2.. RREEPPOORRTTIINNGG MMEETTHHOODDSS FFOORR IINNTTEERREESSTTSS IINN JJOOIINNTTLLYY CCOONNTTRROOLLLLEEDD E
ENNTTIITTIIEESS
This section begins by describing the international rule of accounting for joint ventures. Section 2.2 analyzes the two methods required or allowed to report interests in Jointly Controlled Entities (JCEs), namely the equity method and proportionate consolidation. Section 2.3 provides a theoretical discussion on this subject. Finally, section 2.4 presents and discusses the IASB’s Exposure Draft 9 – Join Arrangements (ED 9).
2.1 International Rule of Accounting for Joint Ventures
The international standard on joint ventures - IAS 31: Interests in Joint Ventures - was issued by the IASB in 1990, but has since been revised numerous times, the last of which was in July 2009.
According to this standard, a joint venture is a contractual arrangement whereby two or more parties undertake an economic activity that is subject to joint control. Joint control is the contractually agreed sharing of control over an economic activity, and exists only when the strategic financial and operating decisions relating to the activity require the unanimous consent of the parties sharing control.
The IAS 31 identifies three types of joint ventures, Jointly Controlled Operations (JCOs), Jointly Controlled Assets (JCAs) and finally Jointly Controlled Entities (JCEs).
JCOs involve the use of assets and other resources of the venturers rather than the establishment of a separate entity. Each venturer uses its own assets and has its own inventory, incurs its own expenses and liabilities and raises its own finance, which represent its own obligations. IAS 31 requires that the venturer’s financial statements recognize the assets that it controls, the liabilities that it incurs, the expenses that it incurs, and its share of the income from the sale of goods or services by the joint venture.
JCAs involve the joint control, and often the joint ownership, by the venturers of assets dedicated to the joint venture. Each venturer may take a share of the output from the assets and each bears an agreed share of the expenses incurred. These joint ventures
5 also do not need to establish a separate entity. IAS 31 requires that the venturer’s financial statements recognize its share of the joint assets, any liabilities that it has incurred directly and its share of any liabilities incurred jointly with the other venturers, income from the sale or use of its share of the output of the joint venture, its share of expenses incurred by the joint venture and expenses incurred directly due to its interest in the joint venture.
Finally, JCEs are a joint venture involving the establishment of a separate entity in which each venturer has an interest under a contractual arrangement that establishes joint control over the entity. Each venturer usually contributes cash or other resources to the jointly controlled entity. The IAS 31, revised in 2003, allows firms to apply the equity method or proportionate consolidation to report interests in JCEs but recommends the use of proportionate consolidation4. This method is preferred on the grounds that it better reflects the substance and economic reality of a venturer’s share of the future economic benefits.
2
2..22TThheeEEqquuiittyyMMeetthhoodd vveerrssuussPPrrooppoorrttiioonnaatteeCCoonnssoolliiddaattiioonn
According to the equity method, interests in JCEs should be reported as an asset in the venturer’s Balance Sheet. They should be measured initially at its cost and subsequently adjusted to reflect the venturer’s share of changes in the JCEs’ net assets. Thus, interests in JCEs are reported in a similar way to investments in associates. According to proportionate consolidation, the venturer’s Balance Sheet should not report interests in JCEs as an asset but the venturer’s share of JCEs’ assets and liabilities as the venturer’s assets and liabilities. Thus, interests in JCEs are reported in a similar way to interests in jointly controlled assets and in jointly controlled liabilities.
4 In the previous versions of this standard, proportionate consolidation is explicitly identified as the recommended method while the equity method is viewed as a acceptable alternative treatment.
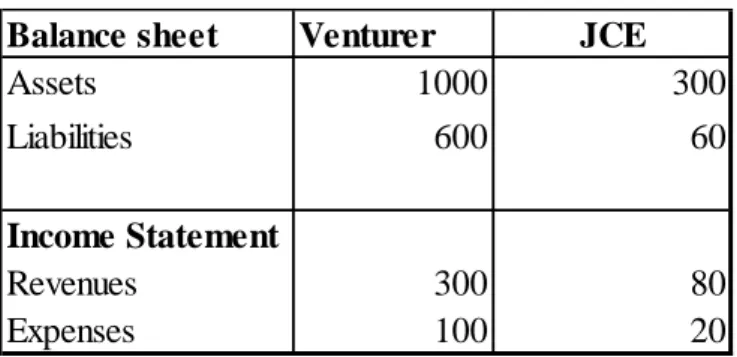
Figure 1 shows the difference in Balance Sheet and Income Statement between the adoption of the equity method and proportionate consolidation, considering a venturer with a 50% interest in a JCE. The difference is shown in grey.
FIGURE 1
Proportional Consolidation versus equity method: Example of balance sheet and income statement
Balance sheet Venturer JCE
Assets 1000 300
Liabilities 600 60
Income Statement
Revenues 300 80
Expenses 100 20
Proportionate Consolidation Equity Method
Assets (1000+50%*300) 1150 Other Assets 1000
Investment in Joint Venture ((300-60)*50%) 120
Total Assets 1150 Total Assets 1120
Shareholders' equity 520 Shareholders' equity 520
Liabilities (600+50%*60) 630 Liabilities 600
Liabilities plus shareholders' equity 1150 Liabilities plus shareholders' equity 1120
VENTURER INCOME STATEMENT
Proportionate Consolidation Equity Method
Revenues (300+50%*80) 340 Revenues 300
Expenses (100+50%*20) 110 Expenses 100
Share of joint venture income ((80-20)*50%) 30
Net income 230 Net income 230
VENTURER BALANCE SHEET
As we can see in Figure 1, the Balance Sheet according to the equity method presents the interest in the JCE in one single line. This does not occur in the proportionate method, where the venturer´s share of financial statement items of each JCE is combined on a line-by-line basis with its counterpart in venturer’s financial statements. This is also the case in the Income Statement.
7 Figure 1 also demonstrates that the total assets and total liabilities are both higher using proportionate consolidation than the equity method, but shareholder’ equity is the same in both methods. Similarly, the venturer’s revenues and expenses are higher when using proportionate consolidation, but both methods produce the same net income.
This could have a significant impact on ratios such as leverage and operating return, since these ratios (leverage – total liabilities / shareholders' equity; operating return – operating / sales) are based on different amounts depending on the method chosen. However the return of equity (return of equity – profit / equity last year) is not affected by the reporting method.
2
2..33TThheeoorreettiiccaallDDiissccuussssiioonnoonntthheeAAccccoouunnttiinnggMMeetthhooddffoorrIInntteerreessttssiinnJJCCEEss
Interests in JCEs have increased greatly in recent years, due to firms’ internalization (Graham et al., 2003), but the comparability of financial information is difficult with the options available around the world. Thus, consensus must be found on the best way of accounting for this kind of investment.
When the equity method is applied “interests in JCEs are similar to investments in
associates, since the venture has a measure of responsibility for the performance of the joint venture and its return on investment” (Stoltzfus and Epps, 2005: 171).
Proponents of equity method say that there is no reason to join the JCEs’ assets and liabilities with the venturer’s assets and liabilities, because the venturer does not really control the interests in the JCEs. Thus, to report JCEs by proportionate consolidation is not consistent with the definition of assets and liabilities presented in the conceptual framework, i.e., the JCEs’ assets are not controlled by the venture. The same conclusion would be reached by controlling benefits (Nobes, 2002). In the same way, as the venturer does not have a legal obligation to pay the JCEs’ debts, it should not report them as the venturer’s liabilities (Bauman, 2003). Milburn and Chant contend that the investor cannot control pro-rata shares of JCE’s assets and liabilities, yet proportionate consolidation portrays financial statements as if the investor could (Kothavala, 2003).
When proportionate consolidation is applied, the underlying idea of the venturer’s financial statement is that venturer controls a share of the JCE’s assets and liabilities.
Proponents of proportionate consolidation believe that the equity method masks the magnitude of the debt of the JCEs (Stoltzfus and Epps, 2005). Some argue that JCEs’ debt is often the responsibility of the investor and equity accounting offers firms an opportunity to use JCEs as a mean of off-balance sheet financing (Kothavala, 2003).
We can question whether it is coherent to report associated companies and JCEs in the same way. While it is true that both are detained at 20% to 50%, the control is not shared equally. It is therefore important to understand if these types of investments must be reported differently (Soonawalla, 2005), i.e., “joint ventures are still seen as special
case of associates, or associates are seen as a less formal type of joint venture” (Nobes,
2002: 34). Barth et al. (2001) conclude that aggregated accounting amounts that diminish the information used to predict future earnings and value the firm reduce the forecasting and value relevance of financial statements, respectively. Hence, it is essential to understand the consequences of aggregate information on the balance sheet and income statement of JCEs.
2
2..44TThheeIIAASSBB’’ssEExxppoossuurreeDDrraaffttoonnJJooiinnttVVeennttuurreess
In response to the pressure to eliminate international differences, the IASB started a short-term project in 2002 to achieve convergence by removing the option of accounting for interests in JCE using either the equity method or proportionate consolidation from IAS 31.
The Australia Accounting Standards Board (AASB) was asked to advance with an examination of the advantages and disadvantages of the different methods of accounting for interests in JCEs.
Considering the complexity and the importance of this topic, in 2003 the IASB decided not to act in the short-term but rather that the AASB should take the responsibility for a broader and long-term research project on joint venture arrangements. However, in 2004, the IASB asked the AASB to divide the project in two parts, (i) a short-term project aimed at obtaining convergence in the accounting for interests in JCEs by removing the option of accounting for interests in JCEs from IAS 31 and (ii) a long-term research project dealing with issues identified in the research team’s project proposal.
9 The AASB expressed concern over its ability to carry out the short-term convergence project without having first completed the research project, because deciding on whether to retain the option to use the equity method or proportionate consolidation would depend on a proper understanding of the nature of interests in joint ventures.
Finally, as the pressure to eliminate international differences is very strong, the IASB decided to (i) remove the short-term convergence project from the AASB and conduct this project through the IASB and FASB joint convergence project team and (ii) ask the AASB to develop and accelerate the long-term and more fundamental review of joint venture arrangements.
Thus, in 2007, the IASB issued the Exposure Draft 9 – Join Arrangements (ED 9), which proposes the elimination of proportionate consolidation from IAS 31. Comment Letters could be sent until 11 January 2008.
The IASB received 113 Comments Letters available in its site, sent mainly by large accounting or financial associations, large companies and large auditing firms. Graph 1 shows the statistics of Comment Letters against or in favor of the removal of proportionate consolidation.
GRAPH 1
Statistics of Comment Letters against or in favor of the removal of proportionate consolidation
39%
2%
59%
Against to the removal of proportionate consolidation
In favour of the removal of proportionate consolidation Without opinion
The majority of the Comment Letters are against the removal of proportionate consolidation. They usually argue that ED 9 does not explain the reason why the equity method is better than proportionate consolidation. Furthermore, the argument that proportionate consolidation is becoming controversial with the definitions of assets and liabilities is not a sufficient for its elimination. It was also noted that joint control was different from significant influence, the reason interests in JCEs and investments in associates should not be reported in the same way.
The ED 9 argues that the elimination of proportionate consolidation is necessary in order to achieve international convergence, but many Comment Letters stated that convergence does not result in elimination because proportionate consolidation is permitted in the U.S. extractive industry.
On analyzing the 67 Comments Letters against the removal of proportional method, we found that 6 were sent by English entities, 11 were sent by French entities and 4 are came from large international auditors. As for the Comments Letters that in favor of eliminating proportionate consolidation, we found that 9 were sent by English entities and that 2 came from large international auditors. No French entities support the elimination of proportionate consolidation. Graph 2 shows the number of English/French entities and large international auditors supporting and not supporting the removal of proportionate consolidation.
11 GRAPH 2
Numbers of English/French entities and large international auditors supporting or not supporting the elimination of proportionate consolidation
6
911
04
2 0 2 4 6 8 10 12English entities French entities Large international
Auditors
Against to the removal of proportionate consolidation In favour of the removal of proportionate consolidation
3
3..RREELLAATTEEDDRREESSEEAARRCCHH
The accounting literature includes some previous studies on joint ventures and related matters (e.g. Bierman, 1992; Graham et al., 2003; Kothavala, 2003; Bauman, 2003; Lim et al., 2003; Soonawalla, 2005; Stoltzfus and Epps, 2005; Bauman, 2007; O’Hanlon and Taylor, 2007; Lourenço and Curto, 2010)
Bierman (1992) developed a study to find whether proportionate consolidation should be used for all material inter-corporate common stock investments. He concludes that the main benefit of proportionate consolidation is that it eliminates an arbitrary boundary between investments that are consolidated and those that are not. The author also demonstrates that a higher amount of debt is included in the Balance Sheet in proportionate consolidation. Therefore, this amount does not appear unless proportionate consolidation is applied.
Graham et al. (2003) investigate how far Canadian firm’s financial statements presented by using proportionate consolidation versus pro forma financial statements prepared by using the equity method can predict future return on equity. This study is based on the differences in the incremental explanatory power of DuPont ratios computed by each method to predict the next year’s return on equity, in addition to the current period’s return on equity. These authors found evidence that the DuPont ratios better predict future return on equity when they are based on proportionate consolidation rather than the equity method. In other words the results of this study suggest that for joint ventures in Canada the proportionate consolidation method provides incremental information content beyond that provided by the equity method.
Kothavala (2003) investigates the relative information content of the equity method and proportionate consolidation to explain market risk in a sample of Canadian firms. In this study, Kothavala uses share price volatility and bond ratings as market benchmarks and investigates their association with accounting ratios (debt-to-equity, return on assets, variability of the return on assets, profit margin, and revenue volatility) calculated using the equity method and proportionate consolidation. It has been demonstrated that the accounting ratios selected by the author have an association with
13 market risk and the size of these ratios is affected by the accounting method used. The author finds that proportionate consolidated financial statements are more risk relevant than equity method statements for explaining price volatility, whereas equity method statements are more risk relevant than those using proportionally consolidation for explaining bond ratings. The author also finds that supplementary disclosures on joint ventures provide information that is incrementally informative for explaining risk, so and therefore the failure to disclose disaggregated joint venture accounting figures mask information that could help market participants assess risk.
Bauman (2003) examines financial analysis and valuation issues caused by off-balance-sheet activities that are not fully reported under equity method accounting for a sample of U.S. manufacturing firms. The author found that an aggregated presentation of investee information frequently hinders a correct estimation of off-balance-sheet assets and liabilities. The author also examines the financial statement impact of equity method investees on enterprises that provide investee financial data and the results show that market participants put better weight on off-balance-sheet liabilities than assets for firms that explicitly guarantee investee obligations.
Lim et al. (2003) investigate whether the disclosure of supplementary information about joint ventures in Singapore firms is associated with a decline in information asymmetry among market participants. Singapore has been governed by the Statement of Accounting Standard (SAS) No. 29, which is equivalent to IAS No. 31. Thus, both the equity method and proportionate consolidation are allowed in Singapore. The authors present two hypotheses. First, firms that disclose supplementary information for joint ventures after the issuance of SAS No. 29 will have lower bid-ask spreads compared to the bid-ask spreads before the issuance of SAS No. 29. Second, the larger the investment in joint ventures by firms, the greater the reduction in the bid-ask spreads. The results of this study show that disclosure of supplementary information for joint ventures is associated with a marked decline in bid-ask spreads and when the investment in joint ventures is significant this decline is larger. In conclusion, supplementary information about joint ventures could reduce information asymmetry.
Soonawalla (2005) uses a comparative analysis of Canadian, UK and US data to investigate the potential loss of forecasting and valuation relevant information from failing to provide a detailed disaggregated Income Statement and Balance Sheet information. In other words, this study analyzes whether financial statement information
relating to joint ventures and associates is relevant for earnings forecasting and equity valuation. The author bases inferences on the association between recognized amounts for various Income Statement and Balance Sheet components, and current share prices and future earning, to address the following questions: (1) Is there a loss of information for earnings forecasting and equity valuation when joint venture earnings are aggregated with earnings from associates, and joint venture investment values are aggregated with associate investment values? (2) Is there a loss of information for forecasting and valuation purposes when joint venture revenues and expenses are aggregated together as joint venture earnings?
The author finds that aggregating joint venture and associate earnings does not appear to suppress earnings forecasting and valuation relevant information, but aggregating joint venture and associate investment book value figures, revenues and expenses, does suppress forecasting and valuation relevant information, so the failure to report disaggregated information on joint ventures and associates masks information that is potentially useful to financial statement users, because each leads to loss of forecasting and valuation relevant information. The evidence of this study suggests that accounting regimes that require more detailed accounting information on joint ventures and associates place different forecasting for shareholders.
Stoltzfus and Epps (2005) examine bond risk premiums to determine whether creditors of companies with investments in joint ventures interpret the joint venture debts as if they belonged to the co-venturer. The authors stated that according to the equity method the amount of potential loss from an investment in a joint venture is limited to the investment and the proportionate consolidation suggests that the operations of the joint venture and the venturer are interdependent. If creditors view joint venture debts using the legal interpretation, bond risk measures should ignore the off-balance sheet joint venture debts because the company’s loss is limited to the original investment. On the other hand, if creditors view joint venture debt using the implicit model, bond risk measures should adjust for the off-balance sheet debts. The study also examines whether bond risk premiums are more strongly associated with accounting figures from proportionate consolidation than equity method accounting. In this study Stoltzfus and Epps also compare the explanatory power of a bond risk model in proportionate consolidation and in the equity method.
15 The study shows that approximately half of equity investments reported in
Compustat with year endings from May 1, 1997 to April 30, 1998 represent investments
in joint ventures. In this market, joint ventures can appear to offer an attractive option for companies looking to increase and keep debt off the balance sheet. The results of this study suggest that there is no need to identify additional joint venture information in the report because the creditors do not get better information with accounting data based on proportionate consolidation. But the findings change when companies have a guarantee of the debt, because they suggest that proportionate consolidation would give more value-relevant information to creditors when companies guarantee the debt of the joint venture. In conclusion, Stoltzfus and Epps’ study indicates that for joint ventures where the venturers guarantee the debt, the choice of the equity method over proportionate consolidation would not be in the best interest of users of financial statements and the equity method can mask information that could help market participants more accurately assess risks.
Bauman (2007) provides additional evidence on the association between bond ratings and figures in financial statements under proportionate consolidation versus the equity method. Using a sample of U.S. manufacturing firms with significant influence equity investments, in contrast to Kothavala (2003), Bauman demonstrate that pro forma proportionately consolidated financial statements are more relevant than equity method statements for explaining bond ratings. The author said that the result is attributed to greater sample homogeneity.
O’Hanlon and Taylor (2007) examine the value relevance of disclosures of liabilities of equity-accounted investees to investors in the investor firm in a sample of UK firms in the six years immediately following the major increase in disclosure requirements resulting from FRS 9. The findings of the study show that disclosures of liabilities of equity-accounted investees are negatively associated with the market value of the equity of the investor firm. They also examines whether value-relevance regression coefficients on investee-liability disclosures are more negative for joint ventures than for associates. The results identify little evidence that the negative valuation impact of liability disclosures is stronger for joint venture investees overall than for associate investees, or stronger for guarantee cases overall than for non-guarantee cases overall.
Lourenço and Curto (2010) analyze the determinants of choice between alternative reporting methods for interests in JCE. The study is conducted in the U.K. setting
where, due to the transition to IFRS, firms had to change their reporting method for interests in jointly controlled entities from the gross equity method to the equity method or to proportionate consolidation. They support the analysis on the classification of JCEs in Scale and Link proposed by Hennart (1988). The results of this study suggest that the type of jointly controlled entity plays an important role in the management decision to report interests in jointly controlled entities using the equity method or proportionate consolidation.
An analysis of previous literature indicates that there is some evidence supporting proportionate consolidation over the equity method.
17 4
4..RREESSEEAARRCCHHDDEESSIIGGNN
4
4..11SSaammpplleeaannddddaattaa
The empirical analysis is conducted in the European setting where the IAS 31 allows firms to choose between the equity method and proportionate consolidation to report interests in JCE but requires them to disclose the information needed to compute financial data as if the alternative method was chosen. We select two European countries whose firms were required to use different reporting methods for interests in JCEs before the mandatory adoption of IFRS by 2005: U.K. and France. In the U.K. firms were required to use a procedure similar to the equity method while in France the law required proportionate consolidation.
Our analysis relies on the listed firms obliged to apply IFRS by the financial year beginning on or after 1 January 2005 and comprises the first three years of mandatory adoption of IFRS. The name and the website of each of these firms are drawn from the Thomson Worldscope Database. We started by collecting the annual consolidated financial statements presented according to IFRS from the firms’ website. We then selected only those firms which report interests in JCEs in at least one of the years presented according to IFRS. We select only the U.K. firms applying the equity method and the French firms using proportionate consolidation.5 Our aim is to determine whether the results are in sensitive to the method actually used by the firms under analysis.
Firms with no data available for all the variables are excluded from the sample. To mitigate effects of influential observations, we exclude all the observations whose absolute value of studentized residual is larger than 1,5. The final sample is composed of 110 French and 162 U.K. firm-year observations. The accounting data are from the firms’ annual reports which were hand-collected from the firms’ websites. The share prices and the number of shares are from the Worldscope database.
5 We found that firms usually do not change the status quo. Thus, in the U.K, the majority of firms choose to apply the equity method while in France almost all firms use proportionate consolidation in the IFRS period. This finding is similar to that of Mueller et al. (2008) for investment property.
Empirical models
Our research question is whether the market views the venturers’ share of JCEs’ assets and liabilities as assets and liabilities of the venturer or whether the risks and rewards associated with the venturers’ share of JCEs’ assets and liabilities reside with the JCEs. We address this question by estimating a cross-sectional valuation model based on that used in Landsman et al. (2008). That study addresses a different but economically similar research question, i.e., whether the risks and rewards associated with the transferred assets and the debt issues by special purpose entities reside with the sponsor-originator or with the special purpose entity. Following Landsman et al. (2008), we begin by estimating a benchmark regression given by Equation (1).
it it01Ait2Lit3NIit
P (1)
where P is the share price as of three months after the fiscal year-end6, A and L represent total assets and total liabilities respectively and NI is the net operating income. All the variables are on a per share basis.
Considering that some firms analyzed in this study report interests in JCEs by using the equity method (U.K. firms) while others apply proportionate consolidation (French firms), this benchmark regression is estimated both with financial statements data prepared using the equity method and proportionate consolidation. Thus, Equations (2) and (3) were used as the benchmark in our analysis.
it it01A_EMit2L_EMit3NIit P (2) it it01A_PCMit2L_PCMit3NIit P (3)
6 Untabulated findings reveal that our inferences are not sensitive to using prices as of fiscal year-end or as of three months after fiscal year-end.
19 where A_EM and L_EM are assets and liabilities computed by using the equity method to report interests in JCE. PCM means proportionate consolidation instead of the equity method.
In order to access whether the market views the venturers’ share of JCEs’ assets and liabilities as assets and liabilities of the venturer or whether the risks and rewards associated with the venturers’ share of JCEs’ assets and liabilities reside with the JCEs, we use a new estimating equation, Equation (4), that includes the venturer’s share of JCE’s assets and liabilities.
NI V_L JV_L JV_A V_A P 5 it L_PCM it 4 it 3 A_PCM it 2 it 1 0 it it (4)
where V_A is the venturer’s assets excluding any interest in JCEs or any venturer’s share of JCE’s assets, V_L is the venturer’s liabilities excluding any venturer’s share of JCEs’ liabilities and, finally, JV_A and JV_L are the venturer’s share of JCEs’ assets and liabilities.
However, in order to solve the multicollinearity problems resulting from a high correlation between JV_A and JV_L, we replace Equation (4) by two equations, Equations (5) and (6), each of which excludess one of these two variables,
. it it 3 it4 it A_PCM it 2 it 1 0 V_A JV_A L_PCM NI P (5) it it 4 it L_PCM it 3 it 2 it 1 0 A_PCM JV_L V_L NI P (6)
Following Landsman et al. (2008), our predictions are as follows. If the market views the venturer’s share of JCEs’ assets and liabilities in a similar way to the assets and liabilities of the venturer, then in Equation (5) 12and in Equation (6) 23 . If
the market does not view the venturer’s share of JCEs’ assets and liabilities as assets and liabilities of the venturer, then 20both in Equation (5) and (6). An intermediate
liabilities as a different kind of venturer’s assets and liabilities, for which we predict in Equation (5) 120and in Equation (6) 230.
Due to the heteroscedasticity problems of the observed errors, and following Easton and Sommers (2003), we estimate the models via a weighted least squares regression (WLS - the weight variable is the share price). The resulting regression specification no longer suffers from the coefficient bias and heteroscedasticity found in the unweighted regression.
Furthermore, models (5) and (6) are estimated with industry fixed effects. In each of the equations, we add the dummy variables Mining (SIC code 1), Utilities (SIC code 4), Retail Trade (SIC code 5), Finance and Real Estate (SIC code 6) and Services (SIC code 7 and 8) which assume the value 1 when the firm’s industry is the selected industry and 0 otherwise. These binary variables capture the unobserved variation between industries and thereby eliminate any bias which could arise. The industry reference is construction and manufacturing (SIC code 3 and 4) and therefore the overall estimated intercept corresponds to it. The estimated coefficients for the dummies Mining, Utilities, Retail Trade, Finance and Real Estate and Services are added to the overall intercept in order to compute the intercepts for each of the other five industries.
21 5
5..FFIINNDDIINNGGSS
Descriptive statistics
Table 1 presents the descriptive statistics of the variables included in equations (2), (3), (5) and (6), including both the amounts deflated by the number of shares and the amounts deflated by the market price.
TABLE 1
Descriptive Statistics for the 110 French and the 162 U.K. Observations
Panel A: Amounts in pounds deflated by the number of shares
P A_EM L_EM A_PCM L_PCM V_A JV_A JV_L NI
France Mean 66,04 238,45 209,26 253,70 224,51 228,38 25,32 15,25 3,79 Median 45,55 73,51 49,78 85,63 55,85 69,65 2,41 1,47 2,46 Std. Dev. 96,10 577,86 564,16 627,98 614,25 538,34 111,96 61,69 4,37 Min. 2,07 0,44 0,21 0,49 0,26 0,45 0,00 0,00 -0,61 Max. 720,00 3675,62 3583,70 4110,13 4018,21 3263,04 847,09 474,46 26,44 UK Mean 5,51 6,95 4,48 7,46 4,98 6,82 0,64 0,50 0,39 Median 4,50 5,43 3,25 5,80 3,50 5,28 0,17 0,08 0,28 Std. Dev. 4,18 5,98 4,48 6,55 5,17 5,90 1,27 1,19 0,49 Min. 0,26 0,23 0,06 0,25 0,08 0,23 0,00 0,00 -0,74 Max. 20,75 30,71 25,70 38,98 33,99 30,72 8,44 8,29 3,57
Panel B: Amounts deflated by the market price
A_EM L_EM A_PCM L_PCM V_A JV_A JV_L NI
France Mean 3,51 3,02 3,73 3,23 3,38 0,34 0,21 0,06 Median 1,61 1,19 1,71 1,26 1,54 0,06 0,04 0,05 Std. Dev. 6,03 5,93 6,39 6,29 5,73 1,03 0,56 0,03 Min. 0,11 0,05 0,12 0,06 0,11 0,00 0,00 -0,03 Max. 34,64 33,78 38,74 37,87 30,75 7,98 4,10 0,17 UK Mean 1,33 0,88 1,43 0,97 1,30 0,12 0,10 0,06 Median 1,24 0,71 1,30 0,74 1,19 0,04 0,03 0,06 Std. Dev. 0,62 0,56 0,69 0,64 0,61 0,21 0,19 0,07 Min. 0,42 0,12 0,44 0,13 0,43 0,00 0,00 -0,51 Max. 4,50 3,77 4,87 4,14 4,41 1,21 1,17 0,32
P: share price as of three months after fiscal year-end; A_EM: total assets computed by the equity method;
L_EM: total liabilities computed by the equity method (= V_L); A_PCM: total assets computed by proportionate consolidation; L_PCM: total liabilities computed by proportionate consolidation;
V_A: venturer’s assets excluding any interest in JCEs and any venturer’s share of JCEs’ assets;
JV_A: venturer’s share of JCEs’ assets; JV_L: venturer’s share of JCEs’ liabilities; NI: Net operating income.
The amounts reported in Table 1 show that, in terms of means, JV_A and JV_L are approximately 10% of V_A and V_L, respectively. Thus, the aggregation of the venturer’s assets and liabilities with the venturer’s share of JCEs’ assets and liabilities has a significant economic effect.
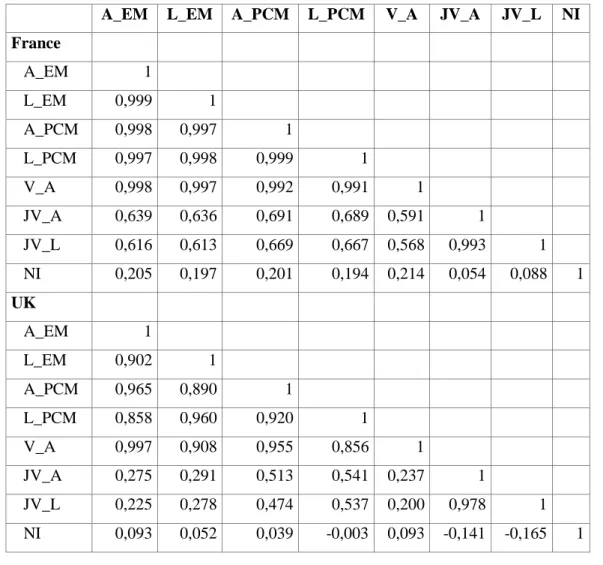
23 Table 2 presents the correlations for the variables used in the four regressions. The amounts reported indicate that the asset and liability measures are highly correlated with each other.
TABLE 2 Correlations
A_EM L_EM A_PCM L_PCM V_A JV_A JV_L NI
France A_EM 1 L_EM 0,999 1 A_PCM 0,998 0,997 1 L_PCM 0,997 0,998 0,999 1 V_A 0,998 0,997 0,992 0,991 1 JV_A 0,639 0,636 0,691 0,689 0,591 1 JV_L 0,616 0,613 0,669 0,667 0,568 0,993 1 NI 0,205 0,197 0,201 0,194 0,214 0,054 0,088 1 UK A_EM 1 L_EM 0,902 1 A_PCM 0,965 0,890 1 L_PCM 0,858 0,960 0,920 1 V_A 0,997 0,908 0,955 0,856 1 JV_A 0,275 0,291 0,513 0,541 0,237 1 JV_L 0,225 0,278 0,474 0,537 0,200 0,978 1 NI 0,093 0,052 0,039 -0,003 0,093 -0,141 -0,165 1
A_EM: total assets computed by the equity method;
L_EM: total liabilities computed by the equity method (= V_L); A_PCM: total assets computed by proportionate consolidation; L_PCM: total liabilities computed by proportionate consolidation;
V_A: venturer’s assets excluding any interest in JCEs and any venturer’s share of JCEs’ assets;
JV_A: venturer’s share of JCEs’ assets; JV_L: venturer’s share of JCEs’ liabilities; NI: Net operating income.
25 Regression results
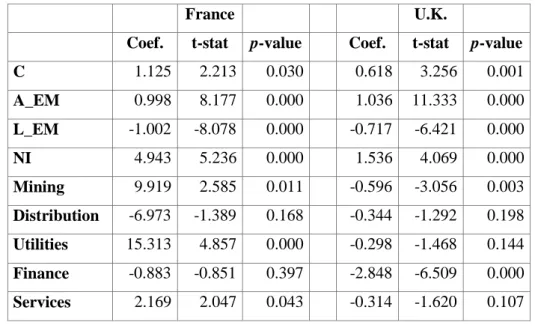
Table 3 presents regression summary statistics associated with the WLS estimation of Equations (2) and (3), including the estimated coefficients for the country fixed effects dummy variables. The estimates for all the balance sheet coefficients are statistically significant and they have the expected sign.
TABLE 3
Benchmark Model Regressions
Panel A: Equity Method
it it 8 it 7 it 6 it 5 it 4 it 3 it 2 it 1 0
it α α Mining α Distribution α Utilities α Finance α Services α A_EM α L_EM α NI ε
P
France U.K.
Coef. t-stat p-value Coef. t-stat p-value
C 1.125 2.213 0.030 0.618 3.256 0.001 A_EM 0.998 8.177 0.000 1.036 11.333 0.000 L_EM -1.002 -8.078 0.000 -0.717 -6.421 0.000 NI 4.943 5.236 0.000 1.536 4.069 0.000 Mining 9.919 2.585 0.011 -0.596 -3.056 0.003 Distribution -6.973 -1.389 0.168 -0.344 -1.292 0.198 Utilities 15.313 4.857 0.000 -0.298 -1.468 0.144 Finance -0.883 -0.851 0.397 -2.848 -6.509 0.000 Services 2.169 2.047 0.043 -0.314 -1.620 0.107
Panel B: Proportionate Consolidation
it it it
it Mining Distribution Production Finance Services A_PCM L_PCM NI
P 0 1 it 2 it 3 it 4 it 5 it 6 it 7 8
France U.K.
Coef. t-stat p-value Coef. t-stat p-value
C 1.125 2.213 0.030 0.656 3.540 0.001 A_PCM 0.998 8.165 0.000 1.018 11.285 0.000 L_PCM -1.001 -8.070 0.000 -0.726 -6.762 0.000 NI 4.938 5.233 0.000 1.628 4.436 0.000 Mining 9.932 2.589 0.011 -0.682 -3.570 0.001 Distribution -6.921 -1.377 0.172 -0.407 -1.555 0.122 Utilities 15.324 4.862 0.000 -0.312 -1.567 0.119 Finance -0.881 -0.848 0.399 -2.836 -6.597 0.000 Services 2.170 2.048 0.043 -0.350 -1.842 0.067
A_EM: total assets computed by the equity method;
L_EM: total liabilities computed by the equity method (= V_L); A_PCM: total assets computed by proportionate consolidation; L_PCM: total liabilities computed by proportionate consolidation; NI: Net operating income.
27 Tables 4 and 5, Panel A, present regression summary statistics associated with the WLS estimation of Equations (5) and (6), which permit the coefficients on JV_A and JV_L to differ. Panel B shows the results of the Wald test, developed in order to test the equality restriction of the JV_A (JV_L) and V_A (V_L) coefficients. As we do not reject the null hypothesis that the estimates for the two coefficients are identical (France: p-value = 0.916 for the assets coefficients and p-value = 0.928 for the liabilities coefficients; UK: p-value = 0.888 for the assets coefficients and p-value = 0.651 for the liabilities coefficients), we conclude that the marginal effect on the dependent variable is statistically the same for the two independent variables, both in the assets and in the liabilities analysis. These results suggest that investors view the venturer’s share of JCEs’ assets and liabilities as belonging to the venturer and, thus, support the adoption of proportionate consolidation as a feasible alternative to the equity method.
TABLE 4
Extended Model Regressions (desegregation of assets)
Panel A: Regression results
0 1 it 2 it 3 it 4 it 5 it
it α α Mining α Distribution α Utilities α Finance α Services
P it it 9 it 8 it 7 it 6V_A α JV_A α L_PCM α NI ε α France U.K.
Coef. t-stat p-value Coef. t-stat p-value
C 1.127 2.204 0.030 0.654 3.480 0.001 V_A 0.998 8.109 0.000 1.019 11.219 0.000 JV_A 1.003 7.772 0.000 1.005 5.862 0.000 L_PCM -1.001 -8.029 0.000 -0.724 -6.646 0.000 NI 4.954 5.160 0.000 1.622 4.320 0.000 Mining 9.906 2.564 0.012 -0.678 -3.439 0.001 Distribution -7.072 -1.347 0.181 -0.405 -1.531 0.128 Finance -0.882 -0.845 0.400 -2.836 -6.575 0.000 Utilities 15.298 4.815 0.000 -0.311 -1.557 0.122 Services 2.166 2.033 0.045 -0.348 -1.818 0.071
Panel B: Test of coefficients equality results
Restriction Wald test p-value
France α7α8 0.011 0.916
UK α7α8 0.008 0.928
L_PCM: total liabilities computed by proportionate consolidation;
V_A: venturer’s assets excluding any interest in JCEs and any venturer’s share of JCEs’ assets;
JV_A: venturer’s share of JCEs’ assets; NI: Net operating income.
29 TABLE 5
Extended Model Regressions (desegregation of liabilities)
Panel A: Regression results
0 1 it 2 it 3 it 4 it 5 it
it α α Mining α Distribution α Utilities α Finance α Services
P it it it it 6A_PCMit 7V_L 8JV_L 9NI France U.K.
Coef. t-stat p-value Coef. t-stat p-value
C 1.127 2.205 0.030 0.670 3.558 0.001 A_PCM 0.998 8.108 0.000 1.017 11.251 0.000 V_L -1.001 -8.028 0.000 -0.737 -6.677 0.000 JV_L -0.990 -6.636 0.000 -0.659 -3.610 0.000 NI 4.953 5.192 0.000 1.662 4.425 0.000 Mining 9.894 2.561 0.012 -0.704 -3.565 0.001 Distribution -7.110 -1.360 0.177 -0.420 -1.589 0.114 Finance -0.893 -0.852 0.396 -2.833 -6.571 0.000 Utilities 15.293 4.817 0.000 -0.316 -1.580 0.116 Services 2.166 2.033 0.045 -0.361 -1.880 0.062
Panel B: Test of coefficients equality results
Restriction Wald test p-value
France α8α9 0.020 0.888
UK α8α9 0.205 0.651
A_PCM: total assets computed by proportionate consolidation;
V_L: venturer’s liabilities excluding any venturer’s share of JCEs’ liabilities; JV_L: venturer’s share of JCEs’ liabilities;
6
6..SSUUMMMMAARRYYAANNDDCCOONNCCLLUUSSIIOONNSS
There is no international consensus on the appropriate reporting method for interests in JCE’s. The key question underlying this subject is whether the risks and rewards associated with the venturers’ share of JCE’s assets and liabilities reside with the venturer or with the JCE. Proportionate consolidation is the preferable method in the first case; the equity method should be used whether the second scenario is true.
Our study addresses a gap in the accounting literature by investigating whether the market views the venturers’ share of JCE’s assets and liabilities as assets and liabilities of the venturer or whether the risks and rewards associated with the venturers’ share of JCE’s assets and liabilities reside with the JCE’s. We answer this question by estimating a cross-sectional valuation model based on that used in Landsman et al. (2008). We support our analysis in the European setting where venturers are allowed to apply either the equity method or proportionate consolidation and are required to disclose in the Notes the information needed to compute financial data as if the alternative method were chosen.
The results of this study suggest that investors view the venturer’s share of JCE’s assets and liabilities similarly to the assets and liabilities of the venturer and thus support the adoption of proportionate consolidation as a feasible alternative to the equity method.
31 R
REEFFEERREENNCCEESS
Accounting Principles Board (1971) APB Opinion 18: The Equity Method of Accounting for Investments in Common Stock.
Australian Accounting Standards Board (2004) Australian Accounting Standard 131, Interests in Joint Ventures.
Barth, M.E., W.H. Beaver and W.R. Landsman (2001) “The relevance of value relevance literature for financial accounting standard setting: Another View”, Journal
of Accounting and Economics, 31, No. 1-3 (September), 77-104
Bauman, M. (2003) “The impact and valuation of off-balance-sheet activities concealed by equity method accounting”, Accounting Horizons, 17, 304-314.
Bauman, M. (2007), “Proportionate Consolidation versus equity method: Additional evidence on the association with bond ratings”, International Review of Financial
Analysis, 16, 496-507.
Bierman, H. Jr. (1992) “Proportionate consolidation and financial analysis”, Accounting
Horizons, (December), 5-17.
Canadian Institute of Chartered Accountants (1994) CICA Handbook Toronto: CICA Chen, S. and Hennart, J. (2004) “A Hostage Theory of Joint Ventures: Why do Japanese
Investors Choose Partial Over Full Acquisitions to Enter the United States?”, Journal
of Business Research, 57, 1126-1134.
Elayan, F. (1993) “The announcement effect of real estate joint ventures on returns to stockholders: an empirical investigation”, Journal of Real Estate Research, 8, 13-25. Easton, P. and Sommers, G. (2003) “Scale and scale effect in market-based accounting
research”, Journal of Business Finance and Accounting, 25-55.
Etebari, A. (1993) “Market impact of announcements of joint ventures between U.S. firms and Eastern and Central European countries: early evidence”, Global Finance
Journal, 4, 103-123.
G4+1 (1999) “Reporting interests in joint ventures and similar arrangements”, G4+1 Special Report, Connecticut.
Graham, R., King, R. and Morril, C. (2003) “Decision usefulness of alternative joint venture reporting method”, Accounting Horizons, 17, 123-137.
Hennart, J. (1988) “A transaction costs theory of equity joint ventures”, Strategic
Management Journal 9, 361-374.
Hennart, J. (1991) “The transaction costs theory of joint ventures: an empirical study of Japanese subsidiaries in the United States”, Management Science, 37, 483-497.
Hennart, J. and Reddy, S. (1997) “The choice between mergers/acquisitions and joint ventures: the case of Japanese investors in the United States”, Strategic Management
Journal, 18, 1-12.
International Accounting Standards Board (2003) IAS 31: Interests in Joint Ventures. International Accounting Standards Board (2007): Exposure Draft 9 Join Arrangements. International Accounting Standards Board (2007): Exposure Draft 9 Join Arrangements
– Comment letters.
Irwanto, A., Vetter, D. and Wingender, J. (1999) “The influence of U.S. joint ventures in Asia on shareholder wealth”, Journal of Financial and Strategic Decisions, 12, 33-40.
Johnson, S. and Houston, M. (2000) “A Reexamination of the motives and gains in joint ventures”, Journal of Finance and Quantitative Analysis, 35, 67-85.
Koh, J. and Venkatraman, N. (1991) “Joint venture formations and stock market reactions: an assessment in the information technology sector”, Academy of
Management Journal, 34, 869-892.
Kothavala, K. (2003) “Proportional consolidation versus the equity method: a risk measurement perspective on reporting interests in joint ventures”, Journal of
Accounting & Public Policy, 22, 517-539.
Landsman, W., Peasnell, K. and Shakespeare, C. (2008) “Are asset securitizations sales or loans?”, Accounting Review, 83(5), 1251-1272.
Lee, I. and Wyatt, S. (1990) “The Effects of international joint ventures on shareholder wealth”, Financial Review, 25, 641-649.
Lim, C., Yeo, C. and Liu, C. (2003) “Information asymmetry and accounting disclosures for joint ventures”, International Journal of Accounting, 38, 23-39.
Lourenço, Isabel Costa and Curto, José Dias (2010) “Determinants of the Accounting Choice between Alternative Reporting Methods for Interests in Jointly Controlled Entities”, European Accounting Review, forthcoming (2010)
McConnel, J. and Nantell, T. (1985) “Corporate combinations and common stock returns: the case of joint ventures”, The Journal of Finance, 40, 519-536.
Moskalev, S. and Swensen, B. (2007) “Joint ventures around the globe from 1990-2000: forms, types, industries, countries and ownership patterns”, Review of Financial
Economics, 16, 29-67.
Nobes, Christopher (2002) “An analysis of the international development of the equity method”, Abacus, 38 , no. 1, 16-45.
33 O’Hanlon, John and Taylor, Paul (2007) “The value relevance of disclosures of
liabilities of equity-accounted investees: UK evidence”, Accounting and Business
Research, 37, No. 4, 267-284.
Park, S. and Kim, D. (1997) “Market valuation of joint ventures: characteristics and wealth gains”, Journal of Business Venturing, 12, 18-108.
Prather, L. and Min, J. (1998) “Testing of the positive-multinational network hypothesis: wealth effects of international joint ventures in emerging markets”,
Multinational Finance Journal, 2, 151-165.
Soonawalla, K. (2005) “Accounting for joint ventures and associates in Canada, UK, and US: do US rules hide information?”, Journal of Business Finance and
Accounting, 3-4, 395-417.
Stoltzfus, Ronald L. and Epps, Ruth W. (2005) “An empirical study of the value-relevance of using proportionate consolidation accounting for investments in joint ventures” Accounting Forum, 29, 169-190.