SOIL AGGREGATION AND ORGANIC CARBON OF OXISOLS
UNDER COFFEE IN AGROFORESTRY SYSTEMS
(1)Gabriel Pinto Guimarães(2), Eduardo de Sá Mendonça(3), Renato Ribeiro Passos(3) & Felipe Vaz Andrade(3)
SUMMARY
Intensive land use can lead to a loss of soil physical quality with negative impacts on soil aggregates, resistance to root penetration, porosity, and bulk density. Organic and agroforestry management systems can represent sustainable, well-balanced alternatives in the agroecosystem for promoting a greater input of organic matter than the conventional system. Based on the hypothesis that an increased input of organic matter improves soil physical quality, this study aimed to evaluate the impact of coffee production systems on soil physical properties in two Red-Yellow Oxisols (Latossolos Vermelho-Amarelos) in the region of Caparaó, Espirito Santo, Brazil. On Farm 1, we evaluated the following systems: primary forest (Pf1), organic coffee (Org1) and conventional coffee (Con1). On Farm 2, we evaluated: secondary forest (Sf2), organic coffee intercropped with inga (Org/In2), organic coffee intercropped with leucaena and inga (Org/In/Le2), organic coffee intercropped with cedar (Org/Ced2) and unshaded conventional coffee (Con2). Soil samples were collected under the tree canopy from the 0-10, 10-20 and 20-40 cm soil layers. Under organic and agroforestry coffee management, soil aggregation was higher than under conventional coffee. In the agroforestry system, the degree of soil flocculation was 24 % higher, soil moisture was 80 % higher, and soil resistance to penetration was lower than in soil under conventional coffee management. The macroaggregates in the organic systems, Org/In2, Org/In/ Le2, and Org/Ced2 contained, on average, 29.1, 40.1 and 34.7 g kg-1 organic carbon,
respectively. These levels are higher than those found in the unshaded conventional system (Con2), with 20.2 g kg-1.
Index terms: organic matter, degree of flocculation, macroaggregates, porosity.
(1) Part of the dissertation of the first author. Post-graduate program in Plant Production, Centre of Agricultural Sciences,
Federal University of Espírito Santo. Received for publication on February 15, 2013 and approved on September 25, 2013.
(2) Professor, Federal Institute of Espírito Santo - IFES, Campus Itapina. BR 259, km 70, Zona Rural - 256. CEP 29709.910,
Colatina (ES), Brazil. E-mail: [email protected]
(3) Professor, Departament of Plant Production, UFES. Alto Universitário, s/n. CEP 29500-000 Alegre (ES), Brazil. E-mail:
RESUMO:AGREGAÇÃO DO SOLO E CARBONO ORGÂNICO DE LATOSSOLOS SOB CAFEEIRO EM SISTEMAS AGROFLORESTAIS
O uso intensivo do solo pode levar à perda da sua qualidade física com impactos negativos sobre os agregados do solo, a resistência à penetração das raízes, a porosidade e a densidade do solo. Os sistemas orgânicos e agroflorestais podem representar uma alternativa sustentável de maior equilíbrio no agroecossistema, por promoverem maior aporte de matéria orgânica em relação ao sistema convencional. Partindo da hipótese que o aumento do aporte orgânico melhora a qualidade física do solo, esta pesquisa teve por objetivo avaliar o impacto de sistemas de produção de cafeeiros sobre atributos físicos do solo em dois Latossolos Vermelho-Amarelos do Território do Caparaó, Espírito Santo. Na propriedade 1, foram avaliados os sistemas: mata primária (Mp1), café orgânico (Org1) e café convencional (Con1); e, na 2: mata secundária (Ms2), café orgânico consorciado com ingá (Org/In2), café orgânico consorciado com ingá e leucena (Org/In/Le2), café orgânico consorciado com cedro (Org/Ced2) e café convencional a pleno sol (Con2). As amostras de solo foram coletadas na projeção da copa nas profundidades 0-10, 10-20 e 20-40 cm. Os cafeeiros orgânicos e agroflorestais apresentaram maior agregação em relação aos cafeeiros convencionais. O manejo agroflorestal evidenciou grau de floculação do solo 24 % superior, 80 % a mais na umidade do solo e menor resistência à penetração do solo, em relação ao manejo cafeeiro convencional. Nos macroagregados dos sistemas orgânicos (Org/In2, Org/In/Le2, Org/Ced2), foram encontrados, em média, respectivamente, 29,1; 40,1; e 34,7 g kg-1 de carbono orgânico. Esses teores são maiores que os encontrados no sistema convencional a pleno sol (Con2), que apresentou 20,2 g kg-1.
Termos de indexação: matéria orgânica, grau de floculação, macroagregados, porosidade.
INTRODUCTION
The felling and subsequent burning of forests for the planting of monocultures leads to a loss of soil quality and has impacts on soil organic matter (SOM). Therefore, management systems with some similarity to forests, e.g., agroforestry, have attracted attention due to their ability to reduce losses of nutrients, soil and water; improve the input of C, N and P; and contribute to the physical properties of soil as well (Perez et al., 2004; Wendling et al., 2011).
Soil organic matter (SOM) is one of the main aggregating agents of soil particles (Nunes et al., 2010). One of the key mechanisms responsible for preservation of SOM in conservation management systems is the formation of macroaggregates. Conversely, SOM is mineralized to a greater degree in conventional systems. This difference can be explained by the influence of SOM on the stability of macroaggregates, which are susceptible to changes brought about by soil management (Passos et al., 2007).
In addition to better aggregation, soil physical quality is higher in systems that prioritize the input of organic matter, e.g., in agroforestry and organic management, by promoting lower bulk density, resistance to penetration and greater porosity (Carvalho et al., 2004). The effect of management on soil physical properties is highly dependent on the soil texture, which affects soil resistance to a particular agricultural practice. Knowledge of clay dispersed in water (CDW) and degree of flocculation (DF) is essential for conservation studies since the CDW contributes to the formation of hardened/compact layers, and DF is related to particle aggregation, with
a direct influence on water infiltration and susceptibility to soil erosion (Campos et al., 1999; Lemos & Silva, 2005; Santos et al., 2010).
Due to the low amount of mulch in non-conservation systems, aggregates are often exposed to the action of rain, leading to fragmentation, especially of the macroaggregates. This results in an increase in the relative proportion of microaggregates due to management practices that promote a reduction in organic matter content, as well as rapid wetting and rain drop impact directly on the soil (Six et al., 2000; Cruz et al., 2003; Nunes et al., 2010).
The region of Caparaó is a microregion in Espirito Santo, Brazil of great environmental importance, containing the headwaters of three major rivers: Doce, Itapemirim and Itabapoana. The region is an important producer of Arabica coffee in the southwest of the State of Espírito Santo, but due to the mountainous terrain, soil erosion problems are intense. However, there are few studies that assess the impact of management systems on soil physical quality in this region. This study aimed to assess the impact of organic and agroforestry coffee production systems on soil physical properties in the region of Caparaó, Espirito Santo.
MATERIALS AND METHODS
Characterization of the study areas
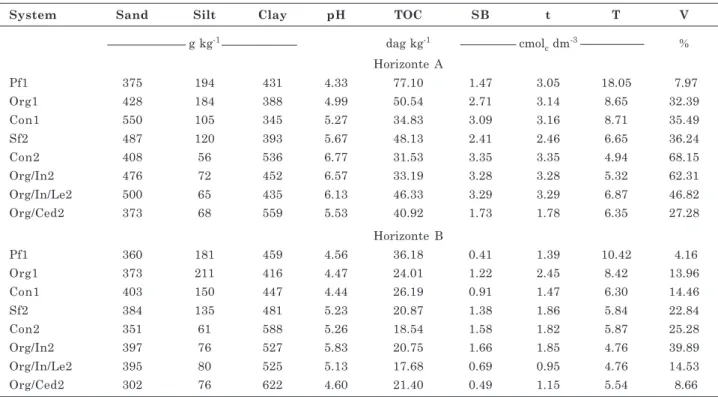
The soils of both properties are clayey texture, dystrophic Red-Yellow Oxisols (Latossolos Vermelho-Amarelo distróficos) (Table 1).
Farm 1 is located in the district of Santa Clara, in Iúna, state of Espirito Santo (20o 24' 10.5'’ S; 41o 58' 1’’ W; 839 m asl). Arabica coffee is grown on 14 ha under conventional management and on 1 ha in an organic system, both established in 2000. Before planting coffee, the area was used for 10 years as Eucalyptus forest. Eucalyptus had been planted without removing the Brachiaria decumbens that had occupied the area for 30 years.
The plot of conventional coffee covered an area of 1.2 ha with a 23 % slope, plant spacing of 2.6 × 1 m, Catuai Vermelho variety, and crop age of 11 years. After planting, management consisted of fertilization in two annual applications per coffee tree of 100 g N-P-K (20-05-20), 150 g superphosphate and 2-3 Mg ha-1 lime every two years, pest and disease control when necessary with the application of agrochemicals in the area around the crop, weed control with Glyphosate and through mowing, and hand-harvested coffee. The average yield of the conventional plantation is 28 60-kg bags ha-1.
The organic coffee plantation has a 17 % slope, plant spacing of 2.8 × 1 m, Catuai Vermelho variety and crop age of 11 years. Organic manures were applied every year and liming was repeated every two years, as indicated by soil chemical analysis. From 2001 to 2007, fertilization consisted of compost (10 dm3 per plant), with an average content of 38.9 dag kg-1 C. In 2007, jackbean (Canavalia ensiformis) was used as green manure and, from 2008 to 2011, each coffee tree was fertilized with 10 dm3 cured cattle manure (28.4 dag kg-1 C), fermented bovine urine and 10 dm3 coffee husk (49.3 dag kg-1 C). Weeds were controlled by mowing and hoeing; pests and diseases were controlled with products registered by the state certification agency and the coffee was harvested manually. The average yield of the organic system is 21 60-kg bags ha-1.
Farm 2 is 12 km away from Farm 1, in Irupi, State of Espírito Santo (20o 21' 18'’ S; 41o 40' 07'’ W; 907 m asl). Arabica coffee is grown on 9 ha under a conventional system and 2 ha under organic management intercropped with trees; both crops were planted in 1998. Before that, the area had been occupied by a coffee plantation for approximately 20 years and, prior to the coffee, it had been used as pasture for 30 years.
The conventional coffee plot covers an area of 2.4 ha with a 16 % slope, plant spacing of 3 × 2 meters, Catuai Vermelho variety and crop age of 13 years. After planting, management consisted of the application of 2-3 Mg ha-1 lime every two years in two annual applications of 150 g N-P-K (20-00-20) and 200 g superphosphate per plant. Pests and diseases were controlled by applications of agrochemicals in the area around the coffee plantation and by a mixture
called calda Viçosa (copper sulfate, calcium oxide, and macro- and micronutrients used as a fungicide and as a foliar fertilizer), weeds were controlled by mowing and glyphosate application once a year, and the coffee was harvested manually. The yield of the conventional plantation is 27 60-kg bags ha-1.
The coffee plantations under agroforestry management systems have a 17 % slope, plant spacing of 3 × 2 m, Catuai Vermelho variety, and tree age of 13 years. The land use transition process lasted three years and ended in 2005. Organic fertilization consisted of two annual applications of 8 dm3 of compost per plant (43.5 dag kg-1 C) and fermented cattle urine, as of the beginning of the conversion process. In 2006, jackbean (Canavalia ensiformis) was also planted as a green manure crop. The three agroforestry systems with coffee under organic management are: organic coffee intercropped with inga (Inga sessilis), organic coffee intercropped with inga (Inga sessilis) and leucaena (Leucaena leucocephala) and organic coffee intercropped with Australian cedar (Toona ciliata). A fourth system is unshaded conventional coffee. The intercropped species were planted between the coffee rows. Inga was planted in 2007 and leucaena planted in 2006 at a spacing of 5 × 5 m (400 trees ha-1). Cedar was planted in 2005 at a spacing of 3 × 5 m (667 trees ha-1). Weeds were controlled by mowing and hoeing. Pests and diseases were controlled with products registered by the state certification agency, and the coffee was hand-harvested. The yield of the organic coffee is 23 60-kg bags ha-1.
Management systems
The treatments consisted of two coffee management systems on Farm 1: organic (Org1) and conventional (Con1), and four coffee management systems on Farm 2: organic intercropped with inga (Org/In2); organic intercropped with leucaena and inga (Org/In/Le2); organic intercropped with cedar (Org/Ced2); and unshaded conventional (Con2), with three replications per system. On each farm, as a reference for data comparison, soil samples were collected from forest areas near the plantations. On Farm 1, samples were collected from a primary forest with no history of human disturbance (Pf1) and, on Farm 2, where there was no primary forest in the proximity of the property, an area of secondary forest (Sf2) was used, which had been set aside for revegetation in 1980, and some native Atlantic forest species had been planted.
Soil sampling
and sampling was carried out as in the coffee areas. For soil physical and chemical analysis (Table 1), three samples from the A horizon and B horizon were collected separately.
Dependent variables
Undisturbed samples were collected with an Uhland sampler (0-10, 10-20 and 20-40 cm layers) to determine bulk density (Bd), macroporosity (Pmacro) and microporosity (Pmicro). Total porosity (TP) was calculated from the expression: TP = [1-(Bd/Pd)]×100 (Vomocil, 1965). Microporosity (Pmicro) was calculated from determination of the water content of each sample corresponding to the matric potential of -6 kPa, and macroporosity was calculated (Pmacro) as the difference between TP and Pmicro (Embrapa, 1997). From the same layers, disturbed soil samples were also collected and sieved (2 mm) to obtain air-dried fine earth that was used to determine clay dispersed in water and particle density (Pd) by the method of Embrapa (1997). The degree of flocculation (DF) was obtained by the expression: DF = [(total clay - CDW)/ total clay]×100.
Soil resistance to penetration was measured using a Stolf impact penetrometer (Stolf, 1991). Analysis was performed in the dry season (August/September 2011) under the coffee canopy to a depth of 60 cm,
with a total of 15 replications per treatment. At the time of field analysis, three trenches were dug per treatment and soil samples collected (0-10, 10-20, 20-40, and 40-60 cm layers) for moisture determination. Aggregate stability was determined by the wet sieving method (0-10 and 10-20 cm layers) in soil samples collected in the form of clods. In the laboratory, the samples were carefully crumbled by hand, sieved through a 4.0 mm mesh and retained in a 2.0 mm sieve. For analysis, we used the wet-sieving apparatus to separate five aggregate sizes: 4-2 mm, 2-1 mm, 1-0.5 mm, 0.5-0.25 mm, and <0.25 mm, as described by Embrapa (1997). The classes 4-2 mm, 2-1 mm, 1-0.5 mm and 0.5-0.25 mm were considered macroaggregates and class <0.25 mm as microaggregates. The data obtained were used to calculate the geometric mean diameter (GMD) and the weighted mean diameter (WMD) of the aggregates (Kemper & Chepil, 1965), using the expressions:
(
)
å
å
= =
* =
÷ ø ö ç
è
æ *
=
n
n i
N
1 I
wi xi WMD
/ xi log wp EXP
GMD
å
= ÷ø ö ç
è
æ N
1 I wi ;
where wp is the aggregate weight in each class (g); xi
is the mean diameter in each aggregate class (mm); and wi represents the relative proportion of each class
System Sand Silt Clay pH TOC SB t T V
g kg-1 dag kg-1 cmolc dm-3 %
Horizonte A
Pf1 375 194 431 4.33 77.10 1.47 3.05 18.05 7.97
Org1 428 184 388 4.99 50.54 2.71 3.14 8.65 32.39
Con1 550 105 345 5.27 34.83 3.09 3.16 8.71 35.49
Sf2 487 120 393 5.67 48.13 2.41 2.46 6.65 36.24
Con2 408 56 536 6.77 31.53 3.35 3.35 4.94 68.15
Org/In2 476 72 452 6.57 33.19 3.28 3.28 5.32 62.31
Org/In/Le2 500 65 435 6.13 46.33 3.29 3.29 6.87 46.82
Org/Ced2 373 68 559 5.53 40.92 1.73 1.78 6.35 27.28
Horizonte B
Pf1 360 181 459 4.56 36.18 0.41 1.39 10.42 4.16
Org1 373 211 416 4.47 24.01 1.22 2.45 8.42 13.96
Con1 403 150 447 4.44 26.19 0.91 1.47 6.30 14.46
Sf2 384 135 481 5.23 20.87 1.38 1.86 5.84 22.84
Con2 351 61 588 5.26 18.54 1.58 1.82 5.87 25.28
Org/In2 397 76 527 5.83 20.75 1.66 1.85 4.76 39.89
Org/In/Le2 395 80 525 5.13 17.68 0.69 0.95 4.76 14.53
Org/Ced2 302 76 622 4.60 21.40 0.49 1.15 5.54 8.66
Table 1. Mean values of the physical and chemical characteristics of the A and B horizon of two properties under different coffee management systems. (n = 3)
to the total (%). In addition, the levels of total organic carbon (TOC) of each class of aggregate were determined after oven-drying at 45 oC class, as described by Yeomans & Bremner (1988).
Statistical analysis
The management systems and the areas under forest were compared by the contrasts arising from the partitioning of two degrees of freedom for the treatments on Farm 1 (Mn1, Org1 and Con1) and four degrees of freedom for the treatments on Farm 2 (Sf2, Org/In2, Org/In/Le2, Org/Ced2, and Con2) (Table 2). The significance of contrasts with 1 degree of freedom was tested by the F test (p<0.15, 0.05 and 0.01) by analysis of variance in a completely randomized design, using the statistical program Sisvar.
The contrasts C1 and C2 are related to Farm 1. In C1, native forest was compared to organic and conventional coffee management systems. C2 compared the organic coffee system with the conventional one. The contrasts C3 and C4 are related to Farm 2. In C3, secondary forest was compared to coffee management systems. Contrast C4 evaluated the unshaded conventional coffee in relation to the three agroforestry coffee management systems.
RESULTS
In the first farm studied, treatment Org1 showed lower content of clay dispersed in water (CDW) and higher degree of flocculation (DF) than Con1 (Table 3, C2). Org1 also had lower BD and higher Pmicro and TP compared to Con1 (Table 3, C2). In Farm 2, Con2 had higher levels of CDW, lower DF, lower BD and higher Pmicro in relation to coffee agroforestry systems (Table 3, C4).
The results of resistance to penetration (RP), corrected in each treatment, are shown in figure 1. For that purpose, a significant equation was obtained from RP data in relation to field moisture for each treatment. Thus, soil RP of the coffee management systems adjusted to 20 % moisture by the respective equation was: Org1 (1.50 MPa), Con1 (2.17 MPa), OrgIn2 (2.67 MPa), OrgInLe2 (1.77 MPa), OrgCed (1.56 MPa) and Con2 (3.61 MPa).
On Farm 1, the order of RP values was: Pf1 < Org1 < Con1 (Figure 1). On Farm 2, this pattern was similar for soils under SF2 and Con2, with higher RP than under agroforestry systems. At depths below 20 cm, the RP of these two systems was between 3 and 4 MPa. In contrast, RP under agroforestry in the 0-10 cm layer was close to 2 MPa, and at depths below 10 cm, RP was between 1 and 2 MPa.
The data on soil moisture, which is one of the main factors influencing resistance to penetration, are presented in table 4. Soil moisture decreased from Pf1> Org1> Con1. Lower moisture was also recorded in Sf2 and Con2 as compared to agroforestry systems (C3 and C4 in Table 4).
Aggregate stability analysis showed that the soil under Org1 compared to Con1 had a higher proportion of aggregates >2 mm, MGD and WMD (Table 5, C2). However, there were no differences in TOC aggregate classes between soils under Org1 and Con1 at the two depths evaluated (Table 6, C2). In turn, the coffee agroforestry systems did not differ in the proportion of each aggregate class, GMD and WMD in relation to the soil in Con2 (Table 5, C4); however, agroforestry systems had higher C contents in all aggregate classes compared to Con2 soils (Table 6, C4).
DISCUSSION
On both farms, DF values were generally below 75 %. However, DF in the soil conservation systems was higher than under conventional coffee management. Mendonça et al. (2010) also reported that soil under coffee agroforestry had a higher DF than the coffee in full sun, with values of 42 and 31 % for agroforestry and conventional systems, respectively. The highest levels of CDW in coffee under conventional systems must be related to fertilization and liming (see Table 1) since the sorption complex is occupied by Na+, Ca2+ and Mg2+, which have less flocculating power than Al3+, resulting in greater clay dispersion (Nunes et al., 2010). The soils (oxidic Oxisols) also contribute to the higher DF of the clays in the subsurface due to higher levels of Fe and Al oxides, which are flocculating agents (Alleoni & Camargo, 1994).
Planting of the crops on Farm 1 reduced TP in the soils, corroborating Mendonça et al. (2010), who also found a reduced TP after deforestation and successive
System C1 C2 C3 C4
Pf1 2 0 -
-Org1 -1 1 -
-Con1 -1 -1 -
-Sf2 - - 4 0
Con2 - - -1 3
Org/In2 - - -1 -1
Org/In/Le2 - - -1 -1
Org/Ced2 - - -1 -1
Table 2. Contrasts (C) used to compare the different management systems
System/Contrast CDW DF Bd Pd Pmacro Pmicro TP
g kg-1 % kg dm-3 m3m-3
0-10 cm
Pf1 146.40 62.05 0.78 2.40 0.30 0.33 0.63
Org1 112.93 65.98 1.12 2.49 0.25 0.33 0.58
Con1 140.67 53.09 1.16 2.60 0.26 0.28 0.54
Sf2 209.87 42.57 1.04 2.61 0.29 0.25 0.54
Con2 414.53 19.49 1.08 2.64 0.24 0.32 0.56
Org/In2 310.00 26.65 1.22 2.60 0.28 0.27 0.55
Org/In/Le2 273.33 31.67 1.16 2.62 0.30 0.27 0.57
Org/Ced2 410.13 22.99 1.18 2.63 0.23 0.32 0.55
Contrast
C1 39.20ns 5.04ns -0.73** -0.28* 0.09# 0.05ns 0.16*
C2 -27.73# 12.89* -0.04ns -0.11# -0.01ns 0.05* 0.04#
C3 -568.53* 69.47** - 0.47** -0.05ns 0.11ns -0.18** -0.05ns
C4 250.13* -22.85# -0.32** -0.09ns -0.09ns 0.10* 0.01ns
10-20 cm
Pf1 150.13 65.03 0.85 2.46 0.32 0.32 0.64
Org1 109.73 71.45 0.98 2.61 0.29 0.33 0.62
Con1 171.07 50.47 1.12 2.53 0.27 0.25 0.52
Sf2 215.73 46.07 1.14 2.61 0.32 0.25 0.57
Con2 433.87 19.24 0.99 2.69 0.26 0.31 0.57
Org/In2 312.80 30.78 1.17 2.57 0.30 0.27 0.57
Org/In/Le2 336.80 22.66 1.11 2.73 0.27 0.27 0.54
Org/Ced2 388.93 30.15 1.08 2.68 0.26 0.30 0.56
Contrast
C1 19.47ns 8.13ns -0.39* -0.22ns 0.08# 0.05ns 0.14**
C2 -61.33* 20.97** -0.14# 0.08ns 0.02ns 0.08** 0.10**
C3 -609.47** 81.45** 0.21s -0.24# 0.19ns -0.15# 0.04ns
C4 263.07** -25.86* -0.39* 0.09ns -0.05ns 0.09# 0.04ns
20-40 cm
Pf1 173.07 63.17 0.89 2.61 0.35 0.33 0.68
Org1 99.60 75.26 0.86 2.62 0.37 0.31 0.68
Con1 183.20 52.46 1.11 2.77 0.27 0.25 0.52
Sf2 216.27 52.22 1.05 2.74 0.29 0.28 0.57
Con2 414.67 28.95 1.01 2.71 0.24 0.35 0.59
Org/In2 386.67 25.04 1.13 2.66 0.29 0.27 0.56
Org/In/Le2 375.47 26.25 1.13 2.69 0.29 0.27 0.56
Org/Ced2 388.00 35.58 1.02 2.73 0.26 0.32 0.58
Contrast
C1 63.33# -1.39ns -0.20# -0.17ns 0.06ns 0.10# 0.14#
C2 -83.60** 22.80** -0.25** -0.15# 0.10# 0.06# 0.16**
C3 -699.73** 93.08** -0.08ns 0.17ns 0.10ns -0.07ns 0.02ns
C4 93.87ns -0.03ns -0.25# 0.06ns -0.12# 0.18** 0.07ns
Table 3. Mean values, values and significance of contrasts of clay dispersed in water (CDW), degree of flocculation (DF), bulk density (Bd), particle density (Pd), macroporosity (Pmacro), microporosity (Pmicro) and total porosity (TP) in the layers of soil under different coffee management systems
Primary forest (Pf1), Organic coffee (Org1) and Conventional coffee (Con1), Secondary forest (Sf2), Organic coffee intercropped with inga (Org/In2), Organic coffee intercropped with inga and leucaena (Org/In/Le2), Organic coffee intercropped with cedar (Org/Ced2), Conventional coffee (Con2). C1 = (Pf1 vs Org1 - Con1), C2 = (Org1 vs Con1), C3 = (Sf2 vs Org/In2 - Org/In/Le2 - Org/ Ced2 - Con2), C4 = (Con2 vs Org/In2 - Org/In/Le2 - Org/Ced2). ns, #, *, **: non-significant, significant at 15, 5 and 1 %,
coffee crops in a conventional system. For Farm 2, there was no reduction in total porosity. In clay soils, one third of the total porosity is ideally formed by macropores and the remaining two thirds by micropores, with an ideal Pmacro/Pmicro ratio of 0.5; however, the plant root system grows satisfactorily when the macropore volume is higher than 0.10 m3 m-3 (Kiehl, 1979; Gontijo et al., 2008; Carmo et al., 2011). In regard to these assumptions, the macropore values were higher than 0.10 m3 m-3 in all systems, but due to the higher macroporosity in relation to microporosity, the Pmacro/Pmicro ratio was greater than 0.5.
In the clayey Oxisols of this study, TP was close to 0.60 m3 m-3. Thus, the optimal values for Pmicro would be close to 0.40 m3 m-3 since the micropores are responsible for water retention in the soil and groundwater recharge (Oliveira et al., 2004). Thus, in the most weathered Latosols, which have low values of Pmicro and, consequently, lower water storage capacity, compression of these soils, within certain limits, could be beneficial in terms of greater water retention by the conversion of part of the macropores into micropores (Resende et al., 2007; Gontijo et al., 2008; Carmo et al., 2011). On the other hand, high air-filled porosity is of great importance for root growth and for rapid flow of air and water in the soil (Nunes et al., 2010).
The higher values of Bd in the Con1 system led to a reduction in TP since the two properties were negatively correlated (r = -0.80, p=0.016). Corroborating our study, Nunes et al. (2010) found higher Bd values in a clayey Oxisol in the Zona da Mata region of the State of Minas Gerais under 16 and 22-year-old coffee trees than under 30- and 40-year-old secondary forest. The authors also reported that the higher soil density in coffee plantations led to a reduction in TP in this system in relation to the forest systems. In contrast to our study, Theodoro et al. (2003) found no significant difference in Bd between the forest (1.20 kg dm-3), organic coffee (1.27 kg dm-3) and conventional coffee (1.20 kg dm-3), but reported variations in porosity according to the management systems.
In a study of Arabica coffee seedlings in clayey soil, Matiello et al. (2005) noticed that roots were able to penetrate soil layers with Bd up to 1.20 kg dm-3, while at Bd values ranging from 1.20 to 1.35 kg dm-3, only a few roots were able to penetrate the soil. Considering this critical range of Bd, there is no limitation for root development in the systems under study because Bd was below 1.20 kg dm-3 in all the systems. However, higher RP was observed in soils of Con2 and Sf2 than in the agroforestry systems (Figure 1). The soil moisture in the field was found to be below the range considered ideal for measurement of RP (25-35 %) in medium- to clayey-textured soils, explaining the greater variation in the data (Orlando et al., 2000.) The higher values of RP under Con2 and Sf2 were due to lower soil moisture (r = -0.88, p=0.004) since
0
10
20
30
40
50
60
0 0,5 1 1,5 2 2,5 0 1 2 3 4 5 Resistence to penetration (MPa)
Depth, cm
Pf1 Org1 Con1
Sf1 Con2 Org/In2 Org/In/Le2 Org/Ced2
Figure 1. Soil resistance to penetration (MPa) at a depth of 60 cm. Primary forest (Pf1), organic coffee (Org1) and conventional coffee (Con1); secondary forest (Sf2), organic coffee intercropped with inga (Org/In2), organic coffee intercropped with leucaena and inga (Org/In/Le2) organic coffee intercropped with cedar (Org/Ced2) and conventional coffee (Con2).
System/Contrast Depth (cm)
0-10 10-20 20-40 40-60
Soil moisture (%)
Pf1 28.56 29.15 28.49 28.95
Org1 21.19 24.65 25.03 25.67
Con1 13.95 15.23 16.73 19.03
Sf2 8.78 9.85 10.81 14.23
Con2 8.16 8.65 10.41 9.98
Org/In2 14.87 14.23 15.21 18.03
Org/In/Le2 15.84 14.69 14.13 16.13
Org/Ced2 17.75 19.36 20.17 20.10
Contrast
C1 21.98** 18.42** 15.22* 13.20*
C2 7.24* 9.42* 8.29* 6.64#
C3 -21.46** -17.53** -16.68** -7.24#
C4 -23.94** -22.34** -18.29** -24.22** Table 4. Mean soil moisture, value and significance of contrasts in the layers of soil under different management systems
Primary forest (Pf1), Organic coffee (Org1) and Primary forest (Pf1), Organic coffee (Org1) and Conventional coffee (Con1), Secondary forest (Sf2), Organic coffee intercropped with inga (Org/In2), Organic coffee intercropped with inga and leucaena (Org/In/Le2), Organic coffee intercropped with cedar (Org/ Ced2), Conventional coffee (Con2). C1 = (Pf1 vs Org1 - Con1), C2 = (Org1 vs Con1), C3 = (Sf2 vs Org/In2 - Org/In/Le2 - Org/ Ced2- Con2), C4 = (Con2 vs Org/In2 - Org/In/Le2 - Org/Ced2). ns, #, *, **: non-significant, significant at 15, 5 and 1 %,
Table 5. Mean values, values and significance of the contrasts of the proportion of each aggregate class, geometric mean diameter (GMD) and weighted mean diameter (WMD) in the 0-10 and 10-20 cm layers of soil under different management systems
System/Contrast Agregate class GMD WMD
4-2 mm 2-1 mm 1-0.5 mm 0.5-0.25 mm <0.25 mm
% m m
0-10 cm
Pf1 91.63 1.99 0.16 0.29 4.58 2.54 2.81
Org1 95.23 3.36 0.32 0.72 1.74 2.75 2.89
Con1 83.28 4.14 6.29 3.36 2.93 2.31 2.62
Sf2 95.43 2.25 0.46 0.71 1.16 2.79 2.9
Con2 83.77 5.84 4.73 4.33 1.33 2.38 2.65
Org/In2 79.74 6.29 5.81 5.05 3.11 2.19 2.55
Org/In/Le2 91.06 3.48 2.45 1.96 1.04 2.64 2.81
Org/Ced2 64.57 10.26 8.84 10.09 6.23 1.70 2.20
Contrast
C1 4.75ns -3.52ns -6.29ns -3.5ns 4.49ns 0.02ns 0.11ns
C2 11.95* -0.78ns -5.97# -2.64# -1.19ns 0.44* 0.27*
C3 62.58** -16.87* -19.99** -18.59* -7.07ns 2.25** 1.39**
C4 15.94ns -2.51ns -2.91ns -4.11ns -6.39# 0.61ns 0.39ns
10-20 cm
Pf1 95.03 2.82 0.30 0.47 1.39 2.78 2.90
Org1 90.09 4.32 0.75 0.77 4.08 2.50 2.78
Con1 70.07 10.05 7.89 8.06 3.94 1.90 2.35
Sf2 97.52 1.09 0.32 0.35 0.73 2.88 2.78
Con2 62.40 13.18 11.84 9.62 2.96 1.77 2.20
Org/In2 53.35 17.33 12.28 11.33 5.71 1.54 2.00
Org/In/Le2 63.82 10.86 11.67 10.07 3.59 1.73 2.21
Org/Ced2 66.38 13.52 10.18 8.14 1.78 1.91 2.30
Contrast
C1 29.90** -8.73** -8.04** -7.89** -5.24# 1.16** 0.67**
C2 20.02** -5.73** -7.14** -7.29** 0.14ns 0.60** 0.43**
C3 144.13** -50.53** -44.69** -37.76** -11.12# 4.57** 2.41**
C4 3.65ns -2.17ns 1.39ns -0.68ns -2.20ns 0.13ns 0.09ns
Primary forest (Pf1), Organic coffee (Org1) and Conventional coffee (Con1), Secondary forest (Sf2), Organic coffee intercropped with inga (Org/In2), Organic coffee intercropped with inga and leucaena (Org/In/Le2), Organic coffee intercropped with cedar (Org/Ced2), Conventional coffee (Con2). C1 = (Pf1 vs Org1 - Con1), C2 = (Org1 vs Con1), C3 = (Sf2 vs Org/In2 - Org/In/Le2 - Org/ Ced2- Con2), C4 = (Con2 vs Org/In2 - Org/In/Le2 - Org/Ced2). ns, #, *, **: non-significant, significant at 15, 5 and 1 %,
respectively, by the F test.
there was no difference in TP between the systems of Farm 2 and Bd under Con2 was lower than in soils under agroforestry systems. Furthermore, a large amount of roots was observed in Sf2, which may have clogged the penetrometer.
The resistance to penetration (RP) values that limit root growth vary according to the crop. Effgen et al. (2012) determined that the value of 5.1 MPa in the 20-40 cm layer for coffee grown in dystrophic Red-Yellow Oxisols was restrictive to root development. Aguiar (2008) recorded a maximum RP of 3.8 and 4.5 MPa in the dry period for soils under agroforestry and conventional coffee, respectively, while in the soil under forest, the highest RP in the dry season was 2.1 MPa.
Higher soil moisture in agroforestry systems indicates the importance of shading the soil to conserve higher moisture in the dry season because the litter acts as thermal insulation for the soil. In addition, soils with good plant cover prevent or reduce the direct action of raindrops and maintain more uniform moisture and temperature, which favors development of the root system, helping to create a more favorable environment for soil aggregation (Campos et al., 1999; Nunes et al., 2010).
System/Contrast
Agregate class
4-2 mm 2-1 mm 1-0.5 mm 0.5-0.25
0-10 cm
Pf1 40.06 38.26 44.39 31.89
Org1 22.01 20.52 25.93 22.63
Con1 22.57 21.66 18.63 18.76
Sf2 30.53 28.24 41.27 39.83
Con2 24.98 19.26 18.87 17.07
Org/In2 33.66 25.95 18.66 16.85
Org/In/Le2 49.28 41.64 38.84 33.58
Org/Ced2 44.21 34.58 32.29 31.39
Contrast
C1 35.54 ** 34.34 ** 44.22 ** 22.39 **
C2 -0.56 ns -1.14 ns 7.3 # 3.89 ns
C3 -30.01 * -8.47 ns 56.42 ** 60.43 ** C4 -52.21 ** -44.39 ** -33.18 ** -30.61 **
10-20 cm
Pf1 30.84 31.83 34.90 27.78
Org1 22.59 19.52 26.84 22.65
Con1 26.00 22.67 22.78 20.00
Sf2 24.53 21.53 21.31 24.22
Con2 22.30 22.20 13.51 23.66
Org/In2 31.94 30.89 33.35 27.30
Org/In/Le2 40.25 35.69 34.90 32.85
Org/Ced2 35.81 32.41 29.00 33.27
Contrast
C1 13.09 * 21.47 ** 20.18 ** 12.91 *
C2 -3.41 ns -3.15 ns 4.06 ns 2.65 ns
C3 -32.18 ** -35.07 * -25.52 # -20.20 ns C4 -41.1 ** -32.39 ** -56.72 ** -22.44 ns Table 6. Mean values, values and significance of the contrasts of the levels of total organic carbon (TOC, g kg-1) in the aggregate classes in the layers
of soil under different management systems
Primary forest (Pf1), Organic coffee (Org1) and Conventional coffee (Con1), Secondary forest (Sf2), Organic coffee intercropped with inga (Org/In2), Organic coffee intercropped with inga and leucaena (Org/In/Le2), Organic coffee intercropped with cedar (Org/Ced2), Conventional coffee (Con2). C1 = (Pf1VS Org1- Con1), C2 = (Org1 VS Con1), C3 = (Sf2 VS Org/In2- Org/In/Le2- Org/Ced2- Con2), C4 = (Con2 VS Org/In2- Org/In/Le2- Org/Ced2). ns, #, *, **: non-significant,
significant at 15, 5 and 1 %, respectively, by the F test.
system, the greater the protection of the area is and, consequently, the higher the aggregation.
In addition to higher soil aggregation, the agroforestry systems also had the highest TOC contents in the aggregate classes. On average, values of 29.1, 40.1, 34.7 and 20.2 g kg-1 C were found in the macroaggregates of the systems Org/In2, Org/In/Le2, Org/Ced2 and Con2, respectively. As for the microaggregates of the respective systems, TOC was 22.1, 33.2, 32.3 and 20.4 g kg-1. These data indicate a greater quantity of C in macroaggregates of agroforestry systems, increasing physical protection and the action of soil microorganisms.
The macroaggregates in the systems Org1 and Con1 contained 22.9 and 22.4 g kg-1 TOC, respectively, while in the microaggregates, the average C content was 22.6 and 19.4 g kg-1, respectively, indicating that in these two systems, C was better distributed between macro and microaggregates. The TOC contents in the agroforestry systems were higher in both macro and microaggregates as compared to the system with organic manure only, indicating faster recovery of soil quality. This result is related to the greater input of organic matter and soil protection from water erosion in the agroforestry systems due to the greater amount of litter in these systems compared to the unshaded organic system.
CONCLUSIONS
1. In the agroforestry system with coffee and the organic coffee system, soil resistance to penetration was lower and moisture higher than under the conventional coffee system.
2. In the soil under organic coffee without other trees, bulk density was lower and microporosity and total porosity were higher than in the conventional system.
3. The TOC contents in soil macro and microaggregates were higher in agroforestry systems than in the unshaded conventional coffee system.
4. The soil under an agroforestry coffee management system with inga and leucaena trees had high aggregation and the highest TOC contents in all the aggregate classes.
ACKNOWLEDGMENTS
The authors are indebted to the Espirito Santo Research Foundation (Fundação de Amparo a Pesquisa do Espírito Santo - FAPES) for funding the research and for the scholarship granted to the first author. They also wish to thank their colleagues Paulo, Victor, Wallas and Jocelina for their kind help with soil sampling and laboratory analysis.
LITERATURE CITED
AGUIAR, M.I. Qualidade física do solo em sistemas agroflorestais. Viçosa, MG, Universidade Federal de Viçosa, 2008. 89p. (Dissertação de Mestrado)
ALLEONI, L.R.F. & CAMARGO, O.A. Atributos físicos de Latossolos ácricos do norte paulista. Sci. Agríc., 51:321-326, 1994.
CAMPOS, B.C.; REINERT, D.J.; NICOLODI, R. & CASSOL, L.C. Dinâmica da agregação induzida pelo uso de plantas de inverno para cobertura do solo. R. Bras. Ci. Solo, 23:383-391, 1999.
CARMO, D.L.; NANNETTI, D.C.; JUNIOR, M.S.D.; ESPÍRITO SANTO, D.J.; NANNETTI, A.N. & LACERDA, T.M. Propriedades físicas de um Latossolo Vermelho-Amarelo cultivado com cafeeiro em três sistemas de manejo no sul de Minas Gerais. R. Bras. Ci. Solo, 35:991-998, 2011. CARVALHO, R.; GOEDERT, W.J. & ARMANDO, M.S.
Atributos físicos da qualidade de um solo sob sistema agroflorestal. Pesq. Agropec. Bras., 39:1153-1155, 2004. CRUZ, A.C.R.; PAULETO, E.A.; FLORES, C.A. & SILVA, J.B.
Atributos físicos e carbono orgânico de um Argissolo Vermelho sob sistemas de manejo. R. Bras. Ci. Solo, 27:1105-1112, 2003.
EFFGEN, T.A.M.; PASSOS, R.R.; ANDRADE, F.V.; LIMA, J.S.S.; REIS, E.F. & BORGES, E.N. Propriedades físicas do solo em função de manejos em lavouras de cafeeiro conilon. R. Ceres, 59:414-421, 2012.
EMPRESA BRASILEIRA DE PESQUISA AGROPECUÁRIA -EMBRAPA. Centro Nacional de Pesquisas de Solos. Manual de métodos de análise de solo. 2.ed. Rio de Janeiro, 1997. 212p.
GONTIJO, I.; JUNIOR, M.S.D.; GUIMARAES, P.T.G. & ARAUJO-JUNIOR, C.F. Atributos físico-hídricos de um Latossolo de cerrado em diferentes posições de amostragem na lavoura cafeeira. R. Bras.Ci. Solo, 32:2227-2234, 2008.
KEMPER, W.D. & CHEPIL, W.S. Size distribution of aggregation. In: BLACK, C.A., ed. Methods of soil analysis: Physical and mineralogical properties, including statistics of measurement and sampling. Madison, American Society of Agronomy, 1965. p.499-510. KIEHL, E.L. Manual de edafologia. São Paulo, Ceres, 1979.
262p.
LEMOS, C.F. & SILVA, E.T. Comparação das características morfológicas, mineralógicas, químicas e físicas do solo entre áreas de cultivo com plantio direto e plantio convencional. R. Acad.: Ci. Agric. Amb., 3:11-18, 2005. MATIELLO, J.B.; SANTINATO, R.; GARCIA, A.W.R.;
ALMEIDA, S.R. & FERNANDES, D.R. Cultura de café no Brasil: Novo manual de recomendações. Rio de Janeiro, MAPA/Procafe, 2005. 438p.
MENDONÇA, E.S.; CARDOSO, I.M.; JUCKSCH, I.; FERNANDES, R.B.A. & GARCIA, R.V. Fatores edáficos de cafezais arborizados: Processo de aprendizado contínuo com agricultores familiares. In: ZAMBOLIM, L., ed. Estratégias para produção de café com qualidade e sustentabilidade. Viçosa, MG, Suprema, 2010. v.1. p.63-84. NUNES, L.A.P.L.; DIAS, L.E.; JUCKSCH, I. & BARROS, N.F. Atributos físicos do solo em área de monocultivo de cafeeiro na zona da mata de Minas Gerais. Biosci. J., 26:71-78, 2010.
OLIVEIRA, G.C.; DIAS JUNIOR, M.S.; CURI, N. & RESCK, D.V.S. Caracterização química e físico-hídrica de um Latossolo Vermelho após vinte anos de manejo e cultivo do solo.R. Bras. Ci. Solo, 28:327-336, 2004.
ORLANDO, R.C.; VIEIRA, L.B. & MARCIANO, C. Análise da variabilidade do índice de cone para diferentes níveis de teor de água do solo. Eng. Agric., 8:182-185, 2000. PASSOS, R.R.; RUIZ, H.A.; CANTARUTTI, R.B. &
MENDONÇA, E.S. Carbono orgânico e nitrogênio em agregados de um Latossolo Vermelho distrófico sob duas coberturas vegetais. R. Bras. Ci. Solo, 31:1109-1118, 2007. PEREZ, A.M.M.; JUCKSCH, I.; MENDONÇA, E.S. & COSTA, L.M. Impactos da implementação de um sistema agroflorestal com café na qualidade do solo. Agropec. Técn., 25:25-36, 2004.
RESENDE, M.; CURI, N.; REZENDE, S.B. & CORRÊA, G.F. Pedologia: Base para distinção de ambientes. 5.ed. Lavras, Universidade Federal de Lavras, 2007. 322p.
SANTOS, L.N.S.; PASSOS, R.R.; SILVA, L.V.M.; OLIVEIRA, P.P.; GARCIA, G.O.; CECÍLIO, R.A. Avaliação de alguns atributos físicos de um Latossolo Vermelho-Amarelo sob diferentes coberturas vegetais. Biosci. J., 26:940-947, 2010. SIX, J.; PAUSTIAN, K.; ELLIOT, E.T. & COMBRINK, C. Soil structure and organic matter: distribution of aggregate-size classes and aggregate associated carbon.Soil Sci. Soc. Am. J., 64:681-689, 2000.
STOLF, R. Teoria e teste experimental de fórmulas de transformação dos dados de penetrômetro de impacto de resistência do solo. R. Bras. Ci. Solo, 15:229-235, 1991. THEODORO, V.C.A.; ALVARENGA, M.I.N.; GUIMARAES,
R.J. & SOUZA, C.A.S. Alterações químicas em solo submetido a diferentes formas de manejo do cafeeiro. R. Bras. Ci. Solo, 27:1039-1047, 2003.
VOMOCIL, J.A. Porosity. In: BLAKE, C.A., ed. Methods of soil analysis. Madison, American Society of Agronomy, 1965. p.299-314.
WENDLING, B.; JUCKSCH, I.; MENDONÇA, E.S. & VINHAL-FREITAS, I.C. Mudanças no carbono e nitrogênio em diferentes compartimentos da matéria orgânica sob sistema agrossilvipastoril. Ci. Flor., 21:643-655, 2011. YEOMANS, J.C. & BREMNER, J.M. A rapid and precise