DRIS indices in three phenological stages of the carrot crop
1Felipe Augusto Reis Gonçalves2, Leonardo Angelo de Aquino2, Luciel Rauni Dezordi2, Junia Maria Clemente2, Roberto Ferreira Novais2
INTRODUCTION
Carrot (Daucus carota L.) is a crop with high nutritional and economic importance. The Brazilian production in 2014 was around 760,000 tons, in 24,500 hectares, with an average yield of 31 t ha-1.
The Alto Paranaíba region, in the Minas Gerais State, produces most of it, with yields higher than the national average, exceeding 120 t ha-1
(Anuário... 2015), due to local factors such as climate, soil and crop management.
ABSTRACT
RESUMO
Carrot crops present a high economic value and require a careful nutritional management, especially when cultivated in low fertility soils, such as those from the Brazilian Savannah (Souza & Alves
2003). Fertilization influences yield and farming
costs, as it may represent more than 40 % of the crop production cost (Cepea 2016). The use of higher doses of nutrients may contribute positively to its yield, however, when poorly managed, they compromise the production costs and environmental sustainability (Singh et al. 2012).
1. Manuscript received in Jul./2016 and accepted for publication in Feb./2017 (http://dx.doi.org/10.1590/1983-40632016v4742449). 2. Universidade Federal de Viçosa, Rio Paranaíba, MG, Brazil. E-mails: [email protected], [email protected],
Carrot is one of the most consumed vegetables in Brazil, where the cultivars currently grown present a high yield potential and nutritional demand, which require constant adjustments in fertilization programs for the crop. This study aimed at determining reference values and diagnostic indices by using the DRIS method in three phenological stages of the carrot crop (around 40 and 70 days after sowing and at harvest), as well as evaluating the possibility of early diagnosis for nutritional limitations. For determining the DRIS norms, a database was obtained from leaf samplings, root yields and leaf contents of N, P, K, Ca, Mg, S, B, Cu, Mn and Zn, in carrot commercial fields. The nutritional limitation order was generated as a function of the fertilization response and optimum range of leaf contents. The reference values for K, Ca, Mg, S and Mn were similar in all sampling times. N, P, B, Cu and Zn varied with the stages sampled, indicating the need to standardize the sampling times for these nutrients. Mn, K and Mg were the most limiting nutrients for the crop growth, while Zn and B were the least limiting. There was a correlation between the diagnoses performed at early stages and those performed at harvest for K, Ca, Mg, S and Mn, indicating the possibility of early diagnosis for the deficiency of these nutrients.
KEYWORDS: Daucus carota L.; early diagnosis; nutritional limitation.
Índices DRIS em três fases fenológicas da cultura da cenoura
The knowledge of nutritional demand indicates the appropriate doses of nutrients, increasing
profits and minimizing nutrient losses (Singh et
al. 2012, Dezordi et al. 2015), while leaf analysis
may indicate nutritional disorders and define more
precise fertilization doses for the crop (Malavolta et
al. 1997). In carrot fields from the Alto Paranaíba
region, the most limiting nutrients for carrot are Mn and K, indicating the need to adjust the fertilization with these nutrients (Dezordi et al. 2016). Dezordi et al. 2016 established diagnostic indices for the crop
at the harvest time, what do not allow the deficiency
correction at the same season.
The determination of diagnostic indices during the cycle could be an alternative to the fertilization correction in the current crop season. Early leaf analysis may generate differences on adequate contents, as indices may vary with sampling times (Tomio et al. 2015). For carrot, the phenological stage that marks the end of the primary root growth and the beginning of radial growth, which is around 40 days after sowing (DAS) (Marouelli et al. 2007), could be standardized for sampling. According to Trani & Raij (1996), at half and two-thirds of the growth cycle, around 60-80 DAS, is another stage that could be standardized. For the ‘Forto’ cultivar, it was observed a higher dry matter accumulation in the shoots at 70 DAS, around two-thirds of the cycle (Cecílio Filho & Peixoto 2013).
The standardization of the phenological stage for leaf analysis aims at minimizing the dilution or
concentration effects of nutrients which impair the
diagnosis, especially when the plants stabilize their growth and dry matter accumulation (Malavolta et al. 1997). However, in general, when the vegetative growth reaches maximum or close values, much of the crop cycle has already passed and the diagnosis may be not efficient for correcting nutritional disorders in the current crop season. Early diagnosis is interesting because it allows the correction of nutritional disorders, especially for carrot, which is a high-value crop.
The Diagnosis and Recommendation Integrated System (DRIS) method was developed
by Beaufills (1973) and has been used to interpret
results of foliar analysis in several crops (Gott et al. 2014, Dezordi et al. 2016). It considers the dual relationship between nutrients, and not only the single contents in plant tissues, with advantages regarding simpler methods, such as the Critical
Level and the Sufficiency Range (Gott et al. 2014).
A major advantage of the method is to minimize the
dilution and concentration effects, because it is based on the nutrients balance (Beaufils 1973, Jones 1981). In addition, it allows the identification of nutritional
imbalances, when all nutrients are above the critical level (Baldock & Schulte 1996).
This study aimed at determining diagnostic indices and reference values in three phenological stages (stages 1 and 2 and at harvest) of the carrot crop, by using the DRIS method; ordering the nutrients, regarding the nutritional limitation; and checking the agreement between the generated
diagnoses in different phenological stages.
MATERIAL AND METHODS
In order to determine the DRIS norms, a database with contents of N, P, K, Ca, Mg, S, B, Cu, Mn and Zn in the sampled leaves and root yield was
built in commercial fields of carrot from the Alto
Paranaíba region, Minas Gerais State, Brazil. It is noteworthy that the Fe content was not included in the calculations because it was quite high, probably due to contamination of leaf samples by soil residues, which are rich in iron oxides (Farias et al. 2009). The leaf samplings were carried out in the 2012 and 2013 crop seasons.
The local climate is classified as Cwa, following the Köppen-Geiger system, with one dry
and one well-defined rainy (from October to March)
season. The altitude of the area is 1,100 m, and
the sampled soils were classified as Oxisol, whose
chemical characteristics are shown in Table 1. The youngest, fully expanded pair of leaves was collected at the stages 1 and 2, and the whole shoot was collected at harvest time. The stage 1
was defined as the period between the end of the
primary growth of roots and the beginning of the secondary growth of roots, being around 40 DAS
(Marouelli et al. 2007). The stage 2 was defined
when the carrots reached 1.5-1.6 cm in diameter. By this time, the carrot presents a high dry matter accumulation and a maximum rate of nutrient uptake, around 70 DAS (Cecílio Filho & Peixoto 2013). The sampling at harvest time was performed
in 210 field plots, at the stage 1 in 144 plots and at
the stage 2 in 176 plots.
The average amounts of N, P2O5 and K2O applied were 118 kg ha-1, 650 kg ha-1 and 398 kg ha-1,
respectively. The whole P2O5 dose was applied at sowing, while N and K2O were applied at sowing and topdressing. The main summer cultivars were ‘Juliana’ and ‘Poliana’. The more common winter cultivars were ‘Baltimore’, ‘Belgrado’, ‘Maestro’, ‘Músico’, ‘Nancy’, ‘Nandrim’ and ‘Soprano’.
The leaf samples were dried in a forced-air oven at 70 ºC, during 72 h. Then, they were ground in a Wiley mill with a 1.27 mm sieve. The determination of nutrient contents was performed according to Malavolta et al. (1997).
For the establishment of DRIS norms, the population was divided in two classes based on yield,
which were defined according to the average yield
plus 2/3 of the standard deviation of this variable. The subpopulation with higher yield, considered nutritionally balanced, was the reference population, and it was used to establish the comparison standards.
Subsequently, the average (x) and variance (s²) of the dual relationship of nutrient contents in leaves were calculated. The relationships were obtained from the ratio of macro and micronutrient contents in g kg-1 and mg kg-1, respectively. The dual relationship
functions were obtained from the average (x) and standard deviation (s) of these functions, according to Jones (1981), and chosen by the F method (Letzsch 1985):
f (X/Y) = (X/Y - x/y)
s f (Z/X) = (Z/X - z/x)
s
where X is the nutrient desired to calculate the index; Y the nutrient that is in the denominator of the relationship with the nutrient X; Z the nutrient that is in the numerator of the relationship with the nutrient
X; Z/X the relationship between the contents of the nutrients Z and X to be submitted to DRIS; X/Y the relationship between the contents of the nutrients
X and Y to be submitted to DRIS; z/x the average relationship between the contents of the nutrients
Z and X provided by DRIS norms; x/y the average relationship between the contents of the nutrients X
and Y provided by DRIS norms; and s the standard deviation of the dual relationship in the reference population.
The DRIS index for each nutrient was calculated according to the equation proposed by
Beaufils (1973):
IndexDRIS X = [f (X/Y1) + f (X/Y2) + … + f (X/Yn)] - [f (Z1/X) + f (Z2/X) + … + f (Zm/X)]
n + m
where X/Y and Y/X are the functions of the dual relationships chosen for the DRIS index calculation;
m the number of functions where the nutrient X is in the denominator; and n the number of functions where the nutrient X is in the numerator.
After defining the DRIS indices, the optimum
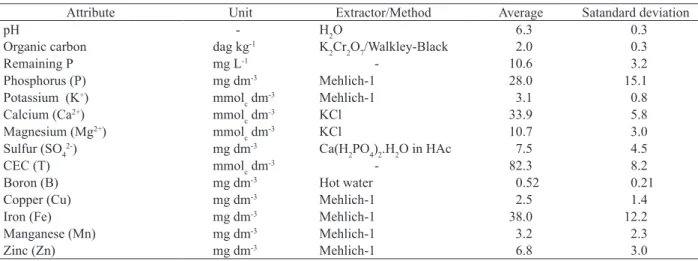
leaf contents were determined through regression adjustment between the nutrient index (independent variable) and its respective leaf content (dependent variable), for the reference population fields. Subsequently, the leaf nutrient content that provides a null or balanced index was obtained.The optimum range for each nutrient was obtained based on the leaf nutrient contents of the reference population ± 2/3 of Table 1. Average and standard deviation of the main soil attributes (0-20 cm depth), in the fields sampled in 2012 and 2013.
Attribute Unit Extractor/Method Average Satandard deviation
pH - H2O 6.3 0.3
Organic carbon dag kg-1 K
2Cr2O7/Walkley-Black 2.0 0.3
Remaining P mg L-1 - 10.6 3.2
Phosphorus (P) mg dm-3 Mehlich-1 28.0 15.1
Potassium (K+) mmol
c dm
-3 Mehlich-1 3.1 0.8
Calcium (Ca2+) mmol
c dm
-3 KCl 33.9 5.8
Magnesium (Mg2+) mmol
c dm
-3 KCl 10.7 3.0
Sulfur (SO42-) mg dm-3 Ca(H
2PO4)2.H2O in HAc 7.5 4.5
CEC (T) mmolc dm-3 - 82.3 8.2
Boron (B) mg dm-3 Hot water 0.52 0.21
Copper (Cu) mg dm-3 Mehlich-1 2.5 1.4
Iron (Fe) mg dm-3 Mehlich-1 38.0 12.2
Manganese (Mn) mg dm-3 Mehlich-1 3.2 2.3
the standard deviation (Dezordi et al. 2016). These contents and the optimum ranges generated by DRIS
were compared with contents and sufficiency ranges
reported in the literature (Malavolta et al. 1997, Hanlon & Hochmuth 2009).
The nutritional limitation order was generated in two ways: as a function of the optimum range of the leaf contents or according to the potential response to fertilization (Wadt et al. 1998). It sets the percentage
of unbalanced fields (deficient or excess) for each
nutrient with optimum range of foliar contents and foliar content of nutrients in the samples. When the leaf content was below the optimum range contents,
it was classified as limiting by deficiency, and when above the optimum range, it was classified as limiting
by excess. The order of nutritional limitation by
deficiency was generated in a decreasing order of nutrients, according to the frequency of deficient fields.
The fields were divided in five groups (positive,
positive or null, null, negative or null and negative), according to the potential response to fertilization, in order to generate the nutritional limitation order as a function of the potential response to fertilization (Wadt et al. 1998).
Subsequently, the frequency of fields grouped
in classes with positive and positive or null response for each nutrient was calculated. In these classes of response to fertilization, the nutrient
may be considered as limiting by deficiency for
the cultivation. The nutritional limitation order by
deficiency was generated by ordering the nutrients
in a decreasing way, regarding the frequency of
limiting fields.
The fields classification, regarding the nutritional status, was performed by grouping the
fields in three classes (limiting by deficiency, limiting
by excess and non-limiting) for each nutrient,
generated by two different methods: as a function of
the optimum range of the foliar content and potential
response to fertilization. Regarding the first method, the fields that had leaf contents below or above the range limits were classified as limiting by deficiency
or limiting by excess, respectively. When the content was in the interval of the range, the nutrient was
considered non-limiting for the field.
For the classification regarding the response potential, the fields with positive and positive or null response were classified as limiting by deficiency. The fields with null response were classified as
non-limiting, while, for the response of the additional classes to fertilization (negative, null or negative), the plots were grouped as limiting by excess (Urano et
al. 2006). For both classification methods (optimum
range or potential response to fertilization), the
frequency of fields and the average yield of each class (limiting by deficiency, non-limiting and limiting by
excess), for all nutrients, were presented.
Statistical analyses were performed with t tests
to compare the average yield of limiting by deficiency
and limiting by excess with the non-limiting class. The determination of reference values was performed using the Microsoft Excel® software. The parameters
of the adjusted equations were analyzed in order to
test their significance by a t test at 5 %, using the SAS software, version 8.2.
RESULTS AND DISCUSSION
The yield thresholds to classify the low and high classes (reference population) were 93.1 t ha-1,
90.6 t ha-1 and 87.8 t ha-1, respectively for the leaves
collected at the stages 1 and 2 and at harvest (all shoot).
These values were defined based on the average yield of all fields plus 2/3 of the standard deviation of
this variable. At the stage 1, 31 (21.5 %) of the 144
sampled fields composed the reference population.
At the stage 2, the reference population consisted of
50 (28.4 %) of the 176 sampled fields. At harvest,
the reference population consisted of 64 (30.5 %)
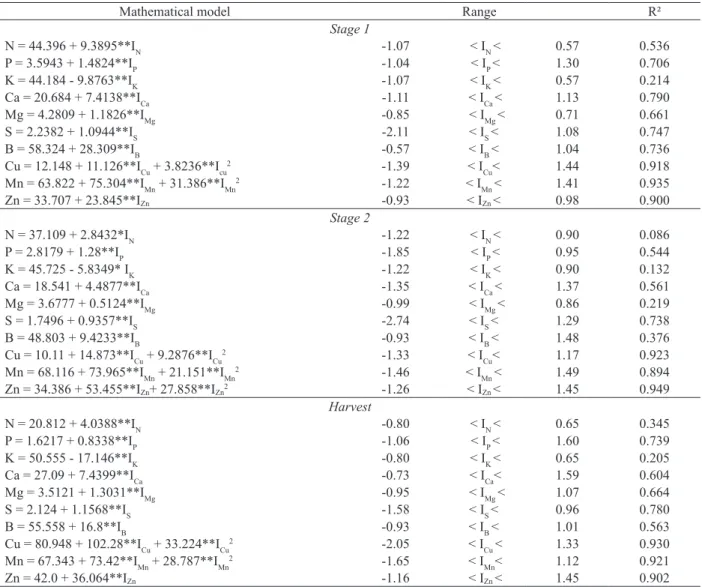
of the 210 sampled fields. Linear models of first or second order were fitted to describe the relationship
between the nutrients contents and DRIS indices, in the reference population (Table 2).
The following DRIS indices were correlated with the mean content of each nutrient at each stage, and as a function of the reference population (Table 2). The range, or amplitude range, of each index was calculated by adding and subtracting 2/3 of the standard deviation of the reference population. This range shows the DRIS values that can be used to estimate the optimum leaf content of each nutrient at each stage.
the diagnosis of these nutrients in early stages, especially for K, that is the most extracted and exported nutrient by carrot (Aquino et al. 2015). The optimum contents found by Malavolta et al. (1997), at the stage 1, were similar to Ca and Mg and discordant for K and S. Factors such as cultivar, production potential and management system may
have generated differences.
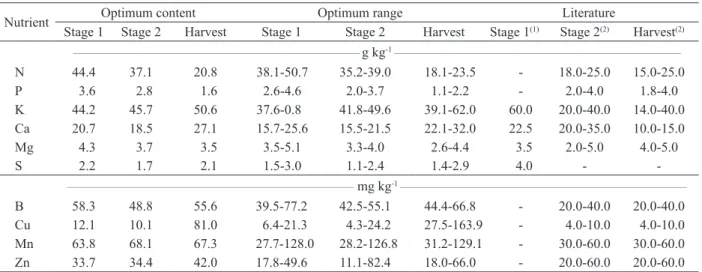
The contents and, in special, the optimum ranges of K, Mg, S and Mn were similar in the three sampled stages. The N, P, Ca and Cu contents and optimum ranges varied with the sampling stage. B and Zn had similar contents in the three stages, however, their optimum range did not show the same trend (Table 3).
In general, the optimum ranges calculated
were different from the literature (Table 3), except
for P at the stage 2 and N at harvest, which were similar. The soil characteristics may explain much
of these differences, because the critical level of a nutrient may vary with different soils. For lettuce, it
was observed a variation of the critical level of P in
different soils (Fabres et al. 1987). These authors also noted a significant and negative correlation between
the maximum capacities of P adsorption in the soil with the critical level of this nutrient in the plant.
The similarity between the optimum ranges of P, at the stage 2, of the current study with those found by Hanlon & Hochmuth (2009) is due to the reduced translocation of this nutrient to the roots, until the
1 Yield higher than 91.1 t ha-1, 90.6 t ha-1 and 87.8 t ha-1, respectively; * and ** significant by the t test at 5 % and 1 %, respectively.
Mathematical model Range R²
Stage 1
N = 44.396 + 9.3895**IN -1.07 < IN < 0.57 0.536
P = 3.5943 + 1.4824**IP -1.04 < IP < 1.30 0.706
K = 44.184 - 9.8763**IK -1.07 < IK < 0.57 0.214
Ca = 20.684 + 7.4138**ICa -1.11 < ICa < 1.13 0.790
Mg = 4.2809 + 1.1826**IMg -0.85 < IMg < 0.71 0.661
S = 2.2382 + 1.0944**IS -2.11 < IS < 1.08 0.747
B = 58.324 + 28.309**IB -0.57 < IB < 1.04 0.736
Cu = 12.148 + 11.126**ICu + 3.8236**Icu2 -1.39 < I
Cu< 1.44 0.918
Mn = 63.822 + 75.304**IMn + 31.386**IMn2 -1.22 < I
Mn < 1.41 0.935
Zn = 33.707 + 23.845**IZn -0.93 < IZn < 0.98 0.900
Stage 2
N = 37.109 + 2.8432*IN -1.22 < IN < 0.90 0.086
P = 2.8179 + 1.28**IP -1.85 < IP < 0.95 0.544
K = 45.725 - 5.8349* IK -1.22 < IK < 0.90 0.132
Ca = 18.541 + 4.4877**ICa -1.35 < ICa < 1.37 0.561
Mg = 3.6777 + 0.5124**IMg -0.99 < IMg < 0.86 0.219
S = 1.7496 + 0.9357**IS -2.74 < IS < 1.29 0.738
B = 48.803 + 9.4233**IB -0.93 < IB < 1.48 0.376
Cu = 10.11 + 14.873**ICu + 9.2876**ICu2 -1.33 < I
Cu< 1.17 0.923
Mn = 68.116 + 73.965**IMn + 21.151**IMn2 -1.46 < I
Mn < 1.49 0.894
Zn = 34.386 + 53.455**IZn+ 27.858**IZn2 -1.26 < IZn < 1.45 0.949
Harvest
N = 20.812 + 4.0388**IN -0.80 < IN < 0.65 0.345
P = 1.6217 + 0.8338**IP -1.06 < IP < 1.60 0.739
K = 50.555 - 17.146**IK -0.80 < IK < 0.65 0.205
Ca = 27.09 + 7.4399**ICa -0.73 < ICa< 1.59 0.604
Mg = 3.5121 + 1.3031**IMg -0.95 < IMg < 1.07 0.664
S = 2.124 + 1.1568**IS -1.58 < IS < 0.96 0.780
B = 55.558 + 16.8**IB -0.93 < IB < 1.01 0.563
Cu = 80.948 + 102.28**ICu + 33.224**ICu2 -2.05 < I
Cu < 1.33 0.930
Mn = 67.343 + 73.42**IMn + 28.787**IMn2 -1.65 < I
Mn< 1.12 0.921
Zn = 42.0 + 36.064**IZn -1.16 < IZn < 1.45 0.902
reference threshold. In carrot plants, P is accumulated with higher amounts in the roots from 60 DAS, and, at harvest, over 86 % of the P absorbed is allocated to the roots (Cecílio Filho & Peixoto 2013).
The accumulation of each nutrient during the crop cycle may be one of the reasons that led to the discrepancy on the contents and optimum ranges among stages. There was a reduction on the N, P and Mg contents over the carrot cycle, what may be explained by the increase in the shoot dry matter and greater allocation of these nutrients in the roots, if compared to the shoots (Cecílio Filho & Peixoto 2013, Aquino et al. 2015). K is intensively accumulated in the roots (Dezordi et al. 2015). However, it increased the optimum leaf content at harvest, showing that a high yield depends on the K availability to maintain high foliar contents (Aquino et al. 2015).
Ca and Cu were classified as limiting at the
stage 1 by the potential response to the fertilization method and evolved to no limitation over the cycle (Table 4). This Cu limitation in the beginning of the crop cycle may be attributed to the lower mobility of this micronutrient in the soil (Casali et al. 2008). Low transpiration, due to lower leaf area, may have
negatively influenced the Ca content in the leaf.
Collier & Huntington (1983) reported that Ca is
transported by mass flow. Therefore, it depends on
the transpiration rates.
Regardless of the sampling time and criteria of threshold establishment, Mn was the most limiting
nutrient at the stage 1, while K, Mg and Mn were the most limiting for the other sampled stages (Table 4). For the ‘Forto’ cultivar, the K accumulation in the
shoots and roots was higher at the final third of the
cycle (Cecílio Filho & Peixoto 2013). The high K demand combined with low recovery efficiency of this nutrient for the carrot crop (Dezordi et al. 2015) may be the explanation for the limitation by
deficiency. Increasing and partitioning K doses over
the carrot cycle may be alternatives to overcome this limitation.
Mg was limiting from the stage 2 until harvest. Its interaction with other cations in the soil, such as Ca and K, may have impaired its uptake. The application of Mg using sources that do not alter the pH should be carried out in order to provide lower Ca:Mg and higher Mg:K relationships, possibly
reducing the Mg deficiency.
Mg deficiency may be related to its low content
in the soil (Table 1), high pH and high P doses applied. These conditions led to the low availability (Moreira
et al. 2006), causing deficiency in carrot plants.
Zanão Júnior et al. (2007) state that the most important factor that controls the Mn availability for
plants is the soil pH. Mn deficiency enhances when
the pH is higher than 6.2 (Borket 1991). In this study, the average pH of the soils sampled was 6.3 (Table 1).
This high pH may explain the limitation by deficiency
of Mn over the crop cycle.
In general, Zn and B were less limiting for carrot growth in the Alto Paranaíba region. This
(1) Optimum content according to Malavolta et al. (1997); (2) optimum ranges according to Hanlon & Hochmuth (2009).
Nutrient Optimum content Optimum range Literature
Stage 1 Stage 2 Harvest Stage 1 Stage 2 Harvest Stage 1(1) Stage 2(2) Harvest(2) _________________________________________________________________________ g kg-1 _________________________________________________________________________
N 44.4 37.1 20.8 38.1-50.7 35.2-39.0 18.1-23.5 - 18.0-25.0 15.0-25.0
P 3.6 2.8 1.6 2.6-4.6 2.0-3.7 1.1-2.2 - 2.0-4.0 1.8-4.0
K 44.2 45.7 50.6 37.6-0.8 41.8-49.6 39.1-62.0 60.0 20.0-40.0 14.0-40.0
Ca 20.7 18.5 27.1 15.7-25.6 15.5-21.5 22.1-32.0 22.5 20.0-35.0 10.0-15.0
Mg 4.3 3.7 3.5 3.5-5.1 3.3-4.0 2.6-4.4 3.5 2.0-5.0 4.0-5.0
S 2.2 1.7 2.1 1.5-3.0 1.1-2.4 1.4-2.9 4.0 -
_________________________________________________________________________ mg kg-1 _________________________________________________________________________
B 58.3 48.8 55.6 39.5-77.2 42.5-55.1 44.4-66.8 - 20.0-40.0 20.0-40.0
Cu 12.1 10.1 81.0 6.4-21.3 4.3-24.2 27.5-163.9 - 4.0-10.0 4.0-10.0
Mn 63.8 68.1 67.3 27.7-128.0 28.2-126.8 31.2-129.1 - 30.0-60.0 30.0-60.0
Zn 33.7 34.4 42.0 17.8-49.6 11.1-82.4 18.0-66.0 - 20.0-60.0 20.0-60.0
may be a consequence of the constant application of these nutrients to the soil, as a common practice in the region. There was similarity between the nutritional restriction orders of the general population and the population with low yield for both classification criteria (optimum range or potential response to fertilization) in all sampled stages. The agreement is expected because the populations with low yield represent 78.5 %,
71.6 % and 69.5 % of the general population for the samplings performed at the stages 1, 2 and harvest, respectively.
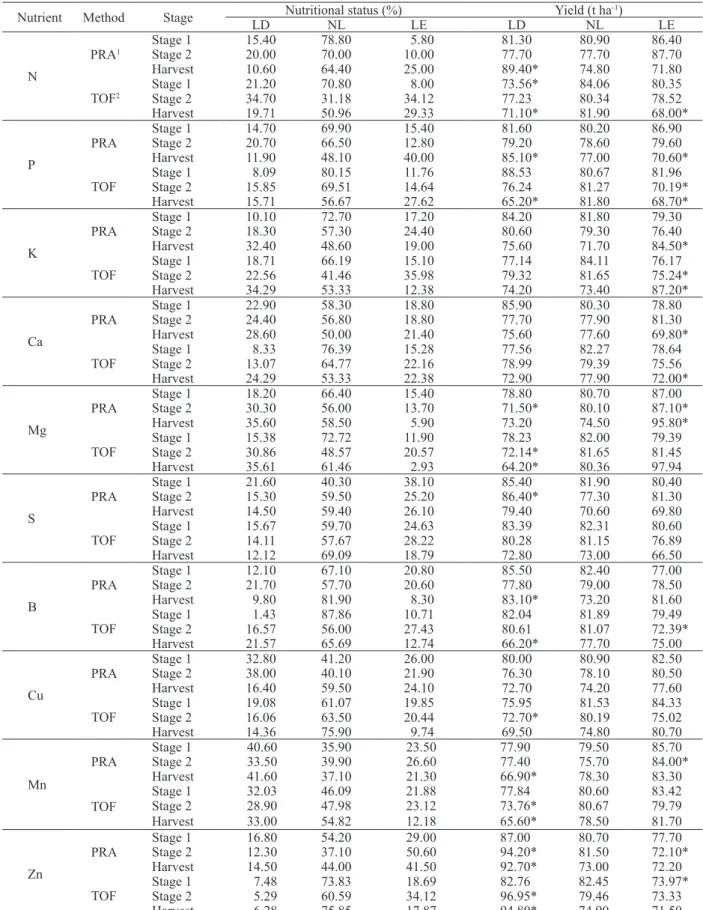
Regardless of the criteria, either optimum range of leaf content or potential response to
fertilization, there was a higher frequency of fields in the limiting classes (limiting by deficiency and
limiting by excess) for K, Mg and Mn, especially at
harvest (Table 5). Differences are expected between limiting by excess and limiting by deficiency classes,
if compared to the non-limiting class, as reported for rice by Guindani et al. (2009). In this study, there
was a higher frequency of these differences when
the diagnosis was carried out at the stage 2 or at harvest (Table 5), suggesting that these stages are more favorable for sampling and foliar diagnosis in carrot crops. In late samplings, the greatest vegetative growth minimizes misunderstandings related to the
nutrients concentration or dilution effects in the dry
matter.
Maia (2012) reported a reduction of concentration and dilution effects for most the nutrients, due to increases in the dry matter of bananas over the crop cycle. This shows that late samplings tend to express less error due to
these effects. Furthermore, at the stage 1, carrot is
approximately at one third of the cycle, what may lead to misunderstandings in diagnosis.
It was not possible to observe a tendency on
the average yield of classes (limiting by deficiency,
non-limiting or limiting by excess) for any criteria (optimum range or potential response to fertilization),
in any sampling time. The limiting by deficiency and limiting by excess classes differed, regarding yield,
for most the nutrients (Table 5), reinforcing that either
nutritional deficiency or excess may lower yield. There was a higher yield when Zn was classified as limiting by deficiency.
Early samplings may allow the nutrients diagnosis and correction at early stages of the cycle.
Future studies should assess the effectiveness of early diagnosed and corrected deficiencies on the carrot yield. The differences between the optimum
nutrient ranges generated by DRIS in this study and the ranges established by Hanlon & Hochmuth (2009) emphasize the importance of a regional
establishment of reference values. The differences among stages show the influence of the phenological
stage of sampling for the foliar diagnosis of the carrot crop.
Table 4. Nutritional limitation order generated by the DRIS method, in three phenological stages, for the carrot crop cultivated in the Alto Paranaíba region.
Method/
Classification Nutritional limitation order General population
Stage 1
PRA1 Mn > Cu > Ca > S > Mg > Zn > N > P > B > K
TOF2 Mn > N > Cu > K > S > Mg > Ca > P > Zn > B
Stage 2
PRA Cu > Mn > Mg > Ca > B > P > N > K > S > Zn TOF N > Mg > Mn > K > B > Cu > P > S > Ca > Zn
Harvest
PRA Mn < Mg < K < Ca < Cu < S < Zn < P < N < B TOF Mg > K > Mn > Ca > B > N > P > Cu > S > Zn
Population with high yield3
Stage 1
PRA Mn > Cu > Ca > S = B > Zn > Mg > P > K > N TOF Mn > S > K > P > Mg > Cu > N > Ca > Zn > B
Stage 2
PRA Mn < Zn < Cu < Ca < K = S < P < Mg = B < N TOF N > K > Mg = Mn = B > S > Ca > Zn > P > Cu
Harvest
PRA Zn > Mg > K > Ca > S > P > N > B > Cu > Mn TOF K > Zn > N > S > Ca > Cu > Mn > B > Mg > P
Population with low yield4
Stage 1
PRA Mn > Cu > Ca > S > Mg > N > Zn > P > K > B TOF Mn > N > Cu > K > Mg > S > Ca > Zn > P > B
Stage 2
PRA Cu > Mg > Mn > Ca > B > N > P > K > S > Zn TOF N > Mg > Mn > K > Cu > P > B > S > Ca > Zn
Harvest
PRA Mn < Mg < K < Ca < Cu < S < P < N < B < Zn TOF Mg > Mn > K > Ca > B > N > P > Cu > S > Zn
1 Classification generated according to the fertilization response potential; 2 classification generated according to the optimum range of leaf content; 3 high
yield (> 93.1 t ha-1, > 90.6 t ha-1 and > 87.8 t ha-1), as a function of the stages (1, 2
and harvest), respectively; 4 low yield (< 93.1 t ha-1, < 90.6 t ha-1 and < 87.8 t ha-1),
Table 5. Frequency of fields and average yield of limiting by deficiency (LD), non-limiting (NL) and limiting by excess (LE) classes generated by DRIS, in three sampled stages.
Nutrient Method Stage Nutritional status (%) Yield (t ha
-1)
LD NL LE LD NL LE
N
PRA1
Stage 1 15.40 78.80 5.80 81.30 80.90 86.40
Stage 2 20.00 70.00 10.00 77.70 77.70 87.70
Harvest 10.60 64.40 25.00 89.40* 74.80 71.80
TOF2
Stage 1 21.20 70.80 8.00 73.56* 84.06 80.35
Stage 2 34.70 31.18 34.12 77.23 80.34 78.52
Harvest 19.71 50.96 29.33 71.10* 81.90 68.00*
P
PRA
Stage 1 14.70 69.90 15.40 81.60 80.20 86.90
Stage 2 20.70 66.50 12.80 79.20 78.60 79.60
Harvest 11.90 48.10 40.00 85.10* 77.00 70.60*
TOF
Stage 1 8.09 80.15 11.76 88.53 80.67 81.96
Stage 2 15.85 69.51 14.64 76.24 81.27 70.19*
Harvest 15.71 56.67 27.62 65.20* 81.80 68.70*
K
PRA
Stage 1 10.10 72.70 17.20 84.20 81.80 79.30
Stage 2 18.30 57.30 24.40 80.60 79.30 76.40
Harvest 32.40 48.60 19.00 75.60 71.70 84.50*
TOF
Stage 1 18.71 66.19 15.10 77.14 84.11 76.17
Stage 2 22.56 41.46 35.98 79.32 81.65 75.24*
Harvest 34.29 53.33 12.38 74.20 73.40 87.20*
Ca
PRA
Stage 1 22.90 58.30 18.80 85.90 80.30 78.80
Stage 2 24.40 56.80 18.80 77.70 77.90 81.30
Harvest 28.60 50.00 21.40 75.60 77.60 69.80*
TOF
Stage 1 8.33 76.39 15.28 77.56 82.27 78.64
Stage 2 13.07 64.77 22.16 78.99 79.39 75.56
Harvest 24.29 53.33 22.38 72.90 77.90 72.00*
Mg
PRA
Stage 1 18.20 66.40 15.40 78.80 80.70 87.00
Stage 2 30.30 56.00 13.70 71.50* 80.10 87.10*
Harvest 35.60 58.50 5.90 73.20 74.50 95.80*
TOF
Stage 1 15.38 72.72 11.90 78.23 82.00 79.39
Stage 2 30.86 48.57 20.57 72.14* 81.65 81.45
Harvest 35.61 61.46 2.93 64.20* 80.36 97.94
S
PRA
Stage 1 21.60 40.30 38.10 85.40 81.90 80.40
Stage 2 15.30 59.50 25.20 86.40* 77.30 81.30
Harvest 14.50 59.40 26.10 79.40 70.60 69.80
TOF
Stage 1 15.67 59.70 24.63 83.39 82.31 80.60
Stage 2 14.11 57.67 28.22 80.28 81.15 76.89
Harvest 12.12 69.09 18.79 72.80 73.00 66.50
B
PRA
Stage 1 12.10 67.10 20.80 85.50 82.40 77.00
Stage 2 21.70 57.70 20.60 77.80 79.00 78.50
Harvest 9.80 81.90 8.30 83.10* 73.20 81.60
TOF
Stage 1 1.43 87.86 10.71 82.04 81.89 79.49
Stage 2 16.57 56.00 27.43 80.61 81.07 72.39*
Harvest 21.57 65.69 12.74 66.20* 77.70 75.00
Cu
PRA
Stage 1 32.80 41.20 26.00 80.00 80.90 82.50
Stage 2 38.00 40.10 21.90 76.30 78.10 80.50
Harvest 16.40 59.50 24.10 72.70 74.20 77.60
TOF
Stage 1 19.08 61.07 19.85 75.95 81.53 84.33
Stage 2 16.06 63.50 20.44 72.70* 80.19 75.02
Harvest 14.36 75.90 9.74 69.50 74.80 80.70
Mn
PRA
Stage 1 40.60 35.90 23.50 77.90 79.50 85.70
Stage 2 33.50 39.90 26.60 77.40 75.70 84.00*
Harvest 41.60 37.10 21.30 66.90* 78.30 83.30
TOF
Stage 1 32.03 46.09 21.88 77.84 80.60 83.42
Stage 2 28.90 47.98 23.12 73.76* 80.67 79.79
Harvest 33.00 54.82 12.18 65.60* 78.50 81.70
Zn
PRA
Stage 1 16.80 54.20 29.00 87.00 80.70 77.70
Stage 2 12.30 37.10 50.60 94.20* 81.50 72.10*
Harvest 14.50 44.00 41.50 92.70* 73.00 72.20
TOF
Stage 1 7.48 73.83 18.69 82.76 82.45 73.97*
Stage 2 5.29 60.59 34.12 96.95* 79.46 73.33
Harvest 6.28 75.85 17.87 94.80* 74.90 71.50
1 Classification generated according to the fertilization response potential; 2 classification generated according to the optimum range of leaf content; * significant by the
CONCLUSIONS
1. Mn was the most limiting nutrient by deficiency in
all sampled phenological stages, while K and Mg
were the most limiting nutrients by deficiency at
the stage 2 and harvest, for the carrot crop; 2. It is possible to anticipate the foliar diagnosis of
carrot, as observed for K, Ca, Mg, S and Mn at the stages 1, 2 and harvest, and all methods agree regarding the nutritional limitation at all stages for these nutrients.
REFERENCES
ANUÁRIO brasileiro de hortaliças. 2015. Available at: <http://www.anuarios.com.br/>. Access on: Jan. 15, 2016. AQUINO, R. F. B. A. et al. Nutrient demand by the carrot
crop is influenced by the cultivar. Revista Brasileira de
Ciência do Solo, v. 39, n. 2, p. 541-552, 2015.
BALDOCK, J. O.; SCHULTE, E. E. Plant analysis with
standardized scores combines DRIS and sufficiency range
approaches for corn. Agronomy Journal, v. 88, n. 3, p. 448-456, 1996.
BEAUFILS, E. R. Diagnosis and recommendation integrated system (DRIS): a general scheme for experimentation and calibration based on principles developed from research in plant nutrition. Soil Science Bulletin, v. 1, n. 1, p. 1-132, 1973.
BORKET, C. M. Manganês. In: FERREIRA, M. E.; CRUZ, M. C. P. (Eds.). Micronutrientes na agricultura. Piracicaba: Potafos, 1991. p. 173-188.
CASALI, C. A. et al. Formas e dessorção de cobre em solos cultivados com videira na Serra Gaúcha do Rio Grande do Sul. Revista Brasileira de Ciência do Solo, v. 32, n. 4, p. 1479-1487, 2008.
CECÍLIO FILHO, A. B.; PEIXOTO, F. C. Acúmulo e exportação de nutrientes em cenoura ‘Forto’. Revista Caatinga, v. 26, n. 1, p. 64-70, 2013.
CENTRO DE ESTUDOS AVANÇADOS EM ECONOMIA APLICADA (Cepea). Custos e gestão. 2016. Available at: <http://www.cepea.esalq.usp.br/rrs.php>. Access on: Apr. 07, 2016.
COLLIER, G. F.; HUNTINGTON, V. C. The relationship between leaf growth, calcium accumulation and distribution, and tipburn development in field-grown butterhead lettuce. Scientia Horticulturae, v. 21, n. 2, p. 123-128, 1983.
DEZORDI, L. R. et al. Diagnostic methods to assess the nutritional status of the carrot crop. Revista Brasileira de Ciência do Solo, v. 40, e0140813, 2016.
DEZORDI, L. R. et al. Nutrient recommendation model for carrot crop-ferticalc carrot. Revista Brasileira de Ciência do Solo, v. 39, n. 6, p. 1714-1722, 2015.
FABRES, A. S. et al. Níveis críticos de diferentes frações de fósforo em plantas de alface cultivadas em diferentes solos. Revista Brasileira de Ciência do Solo, v. 11, n. 3, p. 51-57, 1987.
FARIAS, D. R. et al. Fósforo em solos representativos do Estado da Paraíba: I - isotermas de adsorção e medidas do fator capacidade de fósforo. Revista Brasileira de Ciência do Solo, v. 33, n. 3, p. 623-632, 2009.
GOTT, R. M. et al. Índices diagnósticos para interpretação de análise foliar do milho. Revista Brasileira de Engenharia Agrícola e Ambiental, v. 18, n. 11, p. 1110-1115, 2014.
GUINDANI, R. H. P.; ANGHINONI, I.; NACHTIGALL, G. R. DRIS na avaliação do estado nutricional do arroz irrigado por inundação. Revista Brasileira de Ciência do Solo, v. 33, n. 1, p. 109-118, 2009.
HANLON, E. A.; HOCHMUTH, G. J. Carrot. In: CAMPBELL, C. R. Reference sufficiency ranges for plant analysis in the southern region of the United States. Raleigh: North Carolina Department of Agriculture, 2009. p. 63-64.
JONES, C. A. Proposed modifications of the diagnosis and
recommendation integrated system (DRIS) for interpreting plant analyses. Communications in Soil Science & Plant Analysis, v. 12, n. 8, p. 785-794, 1981.
LETZSCH, W. S. Computer program for selection of norms for use in the diagnosis and recommendation integrated system (DRIS). Communication in Soil Science and Plant Analysis, v. 16, n. 4, p. 339-347, 1985. MAIA, C. E. Época de amostragem foliar para diagnóstico nutricional em bananeira. Revista Brasileira de Ciência do Solo, v. 36, n. 3, p. 859-864, 2012.
MALAVOLTA, E.; VITTI, G. C.; OLIVEIRA, S. A. Avaliação do estado nutricional das plantas: princípios e aplicações. 2. ed. Piracicaba: Associação Brasileira para Pesquisa da Potassa e do Fosfato, 1997.
MAROUELLI, W. A.; OLIVEIRA, R. A.; SILVA, W. L. C. Irrigação na cultura da cenoura. Brasília, DF: Embrapa Hortaliças, 2007.
MOREIRA, S. G. et al. Formas químicas, disponibilidade de manganês e produtividade de soja em solos sob semeadura direta. Revista Brasileira de Ciência do Solo, v. 30, n. 1, p. 121-136, 2006.
carota L.). Food Chemistry, v. 132, n. 3, p. 1161-1170, 2012.
SOUZA, Z. M.; ALVES, M. C. Propriedades químicas de um Latossolo Vermelho Distroférrico de Cerrado sob diferentes usos e manejos. Revista Brasileira de Ciência do Solo, v. 27, n. 1, p. 133-139, 2003.
TOMIO, D. B. et al. Antecipação da diagnose foliar em arroz de sequeiro. Pesquisa Agropecuária Brasileira, v. 50, n. 3, p. 250-258, 2015.
TRANI, P. E.; RAIJ, B. Hortaliças. In: RAIJ, B. et al. (Eds.). Recomendações de adubação e calagem para
o Estado de São Paulo. 2. ed. Campinas: IAC, 1996.
p. 157-186.
URANO, E. O. M. et al. Avaliação do estado nutricional da soja. Pesquisa Agropecuária Brasileira, v. 41, n. 9, p. 1421-1428, 2006.
WADT, P. G. S. et al. Três métodos de cálculo do DRIS para avaliar o potencial de resposta à adubação de árvores de eucalipto. Revista Brasileira de Ciência do Solo, v. 22, n. 4, p. 661-666, 1998.