PhosPhorus contEnt in soil And thE chEmicAl
sPEciEs in solution
lessandro de conti(1), carlos Alberto ceretta(2)*, Paulo Ademar Avelar ferreira(1), felipe lorensini(3), cledimar rogério lourenzi(1), renan fagan Vidal(4), Adriele tassinari(4) and
gustavo Brunetto(2)
(1) Universidade Federal de Santa Maria, Departamento de Solos, Programa de Pós-Grduação em Ciência do Solo, Santa Maria, Rio
Grande do Sul, Brasil.
(2) Universidade Federal de Santa Maria, Departamento de Solos, Santa Maria, Rio Grande do Sul, Brasil.
(3) Associação Riograndense de Empreendimentos de Assistência Técnica e Extensão Rural, Regional de Frederico Westphalen,
Palmeira das Missões, Rio Grande do Sul, Brasil.
(4) Universidade Federal de Santa Maria, Curso de graduação em Agronomia, Santa Maria, Rio Grande do Sul, Brasil.
* Corresponding author. E-mail: [email protected]
ABstrAct
the application of pig slurry rates and plant cultivation can modify the soil phosphorus (P) content and distribution of chemical species in solution. the purpose of this study was to evaluate the total P, available P and P in solution, and the distribution of chemical P species in solution, in a soil under longstanding pig slurry applications and crop cultivation. the study was carried out in soil columns with undisturbed structure, collected in an experiment conducted for eight years in the experimental unit of the universidade federal de santa maria (ufsm), santa maria (rs). the soil was an Argissolo Vermelho distrófico arênico (typic hapludalf), subjected to applications of 0, 20, 40, and 80 m3 ha-1 pig slurry. soil samples were
collected from the layers 0-5, 5-10, 10-20, 20-30, 30-40, and 40-60 cm, before and after black oat and maize grown in a greenhouse, for the determination of available P, total P and P in the soil solution. in the solution, the concentration of the major cations, anions, dissolved organic carbon (doc), and ph were determined. the distribution of chemical P species was determined by software Visual minteq. the 21 pig slurry applications increased the total P content in the soil to a depth of 40 cm, and the P extracted by mehlich-1 and from the solution to a depth of 30 cm. successive applications of pig slurry changed the balance between the
introduction
The State of Rio Grande do Sul (RS) has the second largest pig herd of the country. Approximately 38,000 m3 of pig slurry (PS) is generated daily (Fepam, 2008), which is applied repeatedly in the same areas of cultivation, especially because the land distribution in the main producing regions in the north and northwest of the State consists of mostly small farms. The PS is applied as organic nutrient source, including P for plants (Guardini et al., 2012; lourenzi et al., 2014), which is one of the most limiting macronutrients for crop productivity in the weathered soils of tropical and subtropical regions (Gatiboni et al., 2008).
In soil, P is adsorbed to the functional groups of inorganic particles, forming an inner-sphere complex (Barrow, 1983) and therefore, P mobility and concentration in the soil solution are low (Frossard et al., 2000). however, when P is added successively and at high rates to the soil, for example by PS application in crop conservation systems
such as no-tillage (nT), where the soil is not tilled, the total P content may increase (Berwanger et al., 2008; lourenzi et al., 2014), and especially the content available to plants, which can be diagnosed by the method of Mehlich-1 (Gatiboni et al., 2008; Guardini et al., 2012). Thus, the saturation of the most avid adsorption sites and a reduction in adsorption energy between phosphate oxygen and functional groups of the surface of oxides and clay minerals are expected, increasing the P concentration in the solution (Guardini et al., 2012; Schmitt et al., 2014); consequently, the P transfer in surface runoff solution to surface waters increases, but also migration in the soil profile by water flow, raising the risk of contamination of subsurface waters, especially in soils with sandy surface texture (Berwanger et al., 2008; Ceretta et al., 2010b; Wang et al., 2013).
The predominant chemical forms of inorganic soluble P in the solution of most agricultural soils with ph between 4 and 6 are dihydrogen and monohydrogen phosphate and orthophosphate, with the predominant chemical species h2PO4 -solid and liquid phases in the surface soil layers, increasing the proportion of the total amount of P present in the soil solution, aside from changing the chemical species in the solution, reducing the percentage complexed with Al and increasing the one complexed with ca and mg in the layers 0-5 and 5-10 cm. Black oat and maize cultivation increased ph in the solution, thereby increasing the proportion of hPo42- and reducing h2Po4- species.
Keywords: organic wastes, soil solution, chemical speciation, Visual minteq.
rEsumo: InterferêncIa da adIção de dejetos de suínos e cultIvos de Plantas no teor de fósforo no solo e suas esPécIes QuímIcas na solução
A adição de doses de dejetos líquidos de suínos e o cultivo de plantas podem modificar o teor de fósforo (P) no solo e a distribuição de suas espécies químicas na solução. Este trabalho objetivou avaliar o teor de P total, disponível e na solução e, a distribuição das suas espécies químicas na solução, em um solo submetido à aplicação de doses de dejetos líquidos de suínos por longo tempo e cultivo de plantas. O trabalho foi realizado em colunas de solo com estrutura indeformada, derivadas de um experimento conduzido durante oito anos, na unidade experimental da Universidade Federal de Santa Maria (UFSM), em Santa Maria, RS. O solo foi um Argissolo Vermelho distrófico arênico, submetido a aplicações de 0, 20, 40 e 80 m3 ha-1 de dejetos líquidos de suínos. Foram realizadas coletas de solos antes e após os cultivos
de aveia preta e milho em casa de vegetação, nas camadas de 0-5, 5-10, 10-20, 20-30, 30-40 e 40-60 cm, para determinar os teores de P disponíveis e totais e a extração da solução. Na solução, foi determinada a concentração dos principais cátions, ânions, carbono orgânico dissolvido (COD) e o pH. A distribuição das espécies químicas de P foi obtida pelo software Visual Minteq. As 21 aplicações de dejetos líquidos de suínos aumentaram o teor de P total no solo até 40 cm e o teor de P extraído por Mehlich-1 e na solução até 30 cm de profundidade. As sucessivas aplicações de dejetos líquidos de suínos alteraram o equilíbrio entre a fase sólida e a líquida do solo nas camadas superficiais, aumentando a proporção do teor total de P do solo presente na solução, além de alterar as espécies químicas na solução, reduzindo a porcentagem complexada com Al e elevando a complexada com Ca e Mg nas camadas de 0-5 e 5-10 cm. O cultivo de aveia preta e milho elevou o pH da solução, consequentemente aumentando a proporção de HPO42- e
diminuindo a espécie H2Po4-.
(hinsinger, 2001). Plants preferentially absorb the P species in solution in the form of orthophosphate (h3PO4, h2PO4- and hPO
42-) (Schachtman et al., 1998). But the phosphate forming an ion pair with Ca and Mg that originates the species CahPO4(aq) and MghPO4(aq) are transferable, increasing the risk of environmental contamination (Girotto et al., 2010).
Phosphate in the soil solution can interact as a ligand with soluble cations such as Ca, Mg, Fe, and Al, among others, changing their availability and mobility (Girotto et al., 2010; Oburger et al., 2011). Continued applications of PS, a multielement fertilizer, are expected to induce changes in the chemical composition and distribution of P species in the soil solution, together with crop cultivation, which can alter the concentration of elements in the soil solution by absorption and accumulation in plant tissues, by exudation of organic compounds and by changes in ph through the release of Oh- or h+ (Gahoonia et al., 1992). The P species in soil solution can be estimated with specific software such as Visual Minteq, since P bioavailability and mobility depend on the concentration and chemical species in the solution (nolla and Anghinoni, 2006; Zambrosi et al., 2007; Girotto et al., 2010).
The aim of this study was to evaluate the total, available P content and P in solution, and the distribution of chemical P species in solution, in a soil under longstanding pig slurry applications and crop cultivation.
mAtEriAl And mEthods
location of the experimental area and soil In this study, soil columns with undisturbed structure derived from a long-term experiment, at the Universidade Federal de Santa Maria, Santa Maria (RS) (29º 43’ 12” S, 53º 43’ 4” W). The experiment was established in 2000, on a Typic hapludalf soil (Soil Survey Staff, 2006), with the following properties (0-10 cm layer), prior to the experiment: 170 g kg-1 clay, 300 g kg-1 silt, 530 g kg-1 sand, 16 g kg-1 organic matter, ph in water 4.7, 15 mg kg-1 P, and 96 mg kg-1 availableK (both extracted by Mehlich-1); 0.8, 2.7, 1.1 cmolc dm-3 Al3+, Ca2+ and Mg2+ exchangeable, respectively (extracted by 1 mol l-1 KCl).
history of the sampling area and soil columns The soil was collected in a field experiment conducted from 2000 to 2008 under no tillage (nT). In the crop rotation system used in this period, black oat (Avena strigosa S.) was predominant in fall/winter and maize (Zea mays l.) in spring/summer. The treatments consisted of applications of PS, at rates
of 0, 20, 40, and 80 m³ ha-1, being the only source of nutrients, applied on the surface by broadcasting before crop implementation, resulting in a total of 19 applications in the eight years of cultivation. The experiment was arranged in a randomized block design with three replications.
In January 2008, two soil columns with undisturbed structure were taken from each treatment replication, with a total of six columns per treatment. The soil was collected in PVC tubes (diameter 200 mm, length 650 mm), coupled to a monolith collector and driven into the soil by hand, to a depth of 60 cm. After sampling, the ends of the soil columns were covered with dark plastic and stored in a protected environment, in the same arrangement of the layers as in the field experiment.
crops
The soil columns were placed on benches in the greenhouse. Then, moisture was restored with distilled water to reach field capacity, which was maintained throughout the experimental period. Irrigation was applied with plastic drippers (intravenous catheters). In this way, the intensity of the water supply could be controlled, preventing the formation of a water film on the soil surface, which could maximize preferential flow.
Before planting the crops, soil moisture was maintained at field capacity for 30 days, to restore the biological activity (Butterly et al., 2009). Soon after this period the treatments 0, 20, 40, and 80 m3 ha-1 PS were applied again. The amount of slurry added to each column was defined based on the soil surface area so that, at PS rates of 20, 40 and 80 m3 ha-1, respectively, 63, 126 and 252 ml PS was applied per column.
In May 2012, in a randomized block design with three replications, where the soil columns represented the experimental units, 20 oat seeds per soil column were sown. Ten days after emergence, the plants were thinned to 11 per soil column, which were grown for 71 days, coinciding with flowering. Thereafter, the shoots were cut and oven-dried at 65 °C to constant weight to determine dry matter (DM). A small subsample was retained for chemical analysis and the rest of the oat DM was distributed on the surface of the respective soil column. In the following, PS rates were reapplied on oat residues, to simulate the manure applications in the field experiment, and for maize cultivation.
soil sampling and solution extraction
For this study two samplings were carried out: the first before planting oat and maize and the second after the two crops. In three of the six columns per treatment, the 1st sampling of soil was performed by opening the side of the PVC tube and collecting soil from the 0-5, 5-10, 10-20, 20-30, 30-40 and 40-60 cm layers of each column collected in three replications of the field experiment. In the other three columns per treatment, PS rates were reapplied, preceding black oat and maize planting. This resulted in a total of 21 PS applications at the end of the crops in the greenhouse, because the soil used in this study was collected from a field experiment in which 19 applications of PS had been made. The 2nd soil sampling in the other three columns per treatment was performed after the two crops, in the same layers as described for the first sampling.
The soil of the two samplings was divided into two portions. One portion was refrigerated at 4 ºC. From these samples, the soil solution was extracted by the saturated soil paste method, adapted from the aqueous extract method proposed by Wolt (1994). To this end, 800 g of soil was placed in a 1-l plastic container with Milli-Q water, under stirring, until a thin layer of water was formed on the soil mass. The saturated soil was left to stand for 16 h to reach soil solution equilibrium, and was then placed in a Büchner funnel with qualitative filter paper (particle retention of 4-12 μm). The soil solution was extracted using a suction flask (Kitassato), coupled to a funnel and a suction pump. The second portion of soil was air-dried, sieved through 2 mm mesh and stored for chemical analysis.
chemical analysis of soil, soil solution and plant tissue
The ph was determined in one portion of the solution. The rest of the extracted solution was filtered through 0.45 μm cellulose membrane. In the filtrate, dissolved organic carbon (DOC), was determined as described by Silva and Bohnen (2001); the total contents of Al, Ca, Mg, Cu, Zn, Mn, K, Fe, and P were determined by Atomic Emission Spectrometer with Inductively Coupled Plasma (ICP Perkin-Elmer); and the nO3-, SO
42- and Cl- contents by ion chromatography (S 135 Ion Chromatography System). The dissolution of P was represented using the partition coefficient (Kd) obtained by the equation Kd = total soil P/total solution P.
The ionic solution was speciated using the computer program Visual Minteq (version 3.0 - Gustafsson, 2012), from the mean of three replications of the total concentrations of cations (Al3+, Ca2+, Mg2+, Zn2+, Cu2+, Mn2+, Fe2+, and K+), anions (PO
4-, nO3-, SO42-, and Cl-), DOC and ph, determined in solution (Table 1). In this way, the percentage distribution of the P species in solution was obtained.
From the second portion of the sampled and stored soil, P was extracted by Mehlich-1 (Tedesco et al., 1995) and total P by microwave-oven digestion, using the method EPA 3051A (Usepa, 2007). In the oat and maize tissues, total P was quantified by acid digestion (Tedesco et al., 1995). The P concentration in soil and plant tissue was determined by the method described by Murphy and Riley (1962).
statistical analysis
The distribution data of P in the profile and partition coefficients (Kd) were subjected to analysis of variance for each sampled layer, using the statistical program SISVAR (Ferreira, 2011), with the yijk = μ + Bi + Tj + errora (i,j) + Dk + errorb (i,k) + T.Djk + errorc, where: μ = overall experimental mean; B = blocks (j = 1,2,3); T = treatments (i = 1,2,3,4); D = depth (j = 1,2,3,4,5,6); and error = experimental error. Significant results were compared by the Scott-Knott test (p<0.05) and regression equations generated for the Kd between the treatments in the same layer, dry matter production and cumulative P.
rEsults
In the 1st sampling, i.e., after restoring moisture and before applying PS for oat and later maize planting, in the 0-5 and 5-10 cm layer, the P concentrations in solution were highest at a PS rate of 80 m3 ha-1, followed by 40 m3 ha-1 (Figure 1a). The 19 PS rates of 20 m3 ha-1 applied to the soil in eight years in the field, were insufficient to raise the P concentration in the solution to higher levels than in the soil without PS application, in the 0-5 and 5-10 cm layers.
In the 2nd sampling, i.e., after reapplication of PS rates to the soil columns for black oat and maize cultivation, P concentrations in the solution were higher in the surface layers (0-5, 5-10, and 10-20 cm) treated with 40 and 80 m3 ha-1 PS (Figure 1b). In the soil treated with 80 m3 ha-1 PS, P in solution increased down to the 20-30 cm layer. In the 30-40 and 40-60 cm layers, no change was detected in the P concentration in solution. In the 2nd sampling, P concentration in solution was lower than in the 1st in the 0-5 and 5-10 cm layers in all treatments, except in the 0-5 cm treated with 80 m3 ha-1 PS.
table 1. chemical properties in the soil solution in the 1st and 2nd sampling of a typic hapludalf soil
treated with 0, 20, 40, and 80 m3 ha-1 of pig slurry (Ps)
sampling layer Al ca mg mn K fe cl- no
3- so42- doc ph
cm mg l-1
0 m³ ha-1 of PS
1st 0-5 0.12 52.71 32.22 0.40 6.44 0.08 5.7 546.9 10.4 17.63 5.76
5-10 0.31 53.25 12.08 0.45 4.38 0.13 5.9 323.6 6.9 20.09 5.28
10-20 0.08 40.86 22.92 0.64 2.71 0.08 8.5 471.3 14.0 11.48 4.99
20-30 0.20 72.45 42.95 1.43 2.59 0.07 9.1 810.4 2.8 7.79 4.71
30-40 0.22 59.37 52.66 0.88 2.64 0.08 3.5 219.6 6.9 13.94 4.75
40-60 0.31 43.89 37.15 0.70 2.36 0.09 5.9 346.2 1.6 13.53 3.90
2nd 0-5 1.53 0.36 0.15 0.01 0.23 0.46 16.2 1.2 11.3 11.27 7.20
5-10 1.16 0.05 0.09 0.00 0.17 0.67 11.1 2.2 4.3 13.00 6.91
10-20 0.70 0.32 0.10 0.00 0.25 0.38 5.7 8.6 6.2 2.60 6.36
20-30 0.08 0.53 0.17 0.01 0.09 0.07 6.4 11.1 7.9 1.02 6.57
30-40 0.07 0.66 0.45 0.04 0.34 0.41 12.2 30.1 9.3 1.30 6.14
40-60 0.10 2.30 1.38 0.05 0.33 0.02 8.5 202.7 12.8 1.73 3.56
20 m³ ha-1 of PS
1st 0-5
0.17 177.72 131.81 0.48 9.15 0.02 8.5 1291.8 53.4 29.52 5.49
5-10 0.09 81.24 55.01 0.53 4.47 0.01 5.5 564.8 17.2 11.89 4.46
10-20 0.15 73.13 44.81 0.33 2.20 0.01 6.3 517.0 11.5 4.51 4.53
20-30 0.04 53.98 30.60 0.27 2.15 0.04 5.9 363.1 11.0 4.10 5.05
30-40 0.12 53.12 36.11 0.75 2.31 0.07 5.0 353.2 3.8 4.07 5.17
40-60 0.07 45.93 27.36 0.41 1.73 0.07 5.2 284.4 2.9 3.69 5.17
2nd 0-5 1.54 1.12 0.50 0.03 0.23 0.71 8.4 0.0 23.7 15.89 7.42
5-10 3.09 0.10 0.20 0.01 0.18 1.58 7.5 0.3 10.56 19.36 7.25
10-20 2.92 0.07 0.16 0.01 0.34 1.54 13.6 2.4 15.9 15.60 7.11
20-30 2.14 0.08 0.12 0.01 0.19 1.32 11.7 3.9 11.5 16.49 7.04
30-40 2.66 0.11 0.16 0.01 0.12 1.75 7.6 1.9 12.4 17.77 6.92
40-60 2.61 0.82 0.18 0.01 0.13 1.85 9.9 2.3 11.7 27.31 6.82
40 m³ ha-1 of PS
1st 0-5 0.13 147.79 127.42 1.83 10.36 0.02 9.3 986.8 62.0 54.54 5.72
5-10 0.18 148.21 125.18 0.72 7.61 0.01 11.2 870.5 35.3 30.34 4.76
10-20 0.13 71.00 57.40 0.55 2.44 0.02 10.3 1223.8 61.0 4.92 4.75
20-30 0.05 53.39 43.50 0.23 1.64 0.00 6.9 623.2 21.9 5.33 4.98
30-40 0.05 46.06 37.16 0.28 1.30 0.00 6.3 263.6 7.6 4.10 4.72
40-60 0.07 34.32 28.97 0.35 1.22 0.01 8.4 326.2 6.4 4.65 4.53
2nd 0-5 0.30 3.35 2.17 0.19 0.51 0.17 11.1 0.0 27.3 50.41 7.24
5-10 0.48 1.45 0.95 0.03 0.41 0.13 11.5 0.4 32.3 33.98 7.16
10-20 0.25 1.33 0.88 0.01 0.16 0.15 9.7 1.6 25.1 26.74 7.15
20-30 0.38 1.43 0.57 0.00 0.23 0.21 8.7 1.6 26.7 29.80 7.18
30-40 0.14 0.84 0.40 0.01 0.23 0.11 15.3 1.7 35.6 30.08 6.95
40-60 0.16 0.41 0.36 0.01 0.19 0.07 9.2 1.5 21.2 22.14 6.62
80 m³ ha-1 of PS
1st 0-5 0.22 506.51 375.09 1.87 26.77 0.03 9.8 2486.7 364.0 104.15 5.23
5-10 0.14 274.90 152.17 3.69 18.15 0.01 10.0 2103.1 324.2 49.21 5.18
10-20 0.09 122.27 113.08 0.38 4.47 0.01 7.8 1081.5 50.9 7.79 5.37
20-30 0.08 62.33 52.32 0.24 2.07 0.01 7.2 457.2 22.2 2.73 4.90
30-40 0.16 48.81 37.00 0.40 1.65 0.01 6.3 396.7 15.3 5.74 4.05
40-60 0.10 47.31 33.47 0.56 1.66 0.01 7.4 542.3 18.1 2.46 4.07
2nd 0-5 0.39 4.24 3.47 0.12 0.51 0.15 11.8 0.3 60.4 41.36 7.25
5-10 0.17 1.63 1.17 0.02 0.31 0.10 13.2 0.1 47.8 26.46 7.18
10-20 0.09 2.35 1.80 0.03 0.26 0.05 9.3 1.0 44.2 23.67 7.13
20-30 0.09 2.30 1.66 0.03 0.55 0.06 8.3 0.3 51.6 20.61 7.15
30-40 0.08 0.99 0.67 0.01 0.40 0.12 6.4 0.3 51.3 18.94 7.14
0 1 2 3 4 5 6 0-5
5-10
10-20
20-30
30-40
40-60
0 1 2 3 4 5 6
0 100 200 300 400 500 600
La
ye
r
(c
m)
0-5
5-10
10-20
20-30
30-40
40-60
0 100 200 300 400 500 600
0 200 400 600 800 1,000 1,200 1,400 1,600 0-5
5-10
10-20
20-30
30-40
40-60
P (mg L-1) P (mg L-1)
P (mg kg-1) P (mg kg-1)
40 m3 ha-1 PS
20 m3 ha-1 PS 80 m3 ha-1 PS
0 200 400 600 800 1,000 1,200 1,400 1,600
1st Sampling 2nd Sampling
(a) (b)
(c) (d)
(e) (f)
*
*
*
ns
ns
ns
*
*
*
*
ns
ns
*
*
*
*
ns
ns
ns
ns
ns ns
ns *
*
*
*
*
*
*
*
*
*
*
*
*
without PS
figure 1. Phosphorus in solution (a, b), P extracted by mehlich-1 (c, d), total P (e, f) in the 1st and 2nd
sampling, in a typic hapludalf soil treated with 0, 20, 40, and 80 m3 ha-1 pig slurry. *: significant at
soil without PS application. Also in the 2nd sampling, there was a reduction in P extracted by Mehlich-1 in the 0-5 and 5-10 cm layers in all treatments, compared to the 1st sampling.
The total P content in the 1st and 2nd samplings increased with increasing PS rates in the 0-5 and 5-10 cm layers (Figures 1e and 1f). In the 1st sampling, the total P concentration in soil treated with 40 to 80 m3 ha-1 increased to the 20-30 cm layer. At the rate of 20 m3 ha-1, the increase was observed only to a depth of 10 cm in both samplings. In the 2nd sampling, the total P concentration increased to the depth of 30-40 cm at a PS rate of 80 m3 ha-1.
The partition coefficient (Kd) in the 1st sampling decreased linearly with increasing PS rates in the 0-5 and 5-10 cm layers (Table 2). In the 2nd sampling, K
d decreased with increasing PS rates between 0-5 and 30-40 cm (Table 2). In this sampling, Kd increased in all soil layers without PS application, compared with the 1st sampling. At the PS rate of 20 m3 ha-1, the K
d value increased down to the 30-40 cm layer. however, at the highest rates, of 40 and 80 m3 ha-1, the K
d values did not differ between the samplings until to the 10-20 and 20-30 cm layers, respectively, with an increase in Kd after cultivation only in the layers below these.
The DM of black oat and maize plants increased with increasing PS rates (Table 3). The oat DM yield was 2.14, 2.27 and 2.57 times and maize DM 3.54, 5.29 and 7.34 times higher than on soil without PS application, at rates of 20, 40 and 80 m³ ha-1 respectively. The PS applications also caused an increase in cumulative P (Table 3), with increments of 325, 463 and 623 % in oat and 863, 1668 and 2578 % in maize in relation to the soil without PS application, at PS rates of 20, 40 and 80 m³ ha-1, respectively.
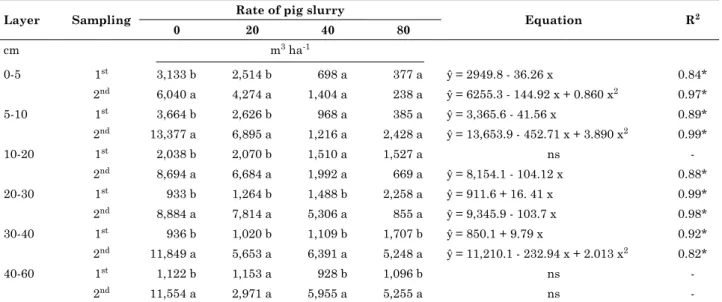
The prevailing chemical species of P in the soil solution in all treatments, layers and samplings were the orthophosphates (h2PO4- and hPO42-) (Figure 2). The sum of these two species represented proportions of more than 79 and 92 % in the soil solution in the 1st and 2nd sampling, respectively. In the 1st sampling in all layers and treatments, the prevailing chemical species of P in the soil solution was h2PO4-, representing 75 to 92 % of P in solution. But in the 2nd sampling, the proportion of h2PO4- decreased in soils treated with PS and in surface soil layers without PS application. The reduction in the monovalent species (h2PO4-) in the 2nd sampling was accompanied by an increase in the proportion of divalent species (hPO42-) (Figure 2). In the 1st sampling, the second largest proportion of phosphate in the layers below 5-10 cm at a rate of 80 m3 ha-1 and in all layers of the other treatments, was complexed with Al (AlhPO4+), although with a greatly reduced percentage of this species in the 2nd sampling in all treatments.
The largest proportion of AlhPO4+ was observed in the soil without PS application, reaching 20.7 % in the 5-10 cm layer in the 1st sampling. In this sampling, hPO42- accounted for a small fraction of P in the soil solution without PS application, with lower percentages in deeper layers (Figure 2). In the 2nd sampling however, the percentage of hPO
4-2 increased in the solution of the layers between 0-5 and 30-40 cm, and was highest in the 0-5 cm layer. The increase in hPO4-2 was accompanied by a reduction in AlhPO4+, with percentages from 1.0 to 2.9 % in the layers below 5-10 cm in soil without PS application.
In the 1st sampling of soil treated with 20 m3 ha-1 PS, the percentages of the hPO
42- species
Table 2. Distribution coefficients (Kd) between the solid phase and the solution in the 1st and 2nd sampling
in a typic hapludalf soil treated with 0, 20, 40, and 80 m3 ha-1 of pig slurry
layer sampling rate of pig slurry Equation r2
0 20 40 80
cm m3 ha-1
0-5 1st 3,133 b 2,514 b 698 a 377 a ŷ = 2949.8 - 36.26 x 0.84*
2nd 6,040 a 4,274 a 1,404 a 238 a ŷ = 6255.3 - 144.92 x + 0.860 x2 0.97*
5-10 1st 3,664 b 2,626 b 968 a 385 a ŷ = 3,365.6 - 41.56 x 0.89*
2nd 13,377 a 6,895 a 1,216 a 2,428 a ŷ = 13,653.9 - 452.71 x + 3.890 x2 0.99*
10-20 1st 2,038 b 2,070 b 1,510 a 1,527 a ns
-2nd 8,694 a 6,684 a 1,992 a 669 a ŷ = 8,154.1 - 104.12 x 0.88*
20-30 1st 933 b 1,264 b 1,488 b 2,258 a ŷ = 911.6 + 16. 41 x 0.99*
2nd 8,884 a 7,814 a 5,306 a 855 a ŷ = 9,345.9 - 103.7 x 0.98*
30-40 1st 936 b 1,020 b 1,109 b 1,707 b ŷ = 850.1 + 9.79 x 0.92*
2nd 11,849 a 5,653 a 6,391 a 5,248 a ŷ = 11,210.1 - 232.94 x + 2.013 x2 0.82*
40-60 1st 1,122 b 1,153 a 928 b 1,096 b ns
-2nd 11,554 a 2,971 a 5,955 a 5,255 a ns
-Means followed by the same letter in the column do not differ from each other in the 1st and 2nd sampling, in the same layer, by
were lower than 5.3 % of P in solution (Figure 2). The AlhPO4+ species accounted for high proportions of P species, reaching 15.5 % in the 10-20 cm layer. In this sampling it was also observed, that at a PS rate of 20 m3 ha-1, the proportion of phosphate complexed with Ca and Mg was significant, forming the species Cah2PO4+ and MghPO
4(aq), especially
in the 0-5 cm layer, where Cah2PO4+ accounted for 3.7 % and MghPO4(aq) for 1.3 % P in solution. In the 2nd sampling, the percentages of Cah
2PO4+ and MghPO4(aq) were negligible in all layers in this treatment (<0.7 %) (Figure 2).
In the soil treated with 40 m3 ha-1 PS in the 0-5 cm layer in the 1st sampling, a greater percentage of
Without PS
0-5
5-10
10-20
20-30
30-40
40-60
40 m3 ha-1 PS
HPO4-2 H
2PO4
-80 m3 ha-1 PS
20 m3 ha-1 PS
0 20 40 60 80 100
0-5
5-10
10-20
20-30
30-40
40-60
0 20 40 60 80 100
Sampling
La
ye
r
(c
m)
Species (%)
1st
2nd
1st
2nd
1st
2nd
1st
2nd
1st
2nd
1st
2nd
1st
2nd
1st
2nd
1st
2nd
1st
2nd
1st
2nd
1st
2nd
CaHPO4(aq) CaH2PO4+
FeHPO4(aq) MgHPO4(aq)
Other species AlHPO4+
figure 2. chemical species of P in the 1st and 2nd sampling in the solution of a typic hapludalf soil in
response to the application of 0, 20, 40, and 80 m3 ha-1 of pig slurry (Ps). other species correspond to
MghPO4(aq) was observed, representing 3.9 % of the P species, while in the same layer, the species Cah2PO4+ and CahPO4(aq), were represented by 3.3 and 3.9 %, respectively. These species had lower percentages in the deeper layers. In the 2nd sampling after 21 PS applications of 40 m3 ha-1, significant proportions (1.2 %) of AlhPO4+ were only found in the 40-60 cm layer. In this sampling, in the solution of the layers between 0-5 and 30-40 cm, approximately 50 % of P in the solution was found in hPO42-, with a lower percentage of this monohydrogen species in the 30-40 and 40-60 cm layers.
Smaller percentages of AlhPO4+ in the 1st sampling were found in the 0-5 and 5-10 cm layers, at a rate of 80 m3 ha-1 PS (Figure 2). In these layers, higher percentages of phosphate complexed with Ca and Mg were also observed, especially in the 0-5 cm layer, where the species Cah2PO4+ and CahPO4(aq) accounted for 8.1 and 1.4 % of soluble P and MghPO4(aq) for 2.6 % (Figure 2). In the solution of the 2nd sampling, approximately 50 % of P was observed in the form of hPO42- in all soil layers with PS application of 80 m3 ha-1. The percentages of MghPO4(aq), CahPO4(aq) and Cah2PO4+ on the other hand, decreased compared to the 1st sampling. Only MghPO4(aq) was detected at higher percentages than 1 % in the solution of the layers between 0-5 and 20-30 cm. Other species in the solution of all layers of the treatments and in the two samplings, such as h3PO4, Feh2PO4+, Kh2PO4(aq), CaPO4-, MnhPO4(aq), and Al2PO43+, were observed at low percentages.
Principal component analysis (PCA) of the 1st sampling analyzed the sum of variability in the components that explain 93.37 % of the original variability of results (Figure 3a). Of this total, 72.90 % was explained by factor 1 and 20.47 % by factor 2. The score distribution in each group across factor 1 was related to the PS rates, separating the treatments 80 and 40 m3 ha-1 PS from the rate of 20 m3 ha-1, and from soil without PS application. For this separation, the most influential variables in the group of higher rates (80 and 40 m3 ha-1) were h
2PO4-, Cah2PO4-, MghPO(aq), CahPO(aq), and the concentration of the elements Mg, Ca, nO3-, P, SO
42-, K, DOC, and P added. In the group formed by the soil without PS application and the PS rate of 20 m3 ha-1, the species with highest contribution were FehPO4(aq), AlhPO4+, hPO42- and the elements Al and Fe, and ph.
In the 2nd sampling, the treatments formed distinct groups again, where the sum of variability in the components explained 94.2 % of the variability of the results, 68.0 % of which was explained by factor 1 and 26.20 % by factor 2 (Figure 3b). Similarly to the 1st sampling, factor 1 separated the soil without PS application on the right side of the graph, together with the PS rate of 20 m3 ha-1 (Figure 3b), where the h2PO4-, AlhPO4+, FehPO4(aq) species, and the concentrations of Al, Fe and nO3- were the most influential variables. In the group on the left side,
constituted by the PS rates of 80 and 40 m3 ha-1, the most influential variables were the species MghPO(aq), CahPO(aq), hPO42- and the elements SO42-, P, K, Ca, Mg, Mn, applied P, and ph.
discussion
The accumulation of total P, P extracted by Mehlich-1 and P in soil solution (Figure 1) in the upper soil layers occurred because of the application of large amounts of P in PS in the 21 applications (707.8; 1415.6 and 2831.2 kg ha-1 P at rates of 20, 40 and 80 m3 ha-1, respectively). In addition, phosphate forms inner-sphere complexes with functional groups of reactive inorganic soil particles, which decreases phosphate mobility and raises its concentration near application sites in the surface layers of nT systems, as in this study (Guardini et al., 2012). These results are similar to those of Gatiboni et al. (2008) in an experiment on native pasture treated with 0, 20 and 40 m3 ha-1 PS in 28 applications for 48 months, where P extracted by Mehlich-1 was accumulated to a depth of 20 cm and total P to a depth of 15 cm. likewise, Guardini et al. (2012) observed accumulation of P extracted by Mehlich-1 and total P down to a depth of 15 and 30 cm, respectively, in a hapludalf treated with pig slurry and deep-litter for eight years, in a succession of black oat/maize under nT.
Phosphorus accumulation in the upper soil layers is desirable, for being the region of concentrated thinner crop roots responsible for most of the nutrient and water uptake (Bortoluzzi et al., 2014), which is reflected in a greater quantity of P accumulated in the shoots and in DM production (Chantigny et al., 2008), as observed in oat and maize (Table 3). But on the other hand, part of the P accumulated in the upper soil layers can be transferred in soluble form in the runoff solution or adsorbed to particles, to surface waters adjacent to the cultivated area, increasing the risk of water eutrophication, which is undesirable (Ceretta et al., 2010b; Wang et al., 2013; Schmitt et al., 2014).
in biopores (Ceretta et al., 2010a). The migration of P in the profile, especially in soils with sandy texture, as in the Typic hapludalf of this study, the risk of subsurface water contamination is greater, especially in soils where the water table is shallower,
making the water unfit for human consumption (Sorensen and Rubaek, 2012; Girotto et al., 2013; lourenzi et al., 2014).
The P extracted by Mehlich-1 to a depth of 10 cm in the soils under application of all PS (a)
(b)
Factor 1 (72.90 %)
-6 -4 -2 0 2 4 6
Fact
or
2
(2
0.47
%)
-4 -3 -2 -1 0 1 2 3 4
Al
FeHPO4(aq)
Fe
AlHPO4+
pH HPO4-2 CaHPO4(aq)
MgHPO4(aq) C
P ad ded
H2PO− 4
H2PO4 -K-2
SO4 P
CaH2PO− 4 Ca
Mg NO−
3 Without PS
20 m3 ha-1
40 m3 ha-1
80 m3 ha-1
Factor 1 (68.0 %)
-6 -4 -2 0 2 4 6
Fact
or
2
(2
6.20
%)
-4 -2 0 2 4
pH HPO4-2 P tecido
MS
P added AlHPO
4 + CaH2PO4+
Mn Ca
MgHPO4(aq) Mg
FeHPO4(aq) Fe C
NO− 3Al CaHPO4(aq)
SO4 -2 K
P
figure 3. relationship between principal component 1 (factor 1) and principal component 2 (factor 2), the chemical species of P and chemical elements in solution in the 1st (a) and 2nd sampling (b) in a
rates in both samplings were interpreted as very high (>42.0 mg dm-3 for soils with texture class 4 = ≤20 % clay) (CQFSRS/SC, 2004), i.e., above the sufficiency level (21 mg dm-3 for soils with texture class 4 = ≤20 % clay) (CQFSRS/SC, 2004) for crops, maximizing the risk of nutrient transfer. In addition, according to Gatiboni et al. (2014), 59 mg P dm-3 in the 0-10 cm layer in soils containing ≤20 % clay is regarded as the critical limit, which is the safe level which can be achieved in soil and, consequently, levels above this value can cause water contamination. In this study, in the 0-10 cm layer at all PS rates, the P concentrations extracted by Mehlich-1 exceeded the safety threshold. On the other hand, with the PS application of 80 m3 ha-1, the P content exceeded the critical limit to the 20-30 cm layer, showing the risk of contamination of water resources even at low rates (20 m3 ha-1), when applied repeatedly in nT.
The reduction of Kd in soil with increasing PS rates in the two samplings indicates that a major fraction of the total P content is in solution (Table 2). This was probably due to saturation of the reactive sites of inorganic particles, which altered the equilibrium between the solid and liquid phases of the soil (Berwanger et al., 2008; Ceretta et al., 2010a). The low Kd values found in the surface soil layers treated with PS rates in both samplings can be explained in part by the adsorption of organic substances derived from the degradation of PS applied to the soil, favoring desorption and increasing the P concentration in the soil solution (Berwanger et al., 2008).
The increase in P concentration in solution probably contributed to a greater DM production and cumulative P in shoot tissues of oat and maize (Table 3). Aside from the organic compounds, an increase in the SO42- concentration in solution, especially in soil treated with PS rates of 40 and 80 m3 ha-1 (Table 1), may have promoted competition for the functional groups of the surface of reactive particles, increasing the desorption of P retained with less energy (Meurer, 2010). Also, the increase in ph in the solution in the 2nd sampling in all treatments probably promoted the deprotonation of surface functional groups, reducing P adsorption (Barrow, 1983). It should be stressed that at the lower Kd value observed in the 0-5 cm layer in the 2nd sampling, treated with 80 m3 ha-1 PS, the soluble P concentration represented 0.4 % of the total content, which is higher than 0.1 %, the normal value in agricultural soils (loehr, 1984). Possibly, this great accumulation of P in inorganic forms, readily taken up by plants, explains the unchanged Kd in the surface layers between the 1st and 2nd sampling at PS rates of 40 and 80 m3 ha-1.
The P concentration in soil solution in the surface layer (0-5 cm) in all soils with PS application was above 0.15 mg l-1, which is the maximum concentration allowed for class 3, for water that can
be used for human consumption after appropriate treatment (Conama, 2005). In the surface layer in the 2nd sampling, the P concentration in the solution of soil treated with 80 m3 ha-1 was higher than 0.15 mg l-1 down to the 20-30 cm layer, confirming the interpretation of the critical limits of environmental contamination, which are above the critical limit (59 mg dm-3 P extracted by Mehlich-1 for soils with clay content ≤20 %) (Gatiboni et al., 2014) down to this depth, evidencing the risk of contamination of subsurface waters by applications of high PS rates to sandy soils for long periods.
The decrease in soluble P concentration and extracted by Mehlich-1 in the upper soil layers of all treatments in the 2nd sampling probably occurred because of P uptake by plants, which was reflected in an increase in cumulative P in the oat and maize shoots and even in DM production with increasing PS rates (Table 3). But even with the reduction in P concentration in solution in the 0-10 cm layer of soils treated with pig slurry, the concentrations were higher than those considered adequate for a good development of most grasses, which according to Hinsinger (2001), varies between 1-5 μmol L-1, requiring no reapplication of P.
The predominance of the h2PO4- species in solution in all soils in the 1st sampling and the increase in the percentage of hPO42- in the 2nd sampling can be attributed to the ph of the solution, since in the 1st sampling, ph values were lower than 6.0 and after cultivation, the ph values exceeded 7.0 in most layers, since at a ph of around 7.2, the percentage of these two species was similar (hinsinger, 2001). The reduction in the percentage of hPO42- and increase in h2PO4- in the deeper layers, in the soil without PS application and with a PS rate of 20 m3 ha-1 in the 2nd sampling, can be explained by a reduction in ph in the lower layers in these treatments.
The lower proportion of AlhPO4+ in the 1st sampling in the soil solution after PS applications of 40 and 80 m3 ha-1, especially in the 0-5 cm layer, can be attributed to the higher DOC concentration (Table 1), since Al3+ has greater affinity to organic compounds than to phosphate (nolla and Anghinoni, 2006). however, the reduction in AlhPO4+ in soil solution in all treatments in the 2nd sampling probably occurred because of the increase in the ph of the solution in response to the crops. The ph increased after black oat and maize cultivation in the solution of all treatments; this may indicate Oh-/hCO
3- exudation by plant roots, as a form of maintaining the electrochemical equilibrium, due to the absorption of anions such as nO3-, whose concentration in the solution decreased in all layers due to the cultivation of two grass species, which have a high demand for n, but also for P and SO42- in the surface layers (Table 1) (Gahoonia et al., 1992). Zambrosi et al. (2007) observed percentages higher than 40 % of AlhPO4+ in the solution in a clayey soil treated with gypsum, with a ph value in solution close to 5.0, which was similar to that observed in the deeper soil layers in all treatments in the 1st sampling, indicating that aside from the ph, the soil properties have a great influence on P species distribution in the soil solution.
The increase in the species Cah2PO4+, CahPO4(aq) and MghPO4(aq) in the solution of the upper soil layers in the 1st sampling, treated with 20, 40 and 80 m3 ha-1 PS (Figure 2), was probably because of the high Ca and Mg concentrations in solution (Table 1), since Ca and the species Cah2PO4+ and CahPO4(aq) were correlated, as well as Mg and MghPO4(aq) in PCA in the 1st and 2nd sampling (Figures 3a and 3b). The decrease in the species Cah2PO4+, CahPO4(aq) and MghPO4(aq) in the 2nd sampling in all soils probably occurred because the Ca and Mg concentrations decreased in solution (Table 1), due to oat and maize uptake.
The phosphate complexation with cations in solution, whose species formed from this interaction have a positive residual charge, such as Cah2PO4+
and AlhPO4+, tend to reduce migration in the soil profile, since with a positive residual charge, the complex tends to be retained by the cation exchange capacity (CEC) of the soil (Meurer, 2010). In turn, the ion pairs MghPO4(aq) and CahPO4(aq) possibly contributed to P migration in the profile or transfer in the runoff solution, since the charge resulting from these interactions with phosphate is zero, reducing the attraction by functional groups of the surface of reactive particles and facilitating water flow through the soil.
conclusions
The 21 pig slurry applications increased the total P content in the soil to a depth of 40 cm, and the P extracted by Mehlich-1 and the solution to 30 cm.
The successive pig slurry applications changed the balance of P between the solid and liquid phases in the soil surface layers, increasing the proportion of total P content in soil solution.
Pig slurry applications changed the chemical species of P in the soil solution, reducing the percentage of P complexed with aluminum and increasing P complexed with Ca and Mg in the 0-5 and 5-10 cm layers.
Black oat and maize cultivation increased ph in the solution, consequently increasing the proportion of hPO42- and reducing h
2PO4- species.
AcKnoWlEdgEmEnts
The authors are indebted to the Brazilian Council for Scientific and Technological Development (CnPq), Brazilian Federal Agency for Support and Evaluation of Graduate Education (CAPES) and Research Support Foundation of Rio Grande do Sul (FAPERGS) for financial support and scholarships. table 3. Production of dry matter (dm) and cumulative P in shoot oat and maize grown in a typic
hapludalf soil treated with 0, 20, 40, and 80 m3 ha-1 of pig slurry (Ps)
crop Variable rate of Ps Equation r2
0 20 40 80
m³ ha-1
g/column Black oat
DM 16.33 35.07 37.12 41.94 ŷ = 17.72 + 0.812 x - 0.0064 x
2 0.90*
Maize 21.27 74.45 112.53 156.28 ŷ = 21.62 + 2.899 x - 0.0152 x2 0.97*
mg/column Black oat
Cumulative P 28.45 92.47 131.86 177.40 ŷ = 29.56 + 3.383 x - 0.0192 x
2 0.99*
Maize 14.40 124.38 240.19 371.34 ŷ = 11.18 + 6.613 x - 0.0262 x2 0.99*
rEfErEncEs
Barrow nJ. A mechanistic model for describing the sorption and desorption of phosphate by soil. J Soil Sci. 1983;34:733-50. Berwanger Al, Ceretta CA, Rheinheimer DS. Alterações no teor de fósforo no solo com aplicação de dejetos líquidos de suínos. R Bras Ci Solo. 2008;32:2525-32.
Bortoluzzi EC, Parize Gl, Korchagin J, Silva VR, Rheinheimer DS, Kaminski J. Soybean root growth and crop yield in response to liming at the beginning of a no-tillage system. R Bras Ci Solo. 2014;38:262-71.
Butterly CR, nemann EK, Mcneill AM, Baldock JA, Marschner P. Carbon pulses but not phosphorus pulses are related to decreases in microbial biomass during repeated drying and rewetting of soils. Soil Biol Biochem. 2009;41:1406-16.
Ceretta CA, lorensini F, Brunetto G, Girotto E, Gatiboni lC, lourenzi CR, Tiecher Tl, De Conti l, Trentin G, Miotto A. Frações de fósforo no solo após sucessivas aplicações de dejetos de suínos em plantio direto. Pesq Agropec Bras. 2010a;45:593-602.
Ceretta CA, Girotto E, lourenzi CR, Trentin G, Vieira RCB, Brunetto G. nutrient transfer by runoff under no tillage in a soil treated with successive applications of pig slurry. Agric Ecosyst Environ. 2010b;139:689-99.
Chantigny Mh, Angers DA, Bélanger G, Rochette P, hamel nE, Bittman S, Buckley K, Massé D, Gasser MO. yield and nutrient export of grain corn fertilized with raw and treated liquid swine manure. Agron J. 2008;100:1303-9.
Comissão de Química e Fertilidade do Solo - CQFSRS/SC. Manual de adubação e de calagem para os estados do Rio Grande do Sul e de Santa Catarina. 10ª.ed. Porto Alegre: SBCS/núcleo Regional Sul; 2004.
Conselho nacional do Meio Ambiente - Conama. Resolução Conama nº 357. Brasília: 2005. Available at: http://www.crq4. org.br/downloads/resolucao357.pdf.
Ferreira DF. SISVAR: a computer statistical analysis system. Ci Agrotecnol. 2011;35:1039-42.
Frossard E, Condron lM, Oberson A, Sinaj S, Fardeau JC. Processes governing phosphorus availability in temperate soils. J Environ Qual. 2000;29:12-53.
Fundação Estadual de Proteção Ambiental/RS - Fepam. Programas e Projetos - Gestão de Ativos Ambientais. [Accessed Mar 25, 2008]. Available at: http://www.fepam.rs.gov.br/ programas/gestao_ativos.asp.
Gahoonia TS, nielsen nE. The effect of root-induced ph change on the depletion of inorganic and organic phosphorus in the rhizosphere. Plant Soil. 1992;143:183-9.
Gatiboni lC, Brunetto G, Kaminski J, Rheinheimer DS, Ceretta CA, Basso CJ. Formas de fósforo no solo após sucessivas adições de dejeto líquido de suínos em pastagem natural. R Bras Ci Solo. 2008;32:1753-61.
Gatiboni lC, Smyth TJ, Schmitt DE, Cassol PC, Oliveira CMB. Proposta de limites críticos ambientais de fósforo para solos de Santa Catarina. Florianopólis: CAV-UDESC; 2014. (Boletim técnico).
Girotto E, Ceretta CA, Rheinheimer DS, Brunetto G, Andrade JG, Zalamena J. Formas de perdas de cobre e fósforo em
água de escoamento superficial e percolação em solo sob aplicações sucessivas de dejeto líquido de suínos. Ci Rural. 2010;40:1948-54.
Girotto E, Ceretta CA, lourenzi CR, lorensini F, Tiecher Tl, Vieira RCB, Trentin G, Basso CJ, Miotto A, Brunetto G. nutrient transfers by leaching in a no-tillage system through soil treated with repeated pig slurry applications. nutr Cycl Agroecosyst. 2013;95:115-31.
Guardini R, Comin JJ, Rheinheimer DS, Gatiboni lC, Tiecher T, Schmitt DE, Bender MA, Belli Filho, P, Oliveira PAV, Brunetto G. Phosphorus accumulation and pollution potential in a hapludult fertilized with pig manure. R Bras Ci Solo. 2012;36:1333-42.
Gustafsson JP. Visual Minteq - version 3.0 beta. Online. [Accessed: nov 03, 2012]. Available at: http://www.lwr.kth.se/ english/oursoftware/Vminteq.
hinsinger P. Bioavailability of soil inorganic P in the rhizosphere as affected by root-induced chemical changes: A review. Plant Soil. 2001;237:173-95.
loehr RC. Pollution control for agriculture. 2nd.ed. Orlando:
Academic Press; 1984.
lourenzi CR, Ceretta CA, Cerini, J.B, Ferreira PAA, lorensini F, Girotto E, Tiecher Tl, Schapanski DE, Brunetto G. Vailable content, surface runoff and leaching of phosphorus forms in a typic hapludalf treated with organic and mineral nutrient sources. R Bras Ci Solo. 2014;38:544-56.
Meurer EJ. Fundamentos de química do solo. 4ª.ed. Porto Alegre: Evangraf; 2010. v.1.
Murphy J, Riley JP. A modified single solution method for
determination of phosphate in natural waters. Anal Chem Acta. 1962;27:31-6.
nolla A, Anghinoni I. Atividade e especiação química na solução afetadas pela adição de fósforo em latossolo sob plantio direto em diferentes condições de acidez. R Bras Ci Solo. 2006;30:955-63. Oburger E, Jones Dl, Wenzel WW. Phosphorus saturation
and pH differentially regulate the efficiency of organic acid
anion-mediated P solubilization mechanisms in soil. Plant Soil. 2011;341:363-82.
Schachtman DP, Reid RJ, Ayling SM. Phosphorus uptake by plants: from soil to cell. Plant Physiol. 1998;116:447-53. Schmitt DE, Gatiboni lC, Girotto E, lorensini F, Melo GWB, Brunetto G. Phosphorus fractions in the vineyard soil of the Serra Gaúcha of Rio Grande do Sul, Brazil. R Bras Eng Agric Amb. 2014;18:133-40.
Silva lS, Bohnen h. Mineralização de palha de milho e adsorção de carbono, cálcio, magnésio e potássio em substratos com caulinita natural e goethita sintética. R Bras Ci Solo. 2001;25:289-96.
Soil Survey Staff - Soil Taxonomy. A basic system of soil
classification for making and interpreting soil surveys. 2nd.ed.
Washington: US Government Printing Office; 2006.
United States Environmental Protection Agency - USEPA. Method 3051A: microwave assisted acid digestion of sediments, sludges, soils, and oils. In: Sw-846: Test methods for evaluation solid waste physical and chemical methods. Washington: 2007.
Zambrosi FCB, Alleoni lRF, Caires EF. Aplicação de gesso agrícola e especiação iônica da solução de um latossolo sob sistema plantio direto. Ci Rural. 2007;37:111-7.
Zambrosi FCB, Alleoni lRF, Caires EF. liming and ionic speciation of an Oxisol under no-till system. Sci Agric. 2008;65:190-203. Wang W, liang T, Wang l, liu y, Wang y, Zhang C. The effects of fertilizer applications on runoff loss of phosphorus. Environ Earth Sci. 2013;68:1313-9.