Food Science and Technology ISSN 0101-2061
DI:
D http://dx.doi.org/10.1590/1678-457X.06016
1 Introduction
The growing interest in new value-added foods and beverages with health-promoting properties has prompted the development of new beverages based on different types of water, juices and non-alcoholic drinks that are enriched in fruits, as natural sources of nutrients, colors, and bioactive phytochemicals, and the evaluation of their bioactivity is being necessary (Gironés-Vilaplana et al., 2015). Fruit juices are usually employed as food matrices for the production of functional foods. In fact, recent studies have shown that the beneficial properties of fruit juices can be increased by adding antioxidant sources (González-Molina et al., 2008; Sanchez-Bel et al., 2015).
With the increasing preference of consumers for natural and natural-like ingredients in various food products, the technology of blending various juices to obtain desired combination of nutrients and quality characteristics offers great promise for the fruit juice industry. Using this technology, a juice deficient in a particular nutrient can be enriched by blending with another natural juice, extract, etc., without compromising the basic nutrient composition and consumer acceptability of the original juice (Sharma et al., 2014).
Several studies have noted that lemon is a rich source of nutrients and phytochemicals, including flavonoids, citric acid, vitamin C and minerals (González-Molina et al., 2008), which have numerous health-promoting properties (González-Molina et al.,
2010; Mulero et al., 2012). For this reason, lemon juice is an interesting food matrix for developing new beverages and a suitable source for value-added products (Gironés-Vilaplana et al., 2012). The recent trend of consumer demand is in nutritious, healthy food. The blended beverage containing lemonade and herbal extracts will be a good option for the consumer. For this reason this study aims to design new beverages using lemonade and herbal extracts (linden, heather, green tea, lemon verbena, clove, peppermint, ginger and mate) to make alternative cold beverages that have high nutritional value and are preferred by consumers for their sensory properties.
2 Materials and method
2.1 Chemicals
Potassium sorbate and sodium benzoate were food grade and the other reagents were in analytical grade. TPTZ (2,4,6-Tris(2-pyridyl)-s-triazine) was purchased from Fluka (Switzerland). Trolox ((±)-6-Hydroxy-2,5,7,8-tetramethylchromane-2-carboxylic acid), DPPH (2,2-diphenyl-2-picrylhydrazyl), ABTS (2,2’-azino-bis (3-ethylbenzothiazoline-6-sulphonic acid), methanol, ethanol, sodium carbonate, gallic acid, potassium persulfate, tetrabutylammonium hydrogensulfate, meta-Phosphoric acid, nitric acid, zinc sulfate and sodium hydroxide were purchased from Sigma Aldrich (Germany). Iron
A study of fortification of lemonade with herbal extracts
Canan Ece TAMER1, Fatma Zehra YEKELER1, Ömer Utku ÇDPUR1*, Bige İNCEDAYI1, Senem SUNA1
Received 26 Feb., 2016 Accepted 27 June, 2016
1Department of Food Engineering, Faculty of Agriculture, Uludag University, Bursa, Turkey
*Corresponding author: [email protected]
Abstract
The aim of the present work was to design new beverages using lemonade and some herbal extracts (linden, heather, green tea, lemon verbena, clove, peppermint, ginger and mate) rich in vitamin C and flavonoids. The linden-added lemonade showed the highest value (597.9 mg/kg) for ascorbic acid content, whereas the lemon verbena-added lemonade showed the lowest value (486.04 mg/kg). The amount of saccharose was changed between 11.07-11.58%, the glucose by 1.11-1.62% and the fructose by 11.07-11.58% in the beverages. K, Na, Mg and P values in the lemonades were determined in the range of 178.83-210.98 mg/kg, 33.75-39.13 mg/kg, 22.37-27.89 mg/kg and 7.22-10.04 mg/kg, respectively. The total phenolic content in the samples changed between 315.11-397.57 mg GAE/100 g. When the samples were analyzed for antioxidant activity, FRAP (17.13-26.79 µmol trolox/mL) and ABTS (16.91-25.38 µmol trolox/mL) methods gave higher results than the DPPH (14.88-17.72 µmol trolox/mL) method. Linden-, ginger- and peppermint-added lemonades, which had been found to be rich in total phenolic compounds and ascorbic acid, showed higher antioxidant activity than the control sample. Dverall, the most preferred lemonades were heather- and ginger-added beverages and the control sample. Mate-added lemonade was the least preferred.
Keywords: lemonade; beverage; herbal extract; antioxidant activity.
(III) chloride, Folin-Ciocalteu reagent, acetonitrile, potassium hexacyanoferrate (II) trihydrate and hydrochloric acid were supplied from Merck (Germany).
2.2 Materials
The lemon juice concentrate was obtained from Limkon Fruit Juice Concentrate Plant in Adana, Turkey and the herbs were purchased from Kurtsan Food Company in Bursa, Turkey. These dried leaves were used as a raw material for infusion. Natural lemon flavor and lemon flavored emulsion were obtained from Aromsa in Kocaeli, Turkey.
2.3 Lemonade production
For lemonade production, sucrose, citric acid, ascorbic acid, sodium benzoate, potassium sorbate, lemon flavored emulsion, natural lemon flavor and water were added to lemon juice concentrate as determined in the formulation (Table 1) and stirred. Each herb extract was brewed as 1% (w/v) at 98 °C for 5 minutes and then cooled down to room temperature. According to the preliminary results, the extracts of lemon verbena (Lippia citriodora), mate (Ilex paraguarensis), clove (Eugenia caryophyllata) and green tea (Camellia sinensis) were each added to lemonade as 5% the total beverage volume, while the extracts of linden (Tilia argentea), ginger (Zingiber officinale), peppermint (Mentha piperita) and heather (Erica arborea), as 10%. After pouring into 200 mL glass bottles, they were capped and stored at 4 °C. The lemonade samples were stored for 6 months before analyses.
2.4 Analysis
Water soluble dry matter contents were measured in a refractometer (RA-500 model KEM) at 20 °C with values being expressed as “g/100 g”. The pH was measured using a Sevencompact pH/Ion Mettler Toledo pH meter. Titratable acidity was determined by titrating the samples to pH 8.1 with 0.1 N NaDH and expressed as citric acid content (Cemeroğlu, 2007). For sugar analysis, Agilent 1100 HPLC, HPLC Zorbax column, C18 Sugar-PAK (300 mm × 6.5 mm), Refractive Index Detector HP 1047 were used (Association of Dfficial Analytical Chemists, 2000). For the mobile phase 75% acetonitrile + 25% water was used. For sucrose analysis, 1 g sample was clarified by Carrez solutions and mobile phase mixture was added. The filtered sample was degassed by ultrasonic water bath and diluted
to calibration curve. The dilution was taken to vial after filtration through 0.45 µm membrane. For glucose and fructose analysis, inversion was carried out as well by holding the samples in an ultrasonic water bath for 10 min. For ascorbic acid determination, Agilent 1100 HPLC with a UV detector and a C-18 column were used (Hışıl, 2008). For mobile phase 945 mL tetra butyl ammonium hydrogen sulfate was mixed with 55 mL methanol, and its pH was adjusted to 2-2.5. Then, it was filtered through 0.45 µm membrane and degassed by ultrasonic water bath. The mineral content of the samples was determined using Agilent 7500 cx ICP-MS (Nordic Committee on Food Analysis, 2007). The samples were incinerated in a BERGHDF MWS–3+ microwave oven. Total phenolics of the samples were determined on the basis of Folin-Ciocalteu colorimetric method as described by Spanos & Wrolstad (1990). Phenolic content was expressed as gallic acid equivalents, mg GAE/100 g. ABTS·+ Radical Scavenging Assay, Ferric Reducing Anti-Dxidant Power Assay and 1,1-diphenyl-2-picryl-hydrazyl (DPPH) - Radical Scavenging Assay were used for the evaluation of antioxidant activity of lemonade samples. Results were expressed as μmol Trolox/mL sample. Estimation of ABTS+ radical scavenging activity was conducted according to the method of Apak et al. (2008). FRAP estimation was conducted according to Benzie & Strain (1996). Antioxidant activity of beverages was measured using a modified version of the Katalinic et al. (2006), Brand-Williams et al. (1995) method that involved the use of the free radical DPPH (2,2-diphenyl-l-picrylhydrazyl), in which antioxidants were allowed to react with the stable radical in a methanol solution. Color values were measured using HunterLab Colour Analyzer (MSEZ4500L; HunterLab, Virginia, USA), and the CIE L*, a* and b* values were determined (Bakker et al. 1986). After initial calibration against standard white and black surface plates, three replicate measurements of the samples were performed.
2.5 Sensory analysis
Sensory evaluation was conducted by a selected and trained panel comprising 15 judges from faculty members and graduate students of Food Engineering Department. The beverages were served at 12-15 °C in tasting glasses and coded. The evaluation was done using 9-point structured scales, 9 being the best and 1 the worst quality (color, odor, appearance, aroma, sweetness, acidity, astringency, mouthfeel and overall impression).
2.6 Statistical analysis
The experiment was conducted in a completely randomized design with three replications. The results were statistically evaluated by one-way analysis of variance (ANDVA) using the JMP software package version 6.0 (SAS Institute Inc. NC, 27513). When significant differences were found (p < 0.05), the Least Significant Difference (LSD) test was used to determine the differences among the means.
3 Results and discussion
Results of the physicochemical analysis of the lemon juice concentrate are given in Table 2.
Uçan et al. (2014) reported that pH, titratable acidity, water soluble dry matter and ascorbic acid values of natural cloudy
Table 1. Lemonade formulation.
Ingredients for 1L lemonade
Lemon juice concentrate 16.52 g
Sucrose 119.89 g
Citric acid 2.088 g
Ascorbic acid 0.522 g
Sodium benzoate 0.115 g
Potassium sorbate 0.2 g
Natural lemon flavor 0.3 mL
Lemon flavored emulsion 1.5 g
lemon juice concentrates stored at 25 °C for 180 days changed between 2.07-2.57; 35.78-37.34 g/100 mL; 44.33-45.22 g/100 g; 1409.53-1682 mg/L, respectively. At the end of the storage period degradation ratio of ascorbic acid reached approximately 16%. The difference between our results may originate from the variety of lemons and the differences in process conditions of evaporation and storage. The L-ascorbic content is subjected to variations depending on variety, ripeness, processing, and storage conditions. According to Association of the Industry of Juices and Nectars of the European Union (2013), the natural L-ascorbic content in direct lemon juice is over 300 mg/L. González-Molina et al. (2009) determined vitamin C content of lemon juice to be approximately 36.14 mg/100 mL. Lemon juice suffers a reduction of the vitamin C content during storage or thermal processing (Abbasi & Niakousari, 2007).
González-Molina et al. (2009) determined pH, titratable acidity, total soluble solids and total phenolic compounds of lemon juice as 2.45 ± 0.0, 5.40 ± 0.23 g/100 mL, 8.22 ± 0.16 g/100 g and 72.41 mg gallic acid/100 mL respectively. Tounsi et al. (2011) reported the phenolic contents of lemon juice as 333 mg GAE/L. Lorente et al. (2014) determined glucose, fructose and sucrose concentrations in lemon juice as 7.9, 7.3 and 4.5 g/L, respectively. Moufida & Marzouk (2003) reported the total sugars of lemon juice as 75.98 g/L. Because our material was lemon juice concentrate, titratable acidity, water soluble solid content, glucose, fructose, saccharose and total phenolic content were determined to be higher than their reports. Lee et al. (2013) determined the total phenolic content of lemon juice concentrate obtained from the Eureka variety lemon as 191.67 ± 41.67 mg GAE/g. These variations in total phenol content could be due to various factors. Dne such factor may be varying genetic potentials of individual species in polyphenol biosynthesis. Environmental conditions could be considered a determinant factor on the bioactive content of the lemon juice (Lee et al., 2013; González-Molina et al., 2009).
The K, Na, Mg and P content of lemon juice concentrate were determined as 7477.26 ± 6.34 mg/kg, 619.42 ± 10.10 mg/kg, 613.71 ± 5.23 mg/kg and 392.64 ± 3.77 mg/kg, respectively. Uçan et al. (2014) determined Ca, Na, Fe, Zn, K and Mg contents of lemon juice concentrate as 847.21 ± 36.3 mg/L, 54.16 ± 10.10 mg/L, 18.55 ± 1.27 mg/L, 1.97 ± 0.19 mg/L, 3460.42 ± 17.21 mg/L, 410.06 ± 6.08 mg/L, respectively. Compared to these results, the K, Na and Mg values of our sample were higher.
The antioxidant activity of lemon juice concentrate was determined as µmol trolox/mL sample by ABTS, FRAP and DPPH assays (Figure 1). Different assays can give a broad range to justify the use of multiple antioxidant tests, comparing the diverse reactivity of samples with each different assay. Results obtained from both ABTS and FRAP assays were close to each other. Lee et al. (2013) determined the antioxidant activity of
lemon juice concentrate. Trolox equivalent antioxidant activity was measured based on the isolated compounds’ ability against ABTS. Also DPPH radical scavenging activity and ferric reducing ability of plasma assays were used. Used sample concentrations were 1 mg/mL. DPPH scavenging activity was 74.10±3.09%; ferric reducing ability, 1039.60 ± 52.00 µmol/L; trolox equivalent antioxidant capacity (TEAC), 395.38 ± 2.18 mg/g according to Lee et al. (2013). Dikeh et al. (2016) reported the FRAP of lemon juice concentrate as 122.75 ± 3.25 μmol/L Fe(II)/g. Due to the differences in methods and concentrations used, the results differ from each other.
The results of water soluble dry matter, titratable acidity, pH, ascorbic acid and total phenolic matter of lemonade samples are given in Table 3 and Table 4. Concerning both water soluble dry matter and titratable acidity values, non-significant differences were observed (p < 0.05). The pH of lemonades involving linden, ginger, mint and heather extracts were higher. However, all of these parameters were within a normal and acceptable range for these beverages.
Ascorbic acid content of lemon juice concentrate was 1107.08 ± 4.43 ppm. Although the lemonades contained 10% of the concentrates, they provided ascorbic acid content between 486.04 ± 0.91 to 597.90 ± 11.33 ppm. These results were caused by the ascorbic acid addition (0.05%) during lemonade production. While the highest ascorbic acid content was determined in lemonade with linden, lemonades containing green tea, mint or lemon verbena had the lowest amount.
To determine sugar composition, the main sugars were analyzed in the samples (Table 3). Glucose content of lemonades changed between 1.11 and 1.62 g/100 mL. There was no significant difference in fructose content among the samples (p < 0.05). Lemonades containing clove and mate extracts had the highest amount of saccharose (11.58 ± 0.01 g/100 mL). The control sample had the lowest saccharose content (11.07 ± 0.03 g/100 mL). Generally the similar amounts of sugars could be related to the
Table 2. The results of the physicochemical analysis of lemon juice concentrate (mean ± standard deviation).
Water soluble dry matter
(g/100 g)
Titratable acidity* (g/100 g)
pH Ascorbic acid
(ppm)
Glucose (g/100 g)
Fructose (g/100 g)
Saccharose (g/100 g)
Total phenolic content (mg GAE**/100 g)
45.4 ± 0.00 15.66 ± 0.00 2.63 ± 0.00 1107.08 ± 4.43 8.24 ± 0.17 7.90 ± 0.11 0.69 ± 0.03 1161.16 ± 14.14 * Citric acid. ** Gallic acid equivalent.
same amount of lemon juice concentrate and sucrose used in the production.
The control sample had the lowest antioxidant activity according to all assays. The usage of herbal extract in lemonade formulation enhanced levels of antioxidant activity (Table 4). Concerning TEACABTS, the lemonade with mint showed the highest activity. There was no significant difference among the lemonades with mint, ginger and linden (p < 0.05). The results of the TEACFRAP values showed that lemonades enriched in linden or ginger extracts had significantly higher antioxidant activity. With respect to the TEACDPPH values, lemonades with linden or mint had the highest of antioxidant activity. Considering ascorbic acid and total phenolic contents, lemonades containing either linden or ginger extracts showed the highest values. Addition of linden or ginger extracts enhanced the antioxidant activity significantly.
The different values obtained from the three assays might be caused by the fact that the test species quenched/reduced by lemonades (i.e., DPPH, ABTS+ and Fe3+) reacted according to different mechanisms and kinetics. In fact, even though these antioxidant ability assays proceed via electron transfer rather than hydrogen atom transfer, they have been found to be influenced by both the pH and the solvent mixtures in which they are carried out (Huang et al., 2005).
The total phenolic content ranged between 315.11 ± 9.10 mg/100 mL (gallic acid in control sample) and 397.57 ± 6.22 (gallic acid in
lemonade with ginger). Addition of herbal extracts caused an increase of total phenolic content of lemonades. This increase varied between 3.72% (lemonade with heather) to 26.17% (lemonade with ginger).
The dilution effect related to lemonade manufacturing from lemon juice concentrate would cause the decrease in mineral content. The highest amount of minerals was determined in lemonades with green tea or lemon verbena extract. Lemonade with mate showed the lowest mineral values (Table 5).
Lorente et al. (2014) reported that the predominant mineral in lemon juice was potassium (1264.2 mg/L), followed by phosphorus (306 mg/L), calcium (112 mg/L) and magnesium (92.6 mg/L). Uçan et al. (2014) determined potassium, magnesium and sodium minerals of lemon juice as 1063.54 ± 57.71 mg/L, 101.21 ± 38.49 mg/L and 8.13 ± 1.96 mg/L, respectively.
The enrichment of lemonades with herbal extracts of high antioxidant capacity can change the color although it can also contribute to its stability against oxidation (Sanchez-Bel et al., 2015).
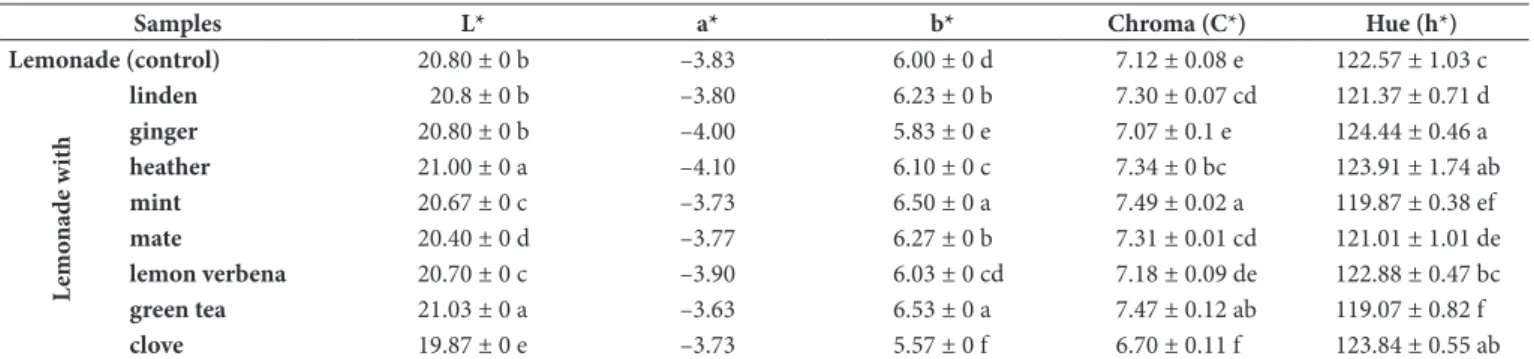
In lemonades, while the addition of heather or green tea extracts significantly increased the L* (lightness) value, the addition of mint, mate or clove significantly decreased it (p < 0.05) (Table 6). There was no significant difference in the a* (redness) value among the samples.
Table 3. The results of physicochemical analysis of lemonade samples* (mean ± standard deviation).
Samples
Water soluble dry matter
(g/100 g)
Titratable acidity**
(g/100 mL)
pH Ascorbic acid
(ppm)
Glucose (g/100 mL)
Fructose (g/100 mL)
Saccharose (g/100 mL)
Lemonade (control) 13.1 ± 0 a 0.51 ± 0 a 3.33 ± 0.02 b 546.70 ± 0.44 b 1.16 ± 0.21 b 0.70 ± 0.01 a 11.07 ± 0.03 c
L
emo
nad
e w
ith
linden 13.1 ± 0 a 0.51 ± 0 a 3.47 ± 0.03 a 597.90 ± 11.33 a 1.57 ± 0.20 a 0.73 ± 0.03 a 11.41 ± 0.03 ab
ginger 13.1 ± 0 a 0.51 ± 0 a 3.48 ± 0.04 a 535.26 ± 6.56 bc 1.35 ± 0.08 ab 0.68 ± 0 a 11.44 ± 0.01 ab
heather 13.1 ± 0 a 0.51 ± 0 a 3.45 ± 0.05 a 525.35 ± 7.96 c 1.35 ± 0.08 ab 0.71 ± 0.01 a 11.22 ± 0.15 bc
mint 13.1 ± 0 a 0.51 ± 0 a 3.47 ± 0.03 a 496.87± 2.57 d 1.48 ± 0.06 ab 0.71 ± 0.04 a 11.41 ± 0.05 ab
mate 13.1 ± 0 a 0.51 ± 0 a 3.35 ± 0.04 b 530.87± 15.01 bc 1.11 ± 0.11 b 0.74 ± 0.05 a 11.58 ± 0.01 a
lemon verbena 13.1 ± 0 a 0.51 ± 0 a 3.34 ± 0.03 b 486.04± 0.91 d 1.62 ± 0.04 a 0.71 ± 0.12 a 11.42 ± 0.12 ab
green tea 13.1 ± 0 a 0.51 ± 0 a 3.39 ± 0.04 b 496.97 ± 6.47 d 1.15 ± 0.23 b 0.72 ± 0.03 a 11.09 ± 0.13 c
clove 13.1 ± 0 a 0.51 ± 0 a 3.38 ± 0.02 b 519.22 ± 3.51 c 1.15 ± 0.25 b 0.70 ± 0.01 a 11.58 ± 0.02 a * Different letters means significantly different at p < 0.05 according to the LSD test. ** Citric acid
Table 4. Antioxidant activity and total phenolic content of lemonade samples*.
Samples ABTS
(µmol Trolox/mL sample)
FRAP
(µmol Trolox/mL sample)
DPPH
(µmol Trolox/mL sample)
Total phenolic content (mg GAE**/100 mL)
Lemonade (control) 19.91 ± 0.29 f 17.13 ± 0.33 g 14.88 ± 0.38 e 315.11 ± 9.10 g
L
emo
nad
e w
ith
linden 24.92 ± 0.14 a 26.79 ± 0.23 a 17.72 ± 0.55 a 389.48 ± 3.21 ab
ginger 24.94 ± 0.14 a 26.06 ± 0.23 ab 17.01 ± 0.61 ab 397.57 ± 6.22 a
heather 20.54 ± 0.49 e 18.59 ± 0.40 f 15.54 ± 0.46 de 326.83 ± 3.05 f
mint 25.38 ± 0.18 a 25.46 ± 0.14 bc 17.36 ± 0.63 a 383.42 ± 6.42 b
mate 22.38 ± 0.15 c 23.25 ± 0.47 d 16.45 ± 0.46 bc 371.70 ± 7.31 c
lemon verbena 22.26 ± 0.15 c 20.80 ± 1.86 e 15.89 ± 0.55 cd 346.23 ± 5.05 e
green tea 21.15 ± 0.49 d 19.65 ± 0.41 ef 15.99 ± 0.26 cd 343.40 ± 7.95 e
clove 22.89 ± 0.21 b 24.85 ± 0.33 c 16.91 ± 0.61 ab 359.17 ± 7.95 d
However, the addition of linden, heather, mint, mate, lemon verbena or green tea extracts significantly increased (p < 0.05) the yellowness (CIE b* value).
Chroma (C*) considered as the quantitative indicator of colorfulness, is used to determine the degree of difference in a hue in comparison to a grey color with the same lightness. The higher the chroma values, the higher color intensity of samples is perceived by humans. Except for lemonade with clove, chroma values in all lemonades with additions were higher than for the control sample. Hue angle (h*), considered the qualitative indicator of color, is an attribute according to which colors have been traditionally defined as reddish, greenish, etc., and is used to define the difference of a certain color with the reference to grey color of the same lightness. This attribute is related to the differences in absorbance at different wavelengths. A higher
hue angle represents a lesser yellow character in the assays. An angle of 0° or 360° represents red hue, whilst angles of 90°, 180° and 270° represent yellow, green and blue hues, respectively (Pathare et al., 2013). When the addition of ginger, heather, lemon verbena or clove extracts increased the hue value, the addition of linden, mint, mate or green tea extracts decreased it.
3.1 Sensory analyses
The sensory assessment is the main aspect for designing new foods because changes in aroma, texture or color of the original matrices can significantly affect the consumer’s acceptance (Sanchez-Bel et al., 2015). The evaluation was done using 9-point structured scale, with 9 being the best and 1 the worst quality.
Results of sensory analysis of lemonade samples are given in Table 7.
Table 5. Mineral content of lemonade samples* (mg/kg).
Samples K Na Mg P
Lemonade (control) 193.64 ± 0.28 cde 37.09 ± 0.04 bc 25.09 ± 0.16 bc 8.52 ± 0.75 b
L
emo
nad
e w
ith
linden 201.92 ± 0.26 bc 36.30 ± 0.47 c 24.77 ± 0.19 c 8.87 ± 0.37 ab
ginger 185.69 ± 2.04 ef 34.74 ± 0.03 d 23.90 ± 0.47 d 8.50 ± 0.47 b
heather 199.70 ± 6.80 bcd 37.24 ± 0.80 bc 25.56 ± 1.18 bc 8.87 ± 0.59 ab
mint 203.06 ± 7.23 ab 37.57 ± 1.08 bc 25.25 ± 0.71 bc 9.36 ± 0.42 ab
mate 178.83 ± 3.03 f 33.75 ± 0.89 d 22.37 ± 0.11 d 7.22 ± 0.37 c
lemon verbena 208.61 ± 0.25 ab 39.13 ± 0.71 a 26.74 ± 0.37 ab 9.08 ± 0.68 ab
green tea 210.98 ± 4.84 a 38.59 ± 0.86 ab 27.86 ± 0.63 a 10.04 ± 0.59 a
clove 192.25 ± 2.25 de 37.11 ± 0.03 bc 24.68 ± 0.33 bc 8.68 ± 0.32 b
* Different letters means significantly different at p < 0.05 according to the LSD test.
Table 6. Color values of lemonade samples**.
Samples L* a* b* Chroma (C*) Hue (h*)
Lemonade (control) 20.80 ± 0 b –3.83 6.00 ± 0 d 7.12 ± 0.08 e 122.57 ± 1.03 c
L
emo
nad
e w
ith
linden 20.8 ± 0 b –3.80 6.23 ± 0 b 7.30 ± 0.07 cd 121.37 ± 0.71 d
ginger 20.80 ± 0 b –4.00 5.83 ± 0 e 7.07 ± 0.1 e 124.44 ± 0.46 a
heather 21.00 ± 0 a –4.10 6.10 ± 0 c 7.34 ± 0 bc 123.91 ± 1.74 ab
mint 20.67 ± 0 c –3.73 6.50 ± 0 a 7.49 ± 0.02 a 119.87 ± 0.38 ef
mate 20.40 ± 0 d –3.77 6.27 ± 0 b 7.31 ± 0.01 cd 121.01 ± 1.01 de
lemon verbena 20.70 ± 0 c –3.90 6.03 ± 0 cd 7.18 ± 0.09 de 122.88 ± 0.47 bc
green tea 21.03 ± 0 a –3.63 6.53 ± 0 a 7.47 ± 0.12 ab 119.07 ± 0.82 f
clove 19.87 ± 0 e –3.73 5.57 ± 0 f 6.70 ± 0.11 f 123.84 ± 0.55 ab
** Different letters means significantly different at p < 0.05 according to the LSD test.
Table 7. Results of sensory analysis of lemonade samples*.
Samples Appearance Color Odor Aroma Sweetness Acidity Astringency Mouthfeel Overall
Impression
Lemonade(control) 8.15 a 8.08 a 7.77 a 7.85 a 6.62 a 6.85 a 7.54 a 7.15 a 7.54 a
L
emo
nad
e w
ith
linden 7.39 ab 7.31 a 7.46 ab 6.62 ab 7.00 a 6.77 a 7.62 a 7.39 a 7.15 a
ginger 7.62 ab 7.31 a 7.54 ab 7.31 ab 7.15 a 7.46 a 7.62 a 7.62 a 7.54 a
heather 8.00 ab 8.23 a 7.23 ab 6.85 ab 7.23 a 7.15 a 7.23 ab 7.31 a 7.54 a
mint 7.62 ab 7.69 a 7.62 ab 7.54 a 7.23 a 7.08 a 7.30 ab 7.62 a 7.39 a
mate 7.62 ab 7.46 a 6.77 ab 6.69 ab 6.54 a 6.46 a 6.46 b 7.00 a 6.92 a
lemon verbena 7.23 b 7.77 a 6.54 b 6.15 b 6.85 a 7.08 a 7.15 ab 7.00 a 7.15 a
green tea 7.54 ab 7.62 a 7.23 ab 7.23 ab 7.15 a 6.85 a 7.39 ab 7.23 a 7.15 a
clove 7.54 ab 7.54 a 6.85 ab 7.23 ab 6.92 a 6.85 a 7.15 ab 7.62 a 7.39 a
In the regards to appearance, the control sample received the highest score, followed by lemonade with heather. There was no significant difference in the color, sweetness, acidity, mouthfeel and overall impression of all the samples (p < 0.05). While the control sample scored the highest, lemonade with lemon verbena scored the lowest in terms of odor. The control sample and lemonade with mint were the most palatable in terms of aroma. Although there was no significant difference in the sweetness of the lemonade samples, lemonade with heather or mint scored the highest. Lemonade with mate was the least preferred in terms of sweetness. Yerba mate infusions had a bitter taste and astringency sensation that elicited negative consumer reactions when taken at high intensities (Jaeger et al., 2009; Lesschaeve & Noble, 2005; Drjuela-Palacio et al., 2014). Lemonade with linden or ginger and the control sample were the most attractive in terms of astringency. There was no significant difference in the overall impression of the lemonades (p < 0.05). Generally, the most preferred ones were the control sample and lemonade with heather or ginger. Lemonade with yerba mate was the least preferred sample.
4 Conclusion
The lemonade beverages with the addition of herbal extracts of high antioxidant activity were well accepted. The addition even improved the acceptance of the product, the content in phenolic compounds and the antioxidant activity. Linden-, ginger- or peppermint-added lemonades, which have been found to be rich in total phenolic compounds and ascorbic acid, showed higher antioxidant activity than the control sample. In terms of overall impression, the most preferred beverages were heather-or ginger-added lemonades and the control sample. Mate added lemonade was the least preferred. In order to determine beverage stability, samples were stored for one year and cloudy appearance was determined in lemonades including herbal extracts. Herbal teas are generally consumed in winter as a hot beverage. The addition of herbal extracts to lemonade allows the production of cold beverages of high nutritional value, which are preferred by consumers for their sensory properties. It also helps to serve these products for consumption across all seasons.
Acknowledgements
The authors would like to thank The Commission of Scientific Research Projects of Uludag University for their financial support (Project No: KUAP(Z) - 2013/13).
References
Abbasi, A., & Niakousari, M. (2007). Kinetics of ascorbic acid degradation in un-pasteurized iranian lemon juice and concentrate during regular storage conditions. Electronic Journal of Environmental, Agricultural
and Food Chemistry, 6, 1735-1741.
Apak, R., Guclu, K., Dzyurek, M., & Celik, S. E. (2008). Mechanism of antioxidant capacity assays and the CUPRAC (cupric ion reducing antioxidant capacity) assay. Mikrochimica Acta, 160(4), 413-419. http://dx.doi.org/10.1007/s00604-007-0777-0.
Association of Dfficial Analytical Chemists – ADAC. (2000). AOAC
Official Method 979.23: Saccharides (cap. 44, pp. 43). Arlington: ADAC.
Association of the Industry of Juices and Nectars of the European Union – AIJN. (2013). Code of practice for evaluation of fruit and
vegetable juices 6.6. Reference guideline for lemon juice. Brussels:
AIJN. Revised February 2013.
Bakker, J., Pridle, P., & Timberlake, C. F. (1986). Tristimulus measurements (CIELAB 76) of portwine colour. Vitis, 25, 67-78.
Benzie, I. F. F., & Strain, J. J. (1996). The Ferric Reducing Ability of Plasma (FRAP) as a measure of “antioxidant power”: FRAP assay.
Analytical Biochemistry, 239(1), 70-76. http://dx.doi.org/10.1006/
abio.1996.0292. PMid:8660627.
Brand-Williams, W., Cuvelier, M. E., & Berset, C. (1995). Use of free radical method to evaluate antioxidant activity.
Lebensmittel-Wissenschaft & Technologie, 28(1), 25-30. http://dx.doi.org/10.1016/
S0023-6438(95)80008-5.
Cemeroğlu, B. S. (2007). Gıda analizleri (Gıda Teknolojisi Derneği). Ankara: Bizim Büro Basımevi. 535 p. In Turkish.
Gironés-Vilaplana, A., Valentão, P., Andrade, P. B., Ferreres, F., Moreno, D. A., & García-Viguera, C. (2012). Phytochemical profile of a blend of black chokeberry and lemon juice with cholinesterase inhibitory effect and antioxidant potential. Food Chemistry, 134(4), 2090-2096. http://dx.doi.org/10.1016/j.foodchem.2012.04.010. PMid:23442660. Gironés-Vilaplana, A., Valentão, P., Andrade, P. B., Ferreres, F.,
Moreno, D. A., & García-Viguera, C. (2015). Beverages of lemon juice and exotic noni and papaya with potential for anticholinergic effects. Food Chemistry, 170, 16-21. http://dx.doi.org/10.1016/j. foodchem.2014.08.021. PMid:25306312.
González-Molina, E., Domínguez-Perles, R., Moreno, D. A., & García-Viguera, C. (2010). Natural Bioactive Compounds of Citrus Lemon for Food and Health. Journal of Pharmaceutical and Biomedical
Analysis, 51(2), 327-345. http://dx.doi.org/10.1016/j.jpba.2009.07.027.
PMid:19748198.
González-Molina, E., Moreno, D. A., & Garcia-Viguera, C. (2008). Genotype and harvest time influence the phytochemical quality of fino lemon juice (Citrus lemon L. Burm. f.) for industrial use. Journal
of Agricultural and Food Chemistry, 56(5), 1669-1675. http://dx.doi.
org/10.1021/jf073282w. PMid:18254590.
González-Molina, E., Moreno, D. A., & García-Viguera, C. (2009). A new drink rich in healthy bioactives combining lemon and pomegranate juices. Food Chemistry, 115(4), 1364-1372. http:// dx.doi.org/10.1016/j.foodchem.2009.01.056.
Hışıl, Y. (2008). Enstrümental gida analizleri (5th ed., Ders Kitapları
Yayın, No. 48). Bornova: Ege Üniversitesi Mühendislik Fakültesi.
In Turkish.
Huang, D., Du, B., & Prior, R. L. (2005). The chemistry behind antioxidant capacity assays. Journal of Agricultural and Food Chemistry, 53(6), 1841-1856. http://dx.doi.org/10.1021/jf030723c. PMid:15769103. Jaeger, S. R., Axten, L. G., Wohlers, M. W., & Sun-Waterhouse, D.
(2009). Polyphenol-rich beverages: Insights from sensory and consumer science. Journal of the Science of Food and Agriculture, 89(14), 2356-2363. http://dx.doi.org/10.1002/jsfa.3721.
Katalinic, V., Milos, M., Kulisic, T., & Jukic, M. (2006). Screening of 70 medicinal plant extracts for antioxidant capacity and total phenols. Food Chemistry, 94(4), 550-557. http://dx.doi.org/10.1016/j. foodchem.2004.12.004.
Lee, S. C., Chang, W. J., Lu, K. T., Lo, D., & Wu, M. C. (2013). Antioxidant capacity and Hepatoprotective effect on ethanol-injured liver cell of lemon juice concentrates and its comparison with commercial Japanese apricot juice concentrates. Research Journal of Pharmaceutical
Drjuela-Palacio, J. M., Zamora, M. C., & Lanari, M. C. (2014). Consumers’ acceptance of a high-polyphenol yerba mate/black currant beverage: Effect of repeated tasting. Food Research International, 57, 26-33. http://dx.doi.org/10.1016/j.foodres.2014.01.017.
Pathare, P. B., Dpara, U. L., & Al-Said, F. A. (2013). Colour measurement and analysis in fresh and processed foods: a review. Food and
Bioprocess Technology, 6(1), 36-60. http://dx.doi.org/10.1007/
s11947-012-0867-9.
Sanchez-Bel, P., Romojaro, A., Egea, I., & Pretel, M. P. (2015). Wild edible plants as potential antioxidant or nutritional supplements for beverages minimally processed. LWT - Food Science and Technology, 62(1), 830-837. http://dx.doi.org/10.1016/j.lwt.2014.06.017. Sharma, S. K., Yadav, V. K., Rao, V. K., & Dixit, A. K. (2014). Enhancement
of health-promoting properties while substituting exogenous citric acid by seabuckthorn (Hippophae salicifolia) pulp in preparation of sweet orange (Citrus sinensis) ready-to-serve beverage (2014).
Journal of Food Processing and Preservation, 38(4), 1427-1438. http://
dx.doi.org/10.1111/jfpp.12102.
Spanos, G. A., & Wrolstad, R. E. (1990). Influence of processing and storage on the phenolic composition of thompson seedless grape juice. Journal of Agricultural and Food Chemistry, 38(3), 817-824. http://dx.doi.org/10.1021/jf00093a049.
Tounsi, M. S., Wannes, W. A., Duerghemmi, I., Jegham, S., Njima, Y. B., Hamdaoui, G., Zemni, H., & Marzouk, B. (2011). Juice components and antioxidant capacity of four Tunisian Citrus varieties. Journal
of the Science of Food and Agriculture, 91(1), 142-151. http://dx.doi.
org/10.1002/jsfa.4164. PMid:20862741.
Uçan, F., Ağçam, E., & Akyıldız, A. (2014). Doğal Bulanık Limon Suyu Üretimi Üzerine Bir Araştırma. Gıda, 39(1), 25-32.
Lesschaeve, I., & Noble, A. C. (2005). Polyphenols: Factors influencing their sensory properties and their effects on food and beverage preference. The American Journal of Clinical Nutrition, 81(1, Suppl), 330-335. PMid:15640499.
Lorente, J., Vegara, S., Martí, N., Ibarz, A., Coll, L., Hernández, J., Valero, M., & Saura, D. (2014). Chemical Guide Parameters for Spanish Lemon (Citrus limon (L.) Burm.) Juices. Food Chemistry, 162, 186-191. http://dx.doi.org/10.1016/j.foodchem.2014.04.042. PMid:24874375.
Moufida, S., & Marzouk, B. (2003). Biochemical characterization of blood orange, sweet orange, lemon, bergamot and bitter orange.
Phytochemistry, 62(8), 1283-1289.
http://dx.doi.org/10.1016/S0031-9422(02)00631-3. PMid:12648552.
Mulero, J., Bernabe, J., Cerda, B., García-Viguera, C., Moreno, D. A., Albaladejo, M. D., Avilés, F., Parra, S., Abellán, J., & Zafrilla, P. (2012). Variations on cardiovascular risk factors in metabolic syndrome after consume of a citrus-based juice. Clinical Nutrition, 31(3), 372-377. http://dx.doi.org/10.1016/j.clnu.2011.11.014. PMid:22197455. Nordic Committee on Food Analysis – NMKL. (2007). Trace elements - As, Cd, Hg, Pb and other elements: determination by ICP-MS after
pressure digestion. Dslo: NMKL. NMKL 186. Retrieved from http://
www.nmkl.org/index.php/en/webshop/item/tungmetaller-as-cd- hg-og-pb-bestemmelse-med-icp-ms-etter-syreoppslutning-under-trykk-nmkl-186-2007