C
açador, Santa Catarina State, Brazil, is the largest tomato producer in this State, with a cultivated area between 650 and 750 ha and average yield of 58,000 kg ha-1 (Epagri/Cepa, 2007).With an altitude of 940 m, the climate is temperate constant humid with mild summer, and corresponds to the type Cfb of the Köepen classification (Pandolfo et al., 2002). This environment condition is conducive to the development of late
blight caused by Phytophthora infestans (Vale et al., 2000).
Due to the rapid spread of this pathogen and the severe losses that the disease causes, the most widely used procedure in the region is still chemical control with two or three applications per week, respectively, by 76% and 10% of the farmers (Scolaro, 2004), where 25 or more sprayings are made per season. Similar condition occurs among farmers
in other regions of tomato production in Brazil (Costa et al., 1995).
Under these conditions, the use of resistant varieties would be preferred as a strategy for managing and reducing sprayings for the late blight management. However, for the tomato producer, despite the large number of cultivars available, no one in market presents resistance to late blight (Rick, 1988).
Another possibility of management
the integrated production of tomato in Caçador, Brazil. Horticultura Brasileira 29: 520-525.
Viability of a prediction system for tomato late blight in the integrated
production of tomato in Caçador, Brazil
Walter F Becker1; Siegfried Mueller1; Janaína P dos Santos1; Anderson Fernando Wamser1; Atsuo
Suzuki1; Leandro Luiz Marcuzzo2
EPAGRI-EE de Caçador, C. Postal 591, 89500-000 Caçador-SC; [email protected]; [email protected]; janapereira@
epagri.sc.gov.br; [email protected]; [email protected]; 2Universidade do Contestado, R Itororó, 800, 89500-000
Caçador-SC; [email protected]
ABSTRACT
An alert system for tomato late blight was validated in an Integrated Production System (IP) in the 2006-2007 and 2007-2008 season in Caçador, Santa Catarina State, Brazil. The late blight is a destructive disease and demands 25 or more fungicide sprayings per season in a Conventional Production (CP) System. For the CP area, the chemical control was according to the growers’ production systems and consisted of weekly sprays soon after planting. For the
IP area, the criterion for the first fungicide spray was according to
Machardy (1972) and for subsequent ones according to Wallin (1962), when the disease severity values (DSV) reached eight points. There was a decrease on the fungicide application in the IP, not only in the number of fungicide sprays (23-28%) but also in the amount of active
ingredient (34.5-60.9%). Fungicides classified as highly toxic (class I) were not used in IP. There were no significant differences among
the use of alert system on IP and the weekly schedules on CP with
regard to final disease severity in the 2006-2007 season, but it was significantly lower in the second trial on plants for IP area. The IP system significantly increased tomato yield (7.6-25.5%) compared
with CP system and reduced fungicide cost up to US$539/ha. The use of alert system could be a valuable and affordable tool in managing tomato late blight in Integrated Production of tomatoes in Caçador.
Keywords: Solanum lycopersicum, Lycopersicon esculentum,
Phytophthora infestans, integrated pest management, IPM.
RESUMO
Viabilidade de sistema de alerta para a requeima em produção integrada de tomate de mesa em Caçador
O presente trabalho teve como objetivo avaliar um sistema de alerta para a requeima do tomateiro (Phytophthora infestans) sob cultivo em Produção Integrada (PI) de tomate de mesa comparati-vamente à Produção Convencional (PC). A requeima é uma doença destrutiva e anualmente demanda 25 ou mais pulverizações com fungicidas para seu controle na Produção Convencional (PC). O
experimento foi instalado em 2006-2007 e 2007-2008, em Caçador
(SC) com as cultivares Alambra e Paronset, respectivamente. Na área da PC o controle químico da requeima foi semanal e iniciado logo após o transplante conforme a prática corrente na região. Na área da PI, o critério para a primeira pulverização foi o de Machardy (1972) e as subseqüentes, conforme Wallin (1962) quando o valor de severidade da doença (VSD) atingiu oito pontos. Nos dois ciclos, houve um decréscimo na aplicação de fungicidas, não somente no número de aplicação (23%-28%) como na quantidade de ingrediente
ativo (34,5-60,9%). Os fungicidas da classe toxicológica I não foram usados na PI. A severidade da doença foi avaliada com auxílio de
escala diagramática e chave descritiva. Não houve diferença
signi-ficativa na severidade final da doença com o sistema de alerta na PI e a aplicação semanal na PC no primeiro experimento, porém no segundo experimento a severidade foi significativamente menor na PI. A produção de frutos comerciais foi significativamente maior na
PI (7,6-25,5%) comparada à PC e à redução de custo em fungicida superior a R$ 960,00/ha. O uso do sistema de alerta mostrou ser uma valiosa ferramenta no manejo da requeima em sistema de produção integrada de tomate de mesa.
Palavras-chave: Solanum lycopersicum, Lycopersicon esculentum,
Phytophthora infestans, manejo integrado de pragas.
is viewed through the Integrated Production System (IP), which combines traditional methods that are adapted and adjusted to fit the crops with a range of new technologies, products and services in order to reduce the use of agrochemicals, minimize production losses, reduce the environmental impact and the energy consumption in order to maintain the producing unit economically viable and socially benefic (Protas, 2006).
Different production systems of tomato have been evaluated in order to make treatments more efficient. There are differences regarding the conduction of various crops, in reducing the costs involved in chemical control of pests and diseases (Wamser et al., 2008). The advantages of the vertical tutoring system can be exploited in an integrated production system in the management of late blight.
The use of systems of alert and prediction of tomato diseases enables the decision-making in chemical management of the disease, providing a reduction in the number of sprayings, in the amount of pesticide residues in fresh and processed fruits, and in production costs (Precheur et al., 1992; Andrade, 1997; Vale, 2000). According to Becker (2005), with the use of an alert system, it was possible to delay the beginning of the first spraying on tomato in two to four weeks in comparison to the fixed schedule spraying method. In tomato production for fresh market, the late blight control with a forecasting system was similar to the control obtained with fixed schedule (Costa et al., 2005), whereas in the production of tomato for industry, reduction in the utilization of systemic fungicides was achieved with the use of a prediction system (Duarte et al., 2007).
In Brazil, although widely studied, the tomato crop suffers from a lack of studies in integrated production strategies for disease control with the help of early alert systems. In Portugal, Godinho et al. (2003) indicated the potential of the Tom-cast model to monitor late blight in integrated production of tomato for industry.
This study aimed to adapt the use of an alert system in the integrated
production as indicative for the spraying in the management of late blight, compared with the fixed calendar system used in conventional production by the tomato producers of the region of Vale do Rio do Peixe (AVRP), with reference in the town of Caçador, Santa Catarina State, Brazil.
MATERIAL AND METHODS
The management of the late blight caused by Phytophthora infestans was evaluated in the integrated production system (IP) through an alert model and in the conventional system (CP) through a calendar model (one or more weekly applications) in two experiments carried out in the Epagri-Experimental Station of Caçador, in Caçador town, Santa Catarina State, at 952 m of altitude during the seasons of 2006-2007 and 2007-2008.
In each season, the experimental area was chosen for the position of the land toward the north and a soil covering was made with oat, seeded in May, with 60 kg ha-1 of seeds. This area
was divided in two plots of 408 m2 to
the conduction of tomato in the IP and CP systems, 50 m from each other. The cultivars Alambra and Paronset were used, the planting being realized in 10th
November 2006 (season 2006-2007) and 20th November 2007 (season
2007-2008), respectively. In the IP system, no tillage was adopted, the grooves being dug over the oat straw, without herbicide application.
The basic fertilization was 970 kg ha-1 of triple superphosphate, 30
kg ha-1 of borax and 25 m3 of litter of
broiler. The topdressing was 1320 kg ha-1 of ammonium nitrate and 675 kg
ha-1 of potassium chloride, both carried
out according to the soil analysis and recommendation of the Comissão de Química e Fertilidade do Solo – RS/ SC (Sociedade Brasileira de Ciência do Solo, 2004). The spacing of 1,5 x 0,6 m was adopted with one plant per pit and two stems per plant vertically tutored with plastic ribbon. The planting lines were arranged toward the east-west direction and the drip irrigation was used.
In the CP plot, the farmer regular
method was adopted. The land was tilled through one plowing and two harrowing. The basic fertilization and the topdressing was 50% higher than the IP and no organic fertilization was applied. Spacing, number of plants per pit and number of stems per plant were the same of the IP system, the plant tutoring being carried out with bamboo positioned as an inverted letter V. The planting lines were arranged toward the north-south direction and drip-irrigated.
F r o m t h e m o m e n t o f t h e transplantation on, the climatic variables were registered (temperature, relative air humidity, and leaf wetting) through one appropriate equipment (G. Lufft mod. 8341R3) placed into an official meteorological house with 1.5 m from the soil and a pluviometer.
The late blight management in the IP system comprised, besides of the arrangement of the rows toward east-west and vertical tutoring, the daily monitoring of the late blight (BC) conditions, estimated from the lowest temperature of the day ≥7.2oC; average temperature of 5 days ≤25.5oC and
accumulated precipitation of 10 days, ≥30mm (Machardy, 1979) modified by Becker (2005). In this method, the first spraying was carried out after the occurrence of 10 consecutive days favorable to the disease. The subsequent sprayings were carried out with the model of Wallin (1962), but the variable period of leaf wetting (PLW) was considered in substitution of the air relative humidity (≥90%) and the average temperature of this PLW replaced the average daily temperature of the interpretation of the daily disease severity values (DSV) of the table of Wallin (1962). When the DSV values accumulated the value 8 (8 DSV), alert level, the spraying was carried out and a new counting of DSV was initiated. For the spraying, a motorized backpack sprayer was utilized, brand Maruyama, with pen of three nozzles model Yamaho HV-3, in high volume, with one or more fungicides (Table 3) in tank mixture according to the current practice.
transplantation day on with tank mixture of one or more fungicides according to the farmer criterion.
To the evaluation of the marketable fruit production, 400 useful plants were considered from a total of 500 plants of the IP and CP area. The two areas were divided in 10 rows and the eight central rows were considered useful, with 50 plants each. The production of each row was separated in marketable fruits (mass equal to or higher than 100 g). The evaluation of the severity of late blight was realized with the descriptive key of James (1971), in the 16th week after the
transplantation (WAT) and 19th WAT in
2006-07 and 2007-08, respectively, in 40 plants previously marked in each plot.
The data of fruit production and late blight severity of the plots IP and CP were submitted to the T test at 1%.
RESULTS AND DISCUSSION
In the 2006-2007 season, in eighteen weeks after transplantation (WAT), 77 days with environmental conditions
favorable to late blight (BC) were registered, mainly between the 7th and
11th weeks. Only in the 1st, 13th, 14th and
18th WAT no favorable condition was
registered.
In the CP plot, the first spraying was on November 14th, four days after
transplantation, followed by weekly applications that resulted in 25 sprays during the season (Table 1).
In the IP plot, the first effective spraying was carried out on November 28th, 18 days after transplantation, when
the alert system indicated a period of 10 consecutive days favorable to late blight. This ability to delay the beginning of the first spraying confirmed the observation of Becker (2005), which observes that in the first weeks after transplantation, the climatic variables that determine the occurrence of the first spraying do not always meet the criteria established by Machardy model (condition of late blight). The subsequent sprayings for this disease were determined by the daily occurrence of DSV values (DSV = 8). As a result, a total of 18 sprayings were carried out, corresponding to a total reduction of 28% compared to CP.
Duarte et al. (2007), achieved o n l y i n t e r m e d i a t e c o n t r o l w i t h alert set to DSV=8. Possibly other factors associated with the integrated management and applied in IP, such as the vertical tutoring system and the east-west solar orientation provided ventilation and solar incidence between rows with a reduction of leaf wetness (Santos et al., 1999; Becker, 2005; Wanser et al., 2008). On the other hand, conduction systems in inverted “V”, such as the one used in CP, can result in greater disease severity due to the establishment of a moist environment conducive to plant pathogens or due to a deficient spraying (Rebelo, 1993; Wanser et al., 2008). Despite the condition for late blight (BC) present in most of the season (Table 1), the level of severity of late blight was low in both areas of IP and CP and the disease was controlled by the sprayings. There was no significant difference (T-test) regarding to the level of disease severity between the two areas (Table 2).
The greatest volume of fungicides was applied in the CP area, with consumption of 110.96 kg i.a ha-1 from
14 active ingredients (i.a) with highest frequency of application of copper oxychloride (22.5%). In the IP, 43.32 kg ha-1 of fungicides was consumed
and 12 active ingredients (Table 2 and 3) with highest frequency of application of copper hydroxide (19.4%).
In the IP area, besides the lower quantity of fungicides (60.9%), a better distribution of different types of active ingredients was done during the crop season. In this area, active ingredients of the class I were not applied; 4.335 kg ha-1 of the class II; 33.166 kg ha-1 of the
class III and 5.816 kg ha-1 of the class
IV were applied.
On the other hand, in the CP area, 3.540 kg ha-1 of the class I; 2.040 kg
ha-1 of the class II; 52.750 kg ha-1 of the
class III and 52.640 kg ha-1 of the class
IV were applied. This increased amount of product and frequency of application reflected what is normally found in the local farms (Scolaro, 2004). On these farms, the control of late blight is based on a fixed schedule, regardless of the occurrence of environmental conditions for the disease (Table 3). Considering Table 1. Days with environmental conditions favorable to late blight (Phytophthora infestans),
and number of sprays in the integrated (IP) and conventional (CP) production systems of tomato during the seasons 2006-2007 and 2007-2008 (número de dias com condição ambiente favorável à requeima (Phytophthora infestans) e frequência das pulverizações na produção integrada (PI) e convencional (PC) de tomate durante os ciclos 2006-2007 e 2007-2008). Caçador, Epagri, 2008.
2006-2007
WAT1 1 2 3 4 5 6 7 8 9 10 11 12 13 14 15 16 17 18
BC2 0 6 7 4 1 3 7 7 7 7 7 3 0 0 4 7 7 0
No sprays
IP3 0 0 1 1 1 1 1 1 1 1 2 1 2 1 1 1 1 1
CP4 1 1 1 2 2 1 1 1 2 2 2 2 1 1 1 2 1 1
2007-2008
WAT1 1 2 3 4 5 6 7 8 9 10 11 12 13 14 15 16 17 18 19
BC2 0 0 6 6 2 1 7 3 6 6 0 2 7 6 0 0 0 5 6
No sprays
IP3 0 0 1 2 1 1 1 1 2 1 1 1 1 2 1 1 1 2 0
CP4 1 1 1 1 2 1 1 1 2 2 2 1 2 2 1 1 1 2 1
1WAT= weeks after transplantation.2BC= late blight-favorable days; 3IP= integrated
production; first spray according to the Machardy’s method and the subsequent ones when
the severity values were equal to eight (8DSV); 4CP= conventional production; sprays
made according to the calendar (1SAT= semanas após o transplante plantio das mudas.2CR=
condição de requeima; dias na semana com condição favorável à requeima; 3PI= produção
integrada; primeira pulverização determinada pelo método Machardy e as subseqüentes
pelo valor de severidade igual a oito (8VSD); 4PC= produção convencional; pulverização
only the cost of the fungicide, we observed a 52% reduction in the IP. The production of marketable fruits of the cultivar Alambra was 7.6% higher in IP with 79,782.47 kg ha-1, whereas the
conventional area produced 74,081.76 kg ha-1 (Table 2). In the quantity of
disposable fruits, which comprises small fruits, sick fruits or fruits with other defects, no significant difference between the two production systems was observed (data not shown).
In the 2007-2008 season in the 19th
WAT 63 days favorable to the late blight (BC) occurred, mainly among the 3rd,
4th, 7th, 9th, 10th, 13th, 14th, 18th and 19th
week. In the period corresponding to the 1st, 2nd, 11th
, 15
th, 16th and 17th week,
no favorable condition for the disease occurred (Table 1).
In the CP area, the first spraying was carried out on November 21st, one
day after the transplantation. In the 5th, 9th, 10th, 11th, 13th and 14th WAT,
two sprayings were carried out and in the other WAT, only one, totalizing 26 applications (Tables 1 and 2). Among the sprayings, six comprised systemic products, such as benalaxyl+mancozeb, m e t a x y l + m a n c o z e b , p y r a c l o s t r o b i n + m e t i r a m , m e t a l a x y l + c h l o r o t h a l o n i l , dimethomorph+mancozeb. Duarte et al. (2007) reported that the application of only systemic fungicide, according to the forecasting system, may not be
effective in controlling late blight even with lower DSV, which supports the option in this work by the application of systemic+contact and rotation of active ingredients.
In the area of IP, the first specific spraying was carried out on December 14th, 24 days after transplanting, when
the alert system indicated the critical period of 10 consecutive days favorable. Specific sprayings subsequent to this date were carried out according to the occurrence of daily severity values. The alert value (DSV=8) was hit 13 times during the season. In the weeks which no condition of blight occurred (BC = 0), a copper-based product was applied, in the IP, aiming the control of bacterial diseases. Therefore, 12 specific sprayings for late blight were carried out from a total of 20 applications of pesticides (Tables 1 and 2) corresponding to a reduction of 23% compared to the CP. Although the occurrence of favorable BC days of the 19th week, in the last week of the season
no spraying was carried out, because this procedure is actually adopted in the IP.
Although in CP a greater quantity of cupric fungicides was applied (28.28 kg ha-1), a better control of late blight was
not observed in comparison to IP, in which a lower quantity of the referred pesticide was applied (10.85 kg ha-1)
(Table 3).
Towards the toxicological class of
the fungicides in IP, the most used were from the class III (23.09 kg ha-1) and IV
(17.1 kg ha-1, including the biological
ingredients), only one application of the class II being carried out (0.75 kg ha-1). In CP, 1.63 kg ha-1 of the class
I; 9.25 kg ha-1 of the class II; 20.15 kg
ha-1 of the class III and 31.48 kg ha-1 of
the class IV were applied (Table 3). In the control of this disease in tomato for industry, the reduction of applications and the improvement of the fungicide management were possible (Duarte et al., 2007) with the use of a forecasting system.
In CP 16 active ingredients were used, totaling 62.51 kg ha-1 with higher
frequency of application of copper oxychloride (32.5%), whereas in the IP for the same number of active ingredients, were applied a total of 40.95 kg ha-1 and higher frequency of spraying Bordeaux mixture and acibenzolar-s-methyl (12.5%). In IP, we include two products with biological formulation with Trichoderma spp (Agrotrich®) and a complex formed by Lactobacillus plantarum, Bacillus subtillus and Streptococcus faecium (Compost-Aid
®) applied at transplanting, to the stem
of each plant with a backpack sprayer. Besides the lower quantity of product (34.5%) a better distribution and rotation of active ingredients during the crop season was possible. Considering only the cost of the fungicide in the 2007-2008 season, this was 27.4% lower in IP compared to CP.
The harvest of marketable fruits of the cultivar Paronset was 119,066.4 kg ha-1 in the area of IP, an amount significantly higher (25.5%) than in the area of CP (Table 2). However, Costa et al. (2005) found no difference in productivity between the weekly control and the forecasting system, which can be attributed to the low disease level and the slow evolution of the disease. The severity of late blight in the area of IP was low (0.012%) and significantly lower than that found in the area of CP (0.15%) (Table 2).
The lower productivity and greater intensity of late blight, as it was the case in the area of CP, may be related to the indiscriminate use of agrochemicals and iatrogenic effects (Chaboussou, Table 2. Yield, late blight severity, number of sprays, amount and fungicides cost used in
integrated (IP) and conventional (CP) production of tomato cv. Alambra. (season 2006-2007) and cv. Paronset (season 2007-2008) (produtividade, severidade da requeima, número de pulverizações, quantidade e custo de fungicidas usados no sistema de produção integrado (IP) e convencional (CP) de tomate, cv. Alambra (estação 2006-2007) e cv. Paronset (estação 2007-2008). Caçador, Epagri, 2008.
Production systems
Yield (kg/ha)
Blight
severity N
o sprays Fungicides
(kg ia/ha)
Average cost of fungicides (U$.1,000/ha) 2006-2007
IP 79,782.47 0.39 18 43.32 1.55
CP 74,081.76 0.49 25 110.96 3.24
t-test 1.48** 1.00ns
2007-2008
IP 119,066.40 0,012 20 40.95 1.43
CP 94,867.57 0.15 26 62.51 1.96
t-test 5.54** 2.96**
1987; Ghini & Bettiol, 2000) favoring the disease in the CP area more than in the area of IP. The application of acibenzolar-s-methyl has a variable effect depending on the combination with other fungicides and cultivars (Louws et al., 2001; Romero et al., 2001). In our observations, the use of inducers of resistance in IP does not suggest a deleterious effect, given that productivity was higher than in CP and higher than the average productivity of
the Santa Catarina State.
The annual variation of blight severity can be explained, among other factors, by climatic conditions more favorable to the late blight in 2006-2007 and, because of this, a greater demand for agrochemicals occurred in conventional production. The objective of demonstrating the possibility of a different management of late blight of tomato, based on an alert system and the other practices
that are required by the integrated production system has been achieved, without harming the disease control and productivity. The alert system provided the reduction of costs with fungicides with the advantage of reducing risk to the operator, achieved through the selection of less toxic chemical groups and with less environmental impact. Finally, another positive aspect achieved is the possibility to develop new alert systems for other diseases of tomato in integrated production.
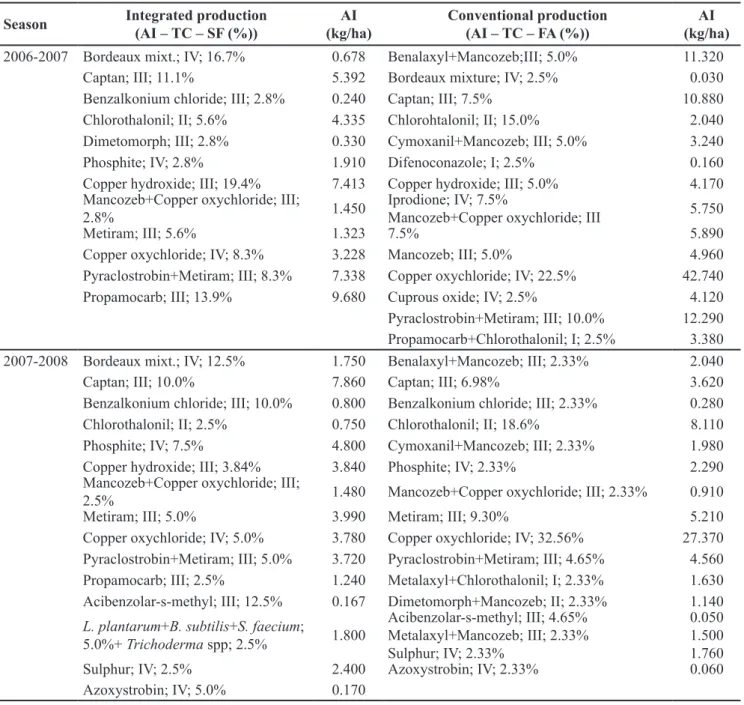
Season Integrated production
(AI – TC – SF (%))
AI (kg/ha)
Conventional production (AI – TC – FA (%))
AI (kg/ha)
2006-2007 Bordeaux mixt.; IV; 16.7% 0.678 Benalaxyl+Mancozeb;III; 5.0% 11.320
Captan; III; 11.1% 5.392 Bordeaux mixture; IV; 2.5% 0.030
Benzalkonium chloride; III; 2.8% 0.240 Captan; III; 7.5% 10.880
Chlorothalonil; II; 5.6% 4.335 Chlorohtalonil; II; 15.0% 2.040
Dimetomorph; III; 2.8% 0.330 Cymoxanil+Mancozeb; III; 5.0% 3.240
Phosphite; IV; 2.8% 1.910 Difenoconazole; I; 2.5% 0.160
Copper hydroxide; III; 19.4% 7.413 Copper hydroxide; III; 5.0% 4.170
Mancozeb+Copper oxychloride; III;
2.8% 1.450
Iprodione; IV; 7.5%
Mancozeb+Copper oxychloride; III 5.750
Metiram; III; 5.6% 1.323 7.5% 5.890
Copper oxychloride; IV; 8.3% 3.228 Mancozeb; III; 5.0% 4.960
Pyraclostrobin+Metiram; III; 8.3% 7.338 Copper oxychloride; IV; 22.5% 42.740
Propamocarb; III; 13.9% 9.680 Cuprous oxide; IV; 2.5% 4.120
Pyraclostrobin+Metiram; III; 10.0% 12.290 Propamocarb+Chlorothalonil; I; 2.5% 3.380
2007-2008 Bordeaux mixt.; IV; 12.5% 1.750 Benalaxyl+Mancozeb; III; 2.33% 2.040
Captan; III; 10.0% 7.860 Captan; III; 6.98% 3.620
Benzalkonium chloride; III; 10.0% 0.800 Benzalkonium chloride; III; 2.33% 0.280
Chlorothalonil; II; 2.5% 0.750 Chlorothalonil; II; 18.6% 8.110
Phosphite; IV; 7.5% 4.800 Cymoxanil+Mancozeb; III; 2.33% 1.980
Copper hydroxide; III; 3.84% 3.840 Phosphite; IV; 2.33% 2.290
Mancozeb+Copper oxychloride; III;
2.5% 1.480 Mancozeb+Copper oxychloride; III; 2.33% 0.910
Metiram; III; 5.0% 3.990 Metiram; III; 9.30% 5.210
Copper oxychloride; IV; 5.0% 3.780 Copper oxychloride; IV; 32.56% 27.370
Pyraclostrobin+Metiram; III; 5.0% 3.720 Pyraclostrobin+Metiram; III; 4.65% 4.560
Propamocarb; III; 2.5% 1.240 Metalaxyl+Chlorothalonil; I; 2.33% 1.630
Acibenzolar-s-methyl; III; 12.5% 0.167 Dimetomorph+Mancozeb; II; 2.33% 1.140
L. plantarum+B. subtilis+S. faecium;
5.0%+ Trichoderma spp; 2.5% 1.800
Acibenzolar-s-methyl; III; 4.65% Metalaxyl+Mancozeb; III; 2.33% Sulphur; IV; 2.33%
0.050 1.500 1.760
Sulphur; IV; 2.5% 2.400 Azoxystrobin; IV; 2.33% 0.060
Azoxystrobin; IV; 5.0% 0.170
Table 3. Active ingredient (AI), toxicological class (TC), spray frequency (SF) and amount of fungicide used in integrated (IP) and
conventional production (CP) during the seasons 2006-2007 and 2007-2008 (ingrediente ativo (IA), classe toxicológica (CT), frequência
ACKNOWLEDGEMENT
The authors acknowledge MAPA/ CNPq for funding the project “Produção Integrada de Tomate de Mesa na Região do Alto Vale do Rio do Peixe, SC” which comprises the present experiments are inserted.
REFERENCES
ANDRADE DFAA. 1997. Previsão e controle químico de pinta-preta (Alternaria solani) sob dois sistemas de condução do tomateiro (Lycopersicon esculentum Mill.). Viçosa: UFV. 103p (Tese mestrado).
BECKER WF. 2005. Validação de dois sistemas de previsão para o controle da requeima do tomateiro na região de Caçador, SC. Agropecuária Catarinense 18: 63-68. BOFF P. 1988. Epidemiologia e controle químico
da mancha-de-estenfílio (Sthemphylium solani Weber) e da pinta-preta (Alternaria solani Jones & Grout), em dois sistemas de condução do tomateiro (Lycopersicon esculentum Mill). Viçosa: Universidade Federal de Viçosa. 140p (Tese mestrado).
CHABOUSSOU F. 1987. Plantas doentes pelo uso de agrotóxicos (a teoria da trofobiose) Porto Alegre: L & PM, 256p.
COSTA H; ZAMBOLIM L; VALE FXR; CHAVES GM. 1995. Controle químico da mela do tomateiro (Phytophthora infestans) sob condições favoráveis à doença. Fitopatologia Brasileira 20 (suplemento): 370.
COSTA RV; ZAMBOLIM L; VALE FXR; MIZUBUTI ESG. 2005. Prediction system for tomato late blight. Summa Phytopathologica
31: 14-20.
DUARTE HSS; ZAMBOLIM L; JESUS JUNIOR WC. 2007. Manejo da requeima do tomateiro industrial empregando sistema de previsão. Summa Phytopathologica 33: 328-334. EPAGRI/CEPA. 2007. Síntese Anual da
Agricultura de Santa Catarina 2006-2007. Florianópolis: Epagri. 282p.
GHINI R; BETTIOL W. 2000. Proteção de plantas na agricultura sustentável. Cadernos de Ciência & Tecnologia 17: 61-70. GODINHO MC; AMARO F; FIGUEIREDO
E; STILWELL S; NUNES AP; MAURÍCIO A; ALMEIDA ML; CORREIA V; MEXIA A. 2003. Proteção Integrada em tomate de indústria: modelo de previsão do míldio. In: Encontro Nacional de Proteção Integrada, 60, Castelo Branco, Technical University
of Lisboa. 550-556. Disponível em: http:// www.repository.utl.pt/handle/10400.5/724. Acessado em 07 junho de 2010.
JAMES WC. 1971. An illustrated series of assessment keys for plant diseases. Their preparations and usages. Canadian Plant Disease Survey 51: 39-65.
LOUWS FJ; WILSON M; CAMPBELL HL; CUPPELS DA; JONES JB; SHOEMAKER PB; SAHIN F; MILLER SA. 2001. Field control of bacterial spot and bacterial speck of tomato using plant activator. Plant Disease 85: 481-488.
M A C H A R D Y W E . 1 9 7 9 . A s i m p l i f i e d noncomputerized program for forecasting potato late blight. Plant Disease Reporter 63: 21-25.
PANDOLFO C; BRAGA HJ; SILVA JÚNIOR VP; MASSIGNAM AM; PEREIRA ES; THOMÉ UMR. 2002. Atlas climatológico do Estado de Santa Catarina. Florianópolis: Epagri; [CD-ROM].
PRECHEUR RJ; BENNETT MA; RIEDEL RM; WIESE KL; DUDEK J. 1992. Management
of fungicide residues on processing tomatoes. Plant Disease 76: 700-702.
PROTAS JFS. 2006. A produção integrada de maçã: da concepção à implantação. In: SANHUEZA RMV; PROTAS JFS; FREIRE JM. (eds) Manejo da macieira no sistema de produção integrada de frutas. Bento Gonçalves: Embrapa Uva e Vinho. p. 11-18. REBELO JA. 1993. Sistema alternativo de
tutoramento para tomateiro. Horticultura Brasileira 11: 161.
RICK CM. 1988. Molecular markers as aid for germplasm management and use in Lycopersicon. HortScience 23: 55-57. SANTOS HS; PERIN WH; TITATO LG; VIDA
JB; CALLEGARI O. 1999. Avaliação de sistemas de condução em relação à severidade de doenças e a produção do tomateiro. Acta Scientiarum 21: 453-457.
SCOLARO J. 2004. Diagnóstico das condições de aplicação de agrotóxicos na região de Caçador. Caçador: UnC. 45p (Monografia) SOCIEDADE BRASILEIRA DE CIÊNCIA DO
SOLO. 2004. Manual de adubação e calagem para os Estados do Rio Grande do Sul e de Santa Catarina. 10 ed. Porto Alegre: Núcleo Regional Sul; Comissão de Química e de Fertilidade do Solo RS/SC. 400p.
VALE FXR; ZAMBOLIM L; PAUL PA; COSTA H. 2000. Doenças causadas por fungos em tomate. In: ZAMBOLIM, L; VALE FXR; COSTA, H (eds). Controle de doenças de plantas – Hortaliças. Viçosa, 2v. p. 699-755. WALLIN JR. 1962. Summary of recent progress
in predicting late blight epidemics in United States and Canada. American Potato Journal 39: 306-312.
WAMSER AF; BECKER WF; SANTOS JP;
MUELLER S. 2008. Influência do sistema