Application of microsatellite markers to confirm
controlled crosses and assess genetic identity in
common bean
Samara Rayane Pereira de Morais
1, Ariadna Faria Vieira
2, Laura
Cristina da Silva Almeida
1, Luana Alves Rodrigues
3, Patrícia
Guimarães Santos Melo
1, Luís Cláudio de Faria
3, Leonardo
Cunha Melo
3, Helton Santos Pereira
3and Thiago Lívio Pessoa
Oliveira de Souza
3*Abstract: This manuscript reports on the application of microsatellite markers
to assess the effectiveness of controlled crosses and assess the genetic identity of seed samples from a same common bean cultivar (BRS Estilo). The DNA was extracted from leaf tissue collected from F1 plants and their parents as well as
from seed samples of the cv. BRS Estilo by the alkaline lysis method. In all cases, genotyping was carried out with 24 microsatellite markers distributed in four multiplex panels with six markers each. Of the 392 F1 plants analyzed, obtained
from 21 different biparental crosses, 325 (82.91%) was confirmed as real hybrids by the molecular analysis. The genetic analysis of the four BRS Estilo seed sam
-ples (two of certified seeds and two of saved seeds) detected 100.00% genetic identity with the samples used as control in only one certified seed sample.
Key words:Phaseolus vulgaris, molecular markers, genetic similarity,
marker-assisted selection, plant breeding.
Crop Breeding and Applied Biotechnology 16: 234-239, 2016 Brazilian Society of Plant Breeding. Printed in Brazil
http://dx.doi.org/10.1590/1984-70332016v16n3n35
NOTE
*Corresponding author:
E-mail: [email protected]
Received: 29 September 2015 Accepted: 11 December 2015
1 Universidade Federal de Goiás (UFG),
74.690-900, Goiânia, GO, Brazil
2 Universidade Federal de Minas Gerais
(UFMG), 39.404-547, Montes Claros, MG, Brazil
3 Embrapa Arroz e Feijão, 75.375-000, Santo
Antônio de Goiás, GO, Brazil
INTRODUCTION
Common bean (Phaseolus vulgaris L.) is an agronomic legume species with key importance for the world, because of its wide use as staple food, especially in developing countries in Africa and Latin America (Broughton et al. 2003). Brazil is currently one of the leading producers and the world’s largest consumer of common bean with a grain production of 2.7 million tons in 2014, on an acreage of 1.94 million hectares, resulting in an average yield of approximately 1,400 kg
ha-1 (http://www.cnpaf.embrapa.br/socioeconomia/index.htm). Nevertheless,
there are many factors that limit the crop performance in the country, related to the cropping system, distribution and marketing of the product, as well as associated with regional preferences. There are also other crop-related factors which can be addressed by breeding, such as grain yield and quality, resistance to pests and diseases, plant architecture and lodging, earliness, efficient biological nitrogen fixation and nutrient uptake, and tolerance to drought and heat (Barros and Souza 2012).
proved useful as tools to assist and optimize the different stages of plant breeding programs. Among these markers are microsatellites, widely used in studies on genetic diversity and mapping, due to the simplicity, high repeatability and informative content of this technique, and for being codominant and multi-allelic (Muller et al. 2014).
The number of populations generated annually by crosses in the scope of a nationwide plant breeding programs is quite considerable. Thus, the use of molecular tools that can enhance or monitor this process is particularly important. Alzate-Marin et al. (1996) have already demonstrated the efficiency of RAPD (Random Amplified Polymorphic DNA) markers for the confirmation of biparental crosses between genetically close parents of common bean and soybean without phenotypic contrast in readily assessable morphological traits. Another important stage of plant breeding programs is the confirmation of the identity and genetic purity of the genotypes during the seed production process, which can also be monitored or improved with molecular markers.
The main goal of this study was to evaluate the efficiency of controlled biparental crosses in common bean and assess the genetic identity of BRS Estilo seed samples using microsatellite markers.
MATERIAL AND METHODS Plant material
In the framework of the common bean breeding program conducted by Embrapa and partners, 392 F1 plants resulting
from 21 different biparental crosses performed under controlled conditions were evaluated. The purpose of these crosses was to develop segregating populations for inheritance studies and mapping of genes or QTLs (Quantitative Trait Loci) associated with disease resistance and slow darkening of grains of the Carioca market class.
Four seed samples of cv. BRS Estilo (Melo et al. 2010) were obtained from common bean growers of traditional producing areas in the State of Goiás. These samples represent four separate lots, two of certified seeds and two of saved seeds (grains used as seeds). All seed samples were analyzed regarding their genetic identity, using as reference two control samples consisting of genetic seed of BRS Estilo provided by Embrapa Arroz e Feijão, the developing institution and custodian of the cv. BRS Estilo. The tested samples and controls consisted of 1.0 kg of seeds each. It is noteworthy that during the breeding process for the development of BRS Estilo, plants were selected in the F5 and again in the F8 generation, as described by Melo et al. (2010). The common bean line ‘LM 98202709’, the original identification of BRS Estilo, was selected in the F8:9 generation. This indicates that BRS Estilo is in fact a line of which all loci, or something very close to 100% of the loci, are expected to be homozygous.
DNA extraction and analysis with molecular markers
The DNA was extracted from leaf tissue samples of F1 plants and their parents and from seed samples of cv. BRS
Estilo using the alkaline lysis method, as described by Xin et al. (2003), but with the modifications proposed by Valdisser et al. (2013). For DNA extraction from seeds, subsamples of 5.0% of the total weight of the initial samples (50 g) were weighed and ground in the laboratory, i.e., one subsample of 50 g for each initial 1.0 kg sample, using a portable mill, model IKA A11 basic (IKA Werke GmbH & Co.).
In the molecular marker analyses, DNA samples from all parents were first analyzed using 24 microsatellite markers distributed in four multiplex panels with six markers each (Valdisser et al. 2013) (Table 1). For the genotyping of the resulting F1 plants, at least one marker identified as polymorphic among the parents of each population was used to
check the hybrid nature of those plants. The amplification reactions of the DNA from all tested plants were performed by multiplex PCR, with a final volume of 5.0 μL, as described by Valdisser et al. (2013). Capillary electrophoresis of the DNA amplified products was performed with an ABI 3500xL sequencer (Applied Biosystems), always using a marker with known molecular weight, the GeneScan 500 ROX Size Standard (Life Technologies). The final genotyping (allele calling) was performed with software GeneMapper (Applied Biosystems).
Table 1. Microsatellite markers grouped in four panels used for molecular characterization of common bean, with the identification of the loci, their respective fluorescence, amplification range in base pairs (bp), primer sequences, and genome location
Panel Marker Fluores
-cence Amplification range (pb) Primer F Primer R
Chromo-somea
1 BM143 HEX 100-170 GGGAAATGAACAGAGGAAA ATGTTGGGAACTTTTAGTGTG Pv02
PVBR25 6-FAM 140-180 GAGCTTCTCCGTCCTGTGT CGAACTGAATCAGAAAGGAA Pv09 BM164 NED 130-190 CCACCACAAGGAGAAGCAAC ACCATTCAGGCCGATACTCC Pv02 BM114 6-FAM 230-260 AGCCTGGTGAAATGCTCATAG CATGCTTGTTGCCTAACTCTCT Pv09 BM138 NED 190-210 TGTCCCTAAGAACGAATATGGAATC GAATCAAGCAACCTTGGATCATAAC Pv05 PVBR169 HEX 195-220 TGGAAAGTCGGAGGAGAAGA AAAAGGGTCCCAACCAAAAC Pv03 2 PVBR5 HEX 160-220 ATTAGACGCTGATGACAGAG AGCAGAATCCTTTGAGTGTG Pv06 PVBR35 6-FAM 190-260 TCTACGCGTTCCCTCTGTCT AGTGGATGTGTGGGAAAAGC Pv04 BM202 6-FAM 100-173 ATGCGAAAGAGGAACAATCG CCTTTACCCACACGCCTTC Pv11 BM189 NED 80-120 CTCCCACTCTCACCCTCACT GCGCCAAGTGAAACTAAGTAGA Pv03 BM210 NED 160-220 ACCACTGCAATCCTCATCTTTG CCCTCATCCTCCATTCTTATCG Pv07 BM155 HEX 100-145 GTTCATGTTTGTTTGACAGTTCA CAGAAGTTAGTGTTGGTTTGATACA Pv05 3 BM187 HEX 120-220 TTTCTCCAACTCACTCCTTTCC TGTGTTTGTGTTCCGAATTATGA Pv06 PVBR113 NED 60-110 TGCATTCTTCCTCCCATCTT TTGATTTGATTTGATCAGTGGTG Pv06 PVBR87 NED 150-201 CTCATTGCGTCTACCAGTGC CCTAGGTTCCGCAGCATGT Pv05 PVBR272 6-FAM 70-135 CAGAACAGAAGAAGAAACAGAAAATG GCGTGTTCCTCTGTGTGTGT Pv02 BM154 6-FAM 205-317 TCTTGCGACCGAGCTTCTCC CTGAATCTGAGGAACGATGACCAG Pv09 PVBR13 6-FAM 159-200 TGAGAAAGTTGATGGGATTG ACGCTGTTGAAGGCTCTAC Pv06 4 PVBR11 HEX 175-192 AAACTCAAAGTCGTTGTTCC CCACTGACTCTAGCTCCTCC Pv02 BM181 NED 170-250 CAACAGTTAAAGGTCGTCAAATT CCACTCTTAGCATCAACTGGA Pv05 BM183 6-FAM 130-170 CTCAAATCTATTCACTGGTCAGC TCTTACAGCCTTGCAGACATC Pv07 PVBR163 6-FAM 180-350 TGAGAGTGGAGAAGGAGAGAGA TGACAACACTGCAAACACCA Pv06 BM201 NED 90-120 TGGTGCTACAGACTTGATGG TGTCACCTCTCTCCTCCAAT Pv01 PVBR251 HEX 193-220 TGAAGTTGCAGCTAGGTTGG GGTTGTGCTTGTGTTGTT GG Pv01
a Genome location based on mapping results (Grisi et al. 2007), the PhaseolusGenes database (http://phaseolusgenes.bioinformatics.ucdavis.edu/) or BLAST analysis using
the reference genome of Phaseolus vulgaris (Schmutz et al. 2014).
Figure 1.DNA amplification profile of common bean genotypes used as contrasting parents for anthracnose reaction with the mi-crosatellite marker BM 189. a) Female parent presenting only allele 103 of BM 189 (homozygous); b) male parent presenting only allele 111 of BM 189 (homozygous); and c) F1 plant presenting both alleles, 103 and 111 of BM 189 (heterozygous), confirming its
RESULTS AND DISCUSSION
The hybrid nature of 325 (82.91%) of the 392 analyzed F1 plants, derived from 21 different biparental crosses, was
confirmed by the molecular analysis (Table 2). The microsatellite loci identified as polymorphic among their parents were heterozygous in these plants, that is, they contained two alleles, each specifically from one of the parents (Figure 1). The remaining 67 analyzed plants (17.09%) were originated by selfing, for containing only the same allele or homozygous genotype as the female parent. For the breeding program for anthracnose, the success rate of hybridization was 92.41% (207/224), for angular leaf spot 61.64% (45/73), for fusarium wilt 53.85% (21/39), and for slow darkening 92.86% (52/56). The variation in success rate of the four different programs was from 53.85 to 92.86%, and of the 21 tested biparental crosses from 33.33 to 100.00% (Table 2).
These results demonstrate the efficiency of the microsatellite markers used in this study to confirm common bean crosses. These markers allow the distinction between effective and ineffective crosses, avoiding a bias caused by plants originated by selfing. This would result in a loss of time and financial resources and produce inconsistent and misleading results about the genetic structure of the studied populations. The results further showed that this confirmation becomes essential when segregating populations are developed to be used in studies where the genetic structure of these populations must be preserved, e.g., in inheritance studies and gene/QTL mapping. In addition, based on the variation of the hybridization rate observed between the different crosses (Table 2), the effectiveness of the crosses did not only depend on the environmental conditions at the moment of the cross and on the experience and training of the cross operator, but also on the genetic suitability or compatibility among the parent genotypes.
In the analysis of the genetic identity of BRS Estilo seed samples, 22 of the 24 initially selected microsatellite loci were used, for having clearly evident and robust polymorphisms. Thus, these 22 loci were effectively used to estimate
Table 2. Common bean breeding programs, crosses, number of evaluated F1 plants, number of obtained hybrids and hybridization rate between common bean genotypes that do not differ among each other based only on morphological traits, estimated using microsatellite markers
Program Cross No. of F1 plants No. of hybrids Hybridization rate (%)
Anthracnose (ANT)
BRSMG Realce × CNFC15826 36 35 97.22 BRS Pontal × Rosinha G2 35 35 100.00 BRS Horizonte × Rosinha G2 17 14 82.35
BRS Cometa × Rosinha G2 21 19 90.48 BRS Horizonte × BRS Cometa 115 104 90.43
Total ANT 224 207 92.41
Angular leaf spot (ALS)
BRS Sublime × BRS Horizonte 26 14 53.85 BRS Sublime × BRS Cometa 13 10 76.92 CNFC 15097 × BRS Horizonte 8 6 75.00
CNFC 15097 × BRS Cometa 3 2 66.67
CNFC 15082 × BRS Horizonte 22 12 54.55
CNFC 15082 × BRS Cometa 1 1 100.00
Total ALS 73 45 61.64
Fusarium wilt (FSW)
BRS Notável × BRS Horizonte 3 1 33.33
BRS Ametista × BRS Horizonte 20 12 60.00 BRS Esplendor × BRS Supremo 9 5 55.56
CNFP 10794 × BRS Supremo 7 3 42.86
Total FSW 39 21 53.85
Slow darkening (SDK)
BRSMG Madrepérola × CNFM 11940 5 3 60.00 BRSMG Madrepérola × 1533-15 6 6 100.00
BRSMG Madrepérola × AN512666-0 12 12 100.00
CNFM 11940 × 1533-15 13 13 100.00
CNFN 11940 × AN512666-0 10 8 80.00
1533-15 × AN512666-0 10 10 100.00
Total SDK 56 52 92.86
the genetic similarity of the four seed sources tested in the present work in relation to the control samples formed by genetic seeds of the cv. BRS Estilo.
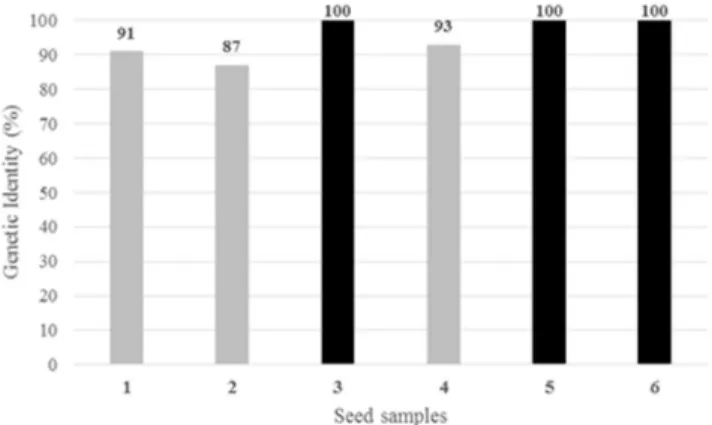
Of the four seed sources tested, in only one 100.00% genetic identity with the two control samples was observed, both of which also presented 100.00% relative genetic similarity to each other (Figure 2). This source consisted of a lot of certified seed. However, the genetic identity of the other certified seed sample was estimated at 93.00%, indicating a potential mixture with other genotypes with similar phenotypic patterns of plants and seeds, possibly undetectable by conventional genetic purity tests. Neither sample of saved seed was totally similar to the control samples, with estimates of genetic similarity of 87.00 and 91.00% (Figure 2). This result demonstrates that the use of uncertified seeds by the common bean growers represents a real risk, since the genetic identity of a considerable part of the plantation will be unknown, enabling potential
discrepancies between plants in terms of yield, environmental adaptation, cycle, and reaction to pests and diseases. Thus, these results also reinforce the importance of using certified seed from a reliable origin.
The advantages of using molecular markers in plant breeding programs over the use of only phenotypic or morphological markers lie in the fact that molecular markers are unlimited in number, usually easily detectable, generate a high level of polymorphism between tested genotypes, are neutral in relation to environmental effects, with little or no effect of epistasis or pleiotropy, and generally behave as traits with simple and predictable inheritance (Barros and Souza 2012).
This study demonstrates the efficiency of microsatellite markers as useful tools to support key decision-making phases in common bean breeding programs. The panel of 24 microsatellite loci used in this study is being routinely used at different stages of the common bean breeding program conducted by Embrapa and partners. In addition to the confirmation of controlled crosses and the detection of genetic identity of genotypes, other microsatellite marker applications include studies of genetic diversity among parents and elite lines, monitoring of allelic diversity and genetic representation of parents in breeding populations obtained by backcrosses and recurrent selection, aside from the control of genetic purity during the seed production process (Batista et al. 2014, Cardoso et al. 2014). It is worth mentioning that this molecular tool is available for immediate adoption and use by other common bean breeding programs in Brazil and worldwide.
In Brazil, marker-assisted selection is only routinely used in breeding programs of plant species of high commercial value, such as soybean, maize and cotton, in particular those led by the private sector. For common bean, although several markers and examples of application in the academic context are available, the routine use is only just being implemented. Thus, this study is an interesting example of the effective application of molecular markers in routine activities of a national common bean breeding program, led by a public research institution. Thousands of SNP (Single Nucletide Polymorphism) markers are currently available for common bean. This number increased greatly due to the recent publication of the genome sequence of the species (Phaseolus vulgaris v1.0; http://www.phytozome.net) (Schmutz et al. 2014). Therefore, efforts are currently under way at Embrapa Arroz e Feijão to develop DNA chips and genotype panels using SNP markers for genetic analysis and marker-assisted selection.
ACKNOWLEDGEMENTS
The authors would like to thank the Universidade Federal de Goiás and Embrapa Arroz e Feijão for the opportunity to develop this work, and are indebted to the entire research team of the common bean breeding program conducted by Embrapa and partners for the constant support. The authors are also grateful to the Conselho Nacional de Desenvolvimento Científico e Tecnológico (CNPq), for scholarships for undergraduate students and for technological development and innovative extension.
REFERENCES
Alzate-Marin AL, Baía GS, Martins-Filho S, Paula-Júnior TJ, Sediyama CS, Barros EG and Moreira MA (1996) Use of RAPD-PCR to identify true hybrid plants from crosses between closely related progenitors. Brazilian Journal of Genetics 19: 621-623.
Barros EG and Souza TLPO (2012) Biotecnologia na cultura do feijoeiro. In Cançado GMA and Londe LN (eds) Biotecnologia aplicada à agropecuária. Editora Epamig, Caldas, p. 351-370.
Batista CEA, Bueno LG, Resende TN, Lima VR, Wendland A, Pereira HS, Faria LC, Melo LC Souza TLPO (2014) Parental genetic representativeness in black seeded common bean progenies from the Embrapa recurrent selection program for tolerance to BGMV. Annual Report of the Bean Improvement Cooperative 57: 221-222.
Broughton WJ, Hernández G, Blair M, Beeb S, Gepts P and Vanderleyden J (2003) Beans (Phaseolus spp.) – model food legumes. Plant and Soil 252: 55-128.
Cardoso PCB, Brondani C, Menezes IPP, Valdisser PAMR, Borba TCO, Del Peloso MJ and Vianello RP (2014) Discrimination of common bean cultivars using multiplexed microsatellite markers. Genetics and Molecular Research 13: 1964-1978.
Cruz CD (2013) GENES – a software package for analysis in experimental statistics and quantitative genetics. Acta Scientiarum Agronomy 35: 271-276.
Grisi MCM, Blair MW, Gepts P, Brondani C, Pereira PAA and Brondani RPV (2007) Genetic mapping of a new set of microsatellite markers in a
reference common bean (Phaseolus vulgaris) population BAT93 × Jalo EEP558. Genetics and Molecular Research 6: 691-706.
Melo LC, Del Peloso MJ, Pereira HS, Pereira HS, Faria LC, Costa JGC, Diaz JLC, Rava CA, Wendland A and Abreu AFB (2010) BRS Estilo – common bean cultivar with carioca grain upright growth and high yield potential. Crop Breeding and Applied Biotechnology 10: 377-379. Muller BSF, Sakamoto T, Menezes IPP, Prado GS, Martins WS, Brondani
C, Barros EG and Vianello RP (2014) Analysis of BAC-end sequences in common bean (Phaseolus vulgaris L.) towards the development and characterization of long motifs SSRs. Plant Molecular Biology 86: 455-470.
Schmutz J, McClean PE, Mamidi S, Wu GA, Cannon SB, Grimwood J, Jenkins J, Shu S, Song Q, Chavarro C, Torres-Torres M, Geffroy V, Moghaddam SM, Gao D, Abernathy B, Barry K, Blair M, Brick MA, Chovatia M, Gepts P, Goodstein DM, Gonzales M, Hellsten U, Hyten DL, Jia G, Kelly JD, Kudrna D, Lee R, Richard MMS, Miklas PN, Osorno JM, Rodrigues J, Thareau V, Urrea CA, Wang M, Yu Y, Zhang M, Wing RA, Cregan PB, Rokhsar DS and Jackson SA (2014) A reference genome for common bean and genome-wide analysis of dual domestications. Nature Genetics 46: 707-713.
Valdisser PAMR, Mota APS, Bueno LG, Menezes IPP, Coelho GRC, Magalhães FOC and Vianello (2013) Protocolo de extração de DNA e genotipagem de SSRs em larga escala para uso no melhoramento do feijoeiro comum (Phaseolus vulgaris L.). Editora Embrapa, Santo
Antônio de Goiás, 6p. (Comunicado Técnico, 208).