Crop Breeding and Applied Biotechnology 11: 50-58, 2011 Brazilian Society of Plant Breeding. Printed in Brazil
Received 20 May 2010
Accepted 16 November 2010
Common bean breeding to improve red grain lines
José Ângelo Nogueira de Menezes Júnior1*, José Eustáquio de Souza Carneiro1, Vanessa Maria Pereira e Silva2, Lêlisângela Carvalho da Silva3, Luiz Alexandre Peternelli4 and Pedro Crescêncio Souza Carneiro2
ABSTRACT- The purpose of this study was to evaluate the performance potential of red bean lines, derived from populations of the first cycle of recurrent selection in the common bean breeding program of the Federal University of Viçosa, Minas Gerais. In the F3:5, F3:6 and F3:7 generations, 243 families from 18 segregating populations were evaluated. These families were conducted by the bulk-within-families method and from the best, 154 lines were obtained and evaluated in the dry season of 2006 (F7: 9) and of 2007 (F7: 10), Coimbra - MG. The estimates of genetic and phenotypic parameters revealed variability among families. The method bulk within F3-derived families proved useful for bean breeding. The most promising lines that may be included in future tests of value for cultivation and use (VCU), and will possibly be recommended for planting in the state of Minas Gerais, were derived from the populations Vermelhinho/AN9022180//Vermelhinho/Vermelho2157, Vermelhinho//Vermelhinho/ IAPAR81,Vermelhinho/LR720982// Vermelhinho/AB136 and Vermelhinho/AB136//Vermelhinho/ Vermelho2157.
Key words:Phaseolus vulgaris L., recurrent selection, selection within families, red bean.
INTRODUCTION
In Brazil, the common bean types with best market acceptance are the carioca and black groups. The efforts of the main breeding programs of this legume were therefore focused on these grain types, with significant gains for yield, disease resistance, plant architecture, earliness and grain quality (Ramalho et al. 2005a, Melo et al. 2006, Silva et al. 2007, Botelho et al. 2008, Menezes Júnior et al. 2008, Ragagnin et al. 2009). However, some bean types, although not very significant at a national level, are important in certain regions of the country. This is the case, e.g., for red bean, widely cultivated in the Zona da Mata of Minas Gerais.
Since bean breeding programs focus mainly on carioca and black bean, producers in regions with
preference for other grain types are forced to use local traditional varieties, which are generally uncompetitive, compared with the improved cultivars. In the case of red bean, the cultivar called Vermelhinho, used by farmers in the Zona da Mata of Minas, has a number of undesirable characteristics, especially with regard to pathogen susceptibility (Alzate-Marin et al. 2006). Besides, the yield potential of this cultivar is low compared to improved cultivars.
Another red bean cultivar called Vermelho 2157, regardless of the higher yield potential and better pathogens resistance, is not used by producers in the Zona da Mata Mineira, since the grains are large and their color is irregular. This limits the use, since such grains have no commercial value (Vieira 2005). Consequently, the demand is high for new commercial cultivars in this group.
1 Universidade Federal de Viçosa (UFV), Departamento de Fitotecnia, 36.570-000, Viçosa, MG, Brazil. *E-mail: jose.angello@yahoo.com.br 2UFV, Departamento de Biologia Geral
To meet this demand, the common bean program of the Federal University of Viçosa (UFV) was also used for the improvement of red bean in the late 1990s. A recent result of this work was the recommendation of the cultivar Ouro Vermelho (Carneiro et al. 2006), with 30% higher yield than Vermelhinho. The release of this cultivar has led to significant yield increases and better market supply of red bean, benefiting both producers and consumers. However, as the demand for red bean has been increasing in the region, new cultivars must be obtained, better than those used by producers. Thus, aside from being more productive, the spectrum of pathogen resistance of new cultivars should be greater and plant architecture better.
Since the various phenotypes of interest are distributed in different parents, it is almost impossible to unite all these phenotypes in a single selection cycle, some authors have suggested the use of recurrent selection (Hallauer 1992), i.e., the cycles of continuous selection and recombination (Geraldi 1997). This strategy has been used with great success in bean breeding to obtain improved lines for various traits of interest (Singh et al. 1999, Ramalho et al. 2005a, Amaro et al. 2007, Menezes Júnior et al. 2008). The purpose of this study was to evaluate the performance potential of red bean lines of the common bean breeding program of the Federal University of Viçosa, derived from populations of the first cycle of recurrent selection.
MATERIAL AND METHODS
The experiments were conducted in an experimental field in Coimbra of the Federal University of Viçosa (UFV), in Coimbra, state of Minas Gerais (lat 20o 45’ S, long 42o 51’ W, alt 690 m asl).
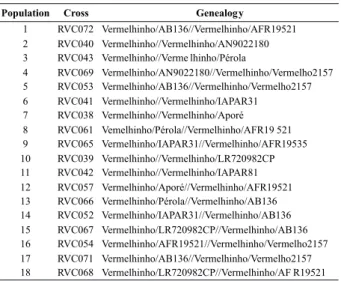
In the beginning of the red bean breeding program of the Federal University of Viçosa, the only red bean cultivar available to farmers in the Zona da Mata Mineira, Vermelhinho, was crossed with the following lines: Aporé, Pérola, IAPAR31, IAPAR81, AN9022180, LR720982CP, AFR19521, AFR19535, AB136, and Vermelho 2157. Segregating populations were established by single, double and back-crosses with cv Vermelhinho 18 (Table 1), representing the basis for a recurrent selection program of the UFV. The crosses were made in a greenhouse following the procedure without emasculation described by Peternelli et al. (2009).
The 18 populations were advanced in bulk for two generations. A total of 243 families derived from plants with the standard red grain color grown in the region Zona
da Mata in Minas Gerais were evaluated for grain yield for three generations, F3:5 , F3:6 and F3:7 , together with 13 controls, in the two of the three possible growing seasons, i.e., in the dry season (sowing Feb/Mar) and winter (sowing Jun/Jul) of 2002 and dry season of 2003, respectively. Each plot consisted of two 2-m rows. During the assessments, families were advanced by the bulk-within-family method. The regional cultural practices for common bean were applied and sprinkler irrigation, whenever rainfall was insufficient (experimental details in Table 2).
The grain yield data in kg ha-1, were subjected to analysis of variance per generation, considering all model effects random, except the mean (Cruz et al. 2004), based on the following statistical model: Yikl = m + pi + rk + bl(k) + eikl, where Yikl is the value observed in the plot of treatment i in block l, within replication k; m is the overall mean, pi is the treatment effect i ( i = 1, 2, 3 ,..., 256), i.e, involving the 243 families and 13 controls; rk is the effect of replication k (k = 1, 2 and 3); bl(k) is the effect of block l within replication k; eikl is the experimental error associated with observation Yikl, assuming independent and normally distributed errors with zero mean and variance
σ
2. Later, analysis of variance was conducted, using the treatment means, adjusted according to Ramalho et al. (2005b).were performed using software Genes (Cruz 2006) and MSTAT-C Michigan State University (1991).
RESULTS AND DISCUSSION
Family performance
Significant differences (P < 0.01) were detected among families of different populations in the three generations studied, indicating variation (Table 3). It must be pointed out that the generation effect was confounded with the effect of years and growing seasons, since the heritability (h2) was also estimated for selection based on
the family mean (Vencovsky and Barriga 1992) and the frequency distribution for grain yield obtained, according to the procedure proposed by Ramalho et al. (2005b).
Families that were outstanding in terms of yield and grain appearance were used for line extraction. Thus, 154 plants were selected with the main traits of interest. These plants were multiplied (F7:8 generation) and later evaluated in plots of two 2-m rows, in the dry season of 2006 (F7:9) and of 2007 (F7:10), for plant architecture, yield and grain appearance (further details in Table 2). Grain appearance was rated on a 1 – 5 scale, where 1 refers to the typical red bean, shiny, not flattened, elliptical shape and mean 100-seed weight between 22 and 24 g; 2 for a red grain with deficiency in one of the cited standard traits; 3 for red grain with deficiency in two of the cited standard traits; 4 for red grain with deficiency in three of the cited standard traits; and 5 for nonstandard red bean grain. Plant architecture was also assessed on a 1-5 scale described by Collicchio et al. (1997), where: 1 refers to an indeterminate growth habit, type II, erect, with a stem and high insertion of the first pod and grade 5 for growth habit III, with long internodes and very prostrate.
Data analysis of grain yield (kg ha-1) was performed using a similar procedure to that described earlier in the process of evaluating families. Initially the individual analyses were performed and subsequently the combined analysis, considering treatment effects and mean as fixed (Cruz et al. 2004). For the grades of grain type and plant architecture the treatment effects and mean were also considered as fixed in the individual analyses. The line means were compared with the standard control, Ouro Vermelho, by the Dunnett test at 5% probability. Analyses
Table 2. Experimental details of the evaluation in segregating families and lines of the first cycle of recurrent selection of the red bean improvement program of the UFV
Table 3. Summary of the individual and combined analyses of grain yield (kg ha-1) in the evaluations of the families F
3:5, F3:6 and F3:7, with the respective estimates of the genetic variance among family means (GV), phenotypic variance in the family means (PhV), variance of the family x generation interaction (VIFxG) and heritability (h2) in the family mean
1 Lower and upper limits of the genetic variance obtained according to
Ramalho et al. (2005b)
2 Lower and upper limits of heritability obtained according to Knapp et al.
(1985)
generations were, obviously, evaluated at different times. The family x generations interaction (growing seasons) was significant (P < 0.01), indicating that families performed differently in different generations and that assessments should be conducted in various environments. In most studies with common bean in the state of Minas Gerais, the interaction of family x growing season was significant for grain yield (Carneiro et al. 2002, Cunha et al. 2005, Melo et al. 2006, Moreto et al. 2007).
Interestingly, the family mean was higher than the mean of the standard cultivar Vermelhinho in the three assessments (Table 3), indicating the possibility of selecting families with better performance than of this standard control. It is also noteworthy that the lower limit of the genetic variance was positive in all situations, indicating that the genetic variance between families is different from zero. The variability between families was also confirmed by heritability estimates (h2) that were greater than zero in all cases, at 95% confidence, since the lower limit of h2 was positive. It should be noted that these h2 estimates are in the broad sense, however, since dominance is not significant in the F3:5 , F3:6 and F3:7, generations, the h2 estimates can be considered in the narrow sense (Moreto et al. 2007).
To visualize the superiority of families, compared to the control Vermelhinho, the frequency distribution was obtained based on grain yield (Figure 1A). It was observed that the mean yield of a large number of families was higher than of the control (Figure 1A). It is worth remembering that the tested families had been advanced by bulk within families and the selection of lines with superior mean performance among these families is expected to be possible.
Of the 243 families tested, five were promoted to the Test of Value for Cultivation and Use (VCU) growing season 2003-2004, (partnership of UFLA, UFV, Epamig and Embrapa Rice and Beans), leading to the recommendation of Ouro Vermelho for the state of Minas Gerais (Carneiro et al. 2006).
The lines evaluated in this study were selected from 43 families of 17 populations (Table 1). Only population 18, cross RVC068, was not used. For the final evaluations, 154 lines were selected.
Line performance
The individual analysis revealed that, in general, lines of a same population did not differ in grain yield and plant architecture. The source of variation among populations
(groups of lines) was significant (P < 0.01) for all traits, indicating better performance of some populations.
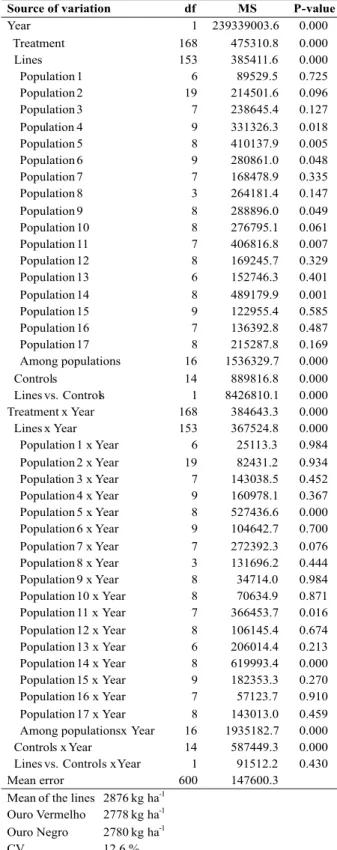
The combined analysis (Table 4) showed that the line x year interaction was significant (P < 0.01) for yield, indicating that the line performance was not consistent in different years. The same observation was made in the evaluation of families. The significance of the line x year interaction complicates the selection of promising lines in different environments and demonstrates that assessments should be conducted at different times. Couto et al. (2008), evaluated carioca grain lines in southern Minas Gerais, which also performed differently in different environments. The authors suggested, in the particular case of common bean, that best lines should be selected based on the mean of multiple environments.
In the partitioning of the line x year interaction, it was observed that the interaction between lines of each population and years was in most cases insignificant (Table 4), whereas the source of variation population x year was significant (P < 0.01). The mean of the lines (2876 kg ha-1) was clearly higher than of cultivar Ouro Vermelho (2778 kg ha-1) (Table 4) and even than of Ouro Negro (2780 kg ha-1), considered a reference in yield.
Dunnett’s test (5% probability) indicated that 151 lines (98%) had a mean yield equal to or higher than the standard control Ouro Vermelho. The grain scores ranged from 1.1 to 3.6, and 89 lines (57.8%) had grades below 2, statistically equal to the grade of standard control Ouro Vermelho (1.4). It is worth mentioning that grain appearance is a limiting feature for the recommendation of a bean cultivar, since consumers are rather picky about this aspect. Therefore, the number of red-grained lines with performance potential to be included in VCU trials is noteworthy. Comparing plant architecture however only four lines performed better than the control, as revealed by Dunnett test.
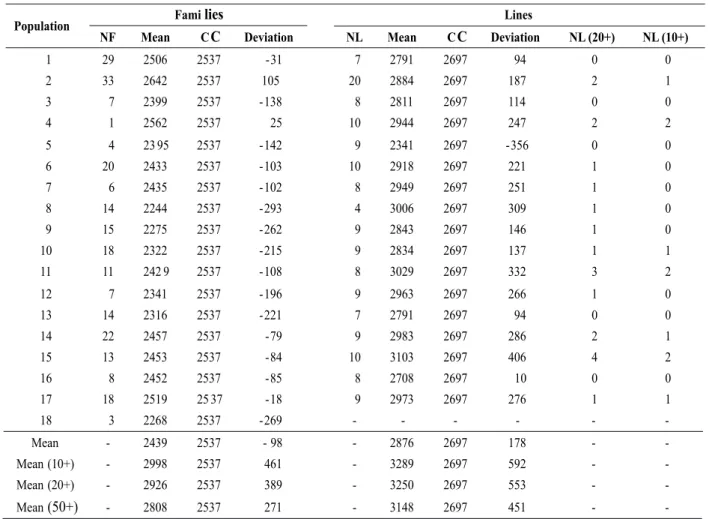
common controls were higher than the deviations of the family means, suggesting that selection within families was effective to breed more productive lines. Since the number of evaluated lines and families was different, the deviations were obtained from 10, 20 and 50 families and highest-yielding lines compared to the checks. The superiority of the lines over the family means was once again confirmed (Table 5).
The population group with highest grain yield was number 11 (Vermelhinho//Vermelhinho/IAPAR81) and 15 (Vermelhinho/LR720982//Vermelhinho/AB136). These populations not only have a high mean yield, but also the highest number of lines among the most productive. In particular, of the 10 lines evaluated of population 15, four
were among the 20 most productive (20 +) and two among the 10 most productive (10 +) (Table 5). Other noteworthy populations are 4 (Vermelhinho/AN9022180//Vermelhinho/ Vermelho2157) and 17 (Vermelhinho/AB136//Vermelhinho/ Vermelho2157), which have high yields as well as the parent cultivar Vermelho 2157, a source of resistance to common bacterial blight and common mosaic, which are important diseases in red common bean.
Populations of group 4 (Vermelhinho/AN9022180// Vermelhinho/Vermelho2157), 11 (Vermelhinho// Vermelhinho/IAPAR81), 15 (Vermelhinho/LR720982// Vermelhinho/AB136) and 17 (Vermelhinho/AB136// Vermelhinho/Vermelho2157) are the most promising for the breeding of red bean lines with high yield potential. Figure 1. Histogram of the combined grain yield (kg ha-1) of the families F
Table 4. Summary of the combined analysis of variance of grain yield (kg ha-1), obtained in the evaluation of the lines F
The bulk method in F3-derived familiesproved promising as a strategy for common bean improvement.
Lines with a better performance potential than of the red bean cultivars Vermelhinho and Ouro Vermelho were obtained, which may be included in future VCU trials and later recommended for planting in the state of Minas Gerais.
ACKNOWLEDGEMENTS
The authors acknowledge the CNPq, CAPES and FAPEMIG for the financial support of the research activities in the Common Bean Program of the Federal University of Viçosa.
Table 5. Mean grain yield (kg ha-1) and deviations compared to the common controls in the evaluation of families and lines
REFERENCES
Amaro GB, Abreu AFB, Ramalho MAP and Silva FB (2007) Phenotypic recurrent selection in the common bean (Phaseolus vulgaris L.) with carioca-type grains for resistance to the fungi Phaeoisariopsis griseola. Genetics and Molecular Biology 30: 584-588.
Alzate-Marin AL, Souza TLPO, Arruda KMA, Silva MGM, Chagas JM, Barros EG and Moreira MA (2006) Reação do cultivar de feijoeiro-comum Vermelhinho à ferrugem, antracnose e mancha-angular. Revista Ceres56: 164-170.
Botelho FBS, Ramalho MAP, Abreu AFB and Rezende BA (2008) Estimates of compensation and stability parameters in common bean lines aiming at multilines. Crop Breeding and Applied Biotechnology 8: 339-345.
Carneiro JES, Ramalho MAP, Abreu AFB and Gonçalves FMA (2002) Breeding potential of single, double and multiple crosses in common bean. Crop Breeding and Applied Biotechnology 2: 515-524.
Carneiro JES, Silva LC, Paula Junior TJ, Araujo GAA, Carneiro PCS, Giudice MP, Menezes Júnior JAN, Ramalho MAP, Peloso MJ and Abreu AFB (2006) Ouro Vermelho: new red bean cultivar for Minas Gerais. Annual Report of the Bean Improvement Cooperative49: 281 - 282.
Collicchio E, Ramalho MAP and Abreu AFB (1997) Associação entre o porte da planta do feijoeiro e o tamanho dos grãos. Pesquisa Agropecuária Brasileira 32: 297-304.
Couto MA, Santos JB and Ferreira JL (2008) Melhoramento do feijoeiro comum com grão tipo carioca, visando resistência à antracnose e à mancha angular. Ciência e Agrotecnologia 32: 1643 -1648.
Cruz CD (2006) Programa Genes: estatística experimental e matrizes. Editora UFV, Viçosa, 285p.
Cruz CD, Regazzi AJ and Carneiro PCS (2004) Modelos biométricos aplicados ao melhoramento genético. Editora UFV, Viçosa, 480p.
Cunha WG, Ramalho MAP and Abreu AFB (2005) Selection aiming at upright growth habit common bean with carioca type grains. Crop Breeding and Applied Biotechnology5: 379-386.
Geraldi IO (1997) Selección recurrente en el mejoramiento de plantas. In Guimarães EP (ed.) Selección recurrente en arroz. CIAT, Cali, p. 3-11.
Hallauer AR (1992) Recurrent selection in maize. Plant Breeding Reviews 9: 115-179.
Knapp SJ, Stroup WW and Ross WM (1985) Exact confidence intervals for heritability on a progeny mean basis. Crop Science 25: 192-194.
Melo CLP, Carneiro JES, Carneiro PCS, Cruz CD, Barros EG and Moreira MA (2006) Linhagens de feijão do cruzamento ‘Ouro Negro’ x ‘Pérola’ com características agronômicas favoráveis.
Pesquisa Agropecuária Brasileira41: 1593-1598.
Menezes Júnior JAN, Ramalho MAP and Abreu AFB (2008) Seleção recorrente para três caracteres do feijoeiro. Bragantia 67: 833-838.
Moreto AL, Ramalho MAP and Abreu AFB (2007) Estimação dos componentes da variância fenotípica em feijoeiro utilizando o método genealógico. Ciência e Agrotecnologia 31: 1035-1042.
MSTAT-C (1991) A software program for the design,
management and analysis of agronomic research experiments. [S.1]: Michigan State University, East Lansing.
Peternelli LA, Borém A and Carneiro JES (2009) Hibridação em feijão. In Borém A (ed) Hibridação artificial de plantas. Editora UFV, Viçosa, p. 514-536.
Melhoramento do feijoeiro visando a obtenção de linhagens
de grãos vermelhos
RESUMO- Este trabalho foi realizado com o objetivo de avaliar o potencial de linhagens de feijão vermelho, oriundas de populações do primeiro ciclo de seleção recorrente do programa de melhoramento do feijoeiro da Universidade Federal de Viçosa. Foram avaliadas 243 famílias, provenientes de 18 populações segregantes, nas gerações F3:5, F3:6 e F3:7. Essas famílias foram conduzidas pelo método do “bulk dentro de famílias” e daquelas com maior potencial, foram extraídas 154 linhagens, avaliadas nas safras da seca de 2006 (F7:9) e seca de 2007 (F7:10), em Coimbra - MG. As estimativas dos parâmetros genéticos e fenotípicos evidenciaram a presença de variabilidade entre as famílias. O método do “bulk dentro de famílias” derivadas de plantas F3 mostrou-se promissorcomo estratégia de melhoramento do feijoeiro. Linhagens com maior potencial para inclusão nos futuros ensaios de valor de cultivo e uso (VCU) para Minas Gerais foram extraídas das populações Vermelhinho/AN9022180//Vermelhinho/ Vermelho2157,Vermelhinho//Vermelhinho/IAPAR81,Vermelhi-nho/LR720982//Vermelhinho/AB136 e Vermelhinho/AB136// Vermelhinho/Vermelho2157.
Ragagnin VA, Souza TLPO, Sanglard DA, Arruda KMA, Costa MR, Azate-Marin AL, Carneiro JES, Moreira MA and Barros EG (2009) Development and agronomic performance of common bean lines simultaneously resistant to anthracnose, angular leaf spot and rust. Plant Breeding128: 156-163.
Ramalho MAP, Abreu AFB and Santos JB (2005a) Genetic progress after four cycles of recurrent selection for yield and grain traits in common bean. Euphytica 144: 23-29.
Ramalho MAP, Ferreira DF and Oliveira AC (2005b) Experimentação em genética e melhoramento de plantas. Editora UFLA, Lavras, 322p.
Silva FB, Ramalho MAP and Abreu AFB (2007)Seleção recorrente fenotípica para florescimento precoce de feijoeiro “carioca”.
Pesquisa Agropecuária Brasileira 42: 1437-1442.
Singh SP, Terán H, Muñoz CG and Takegami JC (1999) Two cycles of recurrent selection for seed yield in common bean. Crop Science 39: 391-397.
Vencovsky R and Barriga P (1992) Genética biométrica no fitomelhoramento. Revista Brasileira de Genética, Ribeirão Preto, 496p.