Research Article
Characterization of Portuguese Centenarian Eating
Habits, Nutritional Biomarkers, and Cardiovascular Risk: A Case
Control Study
A. Pereira da Silva
,
1,2,3A. Valente,
2,4C. Chaves,
5A. Matos
,
2,4,6A. Gil,
2,4,6A. C. Santos,
2,6J. P. Gorjão-Clara,
3,7and M. Bicho
2,61Alameda Primary Care Health Center, Ministry of Health, Lisbon, Portugal
2Genetics Laboratory Environmental Health Institute (ISAMB), Faculty of Medicine, University of Lisbon, Lisbon, Portugal 3Geriatric Universitary Unit of Faculty of Medicine, University of Lisbon, Lisbon, Portugal
4Atlântica-School of Management Sciences, Health, IT & Engineering, Fábrica da Pólvora de Barcarena,
2730-036 Barcarena, Portugal
5Centro Hospitalar de Lisboa Central, Lisboa, Portugal
6Instituto de Investigação Científica Bento da Rocha Cabral, Lisbon, Portugal
7Academic Medical Center of Lisbon-North of Lisbon Hospital Center, Lisbon, Portugal
Correspondence should be addressed to A. Pereira da Silva; [email protected]
Received 26 July 2017; Revised 24 November 2017; Accepted 4 December 2017; Published 13 March 2018 Academic Editor: Rodrigo Valenzuela
Copyright © 2018 A. Pereira da Silva et al. This is an open access article distributed under the Creative Commons Attribution License, which permits unrestricted use, distribution, and reproduction in any medium, provided the original work is properly cited. Background and Aims. Eating habits may contribute to longevity. We characterized the eating habits and cardiovascular risk (CVR) biomarkers in Portuguese centenarians (CENT) compared to controls. Methods and Results. Centenarians (n = 253), 100.26 ± 1.98 years, were compared with 268 controls (67.51± 3.25), low (LCR) and high (HCR) CVR (QRISK®2-2016). Anthropometric and body composition were evaluated by bioimpedance. Abdominal obesity, BMI, and fat mass (FM) cut-offs were according to the WHO. Sarcopenia was defined by muscle mass index cut-off ≤ 16.7 kg/m2. Daily red meat intake, adjusted for age and gender,
was sarcopenia protective (OR = 0.25, 95% CI = 0.096–0.670, P = 0 006); however, it contributes for FM excess (OR = 4.946, 95% CI = 1.471–16.626, P = 0 01), overweight, and obesity (OR = 4.804, 95% CI = 1.666–13.851, P = 0 004). This centenarian eating habit (2%) contrasts to HCR (64.3%). The history of red meat (P < 0 0001) and canned/industrialized food intakes (P < 0 0001) was associated with HCR. Basal metabolism was lower in centenarians versus LCR/HCR (CENT = 1176.78± 201.98; LCR = 1356.54± 170.65; HCR = 1561.33 ± 267.85; P < 0 0001), BMI (CENT = 21.06 ± 3.68; LCR = 28.49 ± 4.69; HCR = 29.56 ± 5.26;
P < 0 0001), waist circumference (CENT = 85.29 ± 10.83; LCR = 96.02 ± 11.71; HCR = 104.50 ± 11.84; P < 0 0001), and waist-hip
ratio (CENT = 0.88± 0.07; LCR = 0.92 ± 0.08; HCR = 1.01 ± 0.08; P < 0 0001). CENT had lower total cholesterol, LDL cholesterol, non-HDL cholesterol, and cholesterol/HDL ratio than controls. Conclusions. Frequent consumption of red meat, cholesterol, and heme iron rich may contribute to obesity and increased CVR. The low frequency of this consumption, observed in centenarians, although associated with sarcopenia, may be one of the keys to longevity.
1. Introduction
According to the WHO, very old individuals are a rapidly growing age group around the globe, thanks to the improve-ments in medicines, as well as the modification lifestyle. This nutrition characteristic is a key component for achieving good health [1]. Adults approaching 70 years will more likely
face problems of caloric excess, leading to overweight or obesity [2].
There are several methods to evaluate the eating habits [3]. Retrospective methods are a good tool for assessing past eating habits [4]; however, they have some limitations, particularly in populations such as the elderly and children groups [3]. Photographic models may play an important role
Volume 2018, Article ID 5296168, 10 pages https://doi.org/10.1155/2018/5296168
when used in conjunction with retrospective methods of food intake assessment [5]. In epidemiological studies, the choice of method to use depends on many factors. The food fre-quency questionnaire (FFQ) is a method regularly used in epidemiological studies. Its use makes possible to evaluate the habitual frequency of food consumption over longer periods of time. It is considered the most practical and infor-mative method to evaluate the relation of causality between food consumption and disease [6]. The structure of the FFQ is usually composed of a predefined food list and a section with the frequency of consumption. Some FFQs are semiquantitative, defining a mean reference portion sumed, so that individual reports define whether their con-sumption was higher, equal, or lower than the average portions presented in home measures [7].
Findings from a meta-analysis indicate that high con-sumption of red meat, in particular, processed meat, is asso-ciated with higher all-cause mortality [8]. Epidemiologic studies have linked the consumption of red or processed meat with obesity, type 2 diabetes, cardiovascular disease (CVD), and cancer [9, 10]. A meta-analysis of 12 cohort studies showed a 20% increase risk of diabetes per 120 g/ day increase in red meat intake and, for processed red meat, a 57% increase risk per 50 g/day increase [11].
Adipose tissue is an active endocrine organ that effects insulin sensitivity and production of insulin-like growth fac-tors and increases the oxidative stress and chronic low-grade inflammation affecting immune response [12]. In obesity, increased release from the adipose tissue of free fatty acids, TNF-α, and resistin and reduced release of adiponectin lead to the development of insulin resistance. Cancer death rates increase, mostly as a consequence of the aging of the popula-tion. A healthy diet and control of obesity based on abundant and variable plant foods, high consumption of cereals, olive oil as the main fat, low intake of red meat, and moderate con-sumption of wine reduced the risk of CVD and cancer [13]. The pathophysiology of sarcopenia is complex, having not modifiable contributory factors, including the aging pro-cess, leading to reduced sex hormones and mitochondrial dysfunction [14]. In addition, some subjects will experience neurodegenerative disease with aging that will have detri-mental effects in terms of muscle signaling and function [15]. Increases in fat mass may contribute to the loss of mus-cle mass that ultimately leads to sarcopenic obesity through increased inflammation and upregulation of protein degra-dation via the ubiquitin-proteasome pathway [16].
In obesity, the presence of inflammatory factors may have detrimental effects on amino acid utilization and/or insulin signaling pathways involved in the stimulation of muscle synthesis following food intake [17].
The physiological and morphological changes in skele-tal muscle with advancing age are characterized by overall declines in size and number of skeletal muscle fibers, mainly the type 2 or fast-twitch muscle fibers, and a marked infiltration of fibrous and adipose tissue into the skeletal muscle [18].
There is a physiological decline in food intake with aging. The reasons are multifactorial (interindividual variations) and may include alterations in the hedonic qualities of food
(decreased odor and taste sensations), increased gastrointes-tinal satiation signals, and a decline in the central feeding drive [19]. The type of diet and eating habits may determine, throughout a nutrigenetic interaction, the levels of reactive species, oxidative stress, and chronic disease development, namely, cardiovascular ones [20]. Nutrients affecting gene expression and genomic integrity modulate disease processes such as cancer, cardiovascular disease, and neurodegenera-tive disorders [21]. The high consumption of red meat, satu-rated fatty acids, and cholesterol may be associated with increased risk of diabetes, CVD, and mortality risk [22]. Free radicals and neuroinflammation processes underlie many neurodegenerative conditions [23]. The diets identified as Alzheimer’s disease protectors were associated with higher intake of vegetables, fruit, whole grains, fish, and legumes and with lower intake of high-fat dairies, processed meat, and sweets [24]. Currently, besides nutrition longevity influ-ence via complex epigenetic mechanisms [25], emerging research techniques such as nutrigenomics, metabolomics, and proteomics indicate that the type of food and dietary restriction can lead to cell health status capable of modulat-ing apoptosis, reactive oxygen species and reactive nitrogen species detoxification, and gene response, towards disease prevention and longevity [23].
For all these reasons and because there are still no studies in all Portuguese population on thisfield, we went to charac-terize the eating habits and nutritional and cardiovascular biomarkers from Portuguese centenarians, to compare them with both high and low cardiovascular risk (CVR) controls.
2. Methods
2.1. Study Patients. We studied from 2012 to 2015 a total of 521 subjects, both genders, being 253 centenarians (CENT) (100.26± 1.98 years old) 197 women (77.9%) and 56 men (22.1%). The control group included 268 subjects (67.51± 3.25 years old), being 164 women (61.2%) and 104 men (38.8%). This group had both low (LCR) and high cardiovascular risks (HCR); calculations were based on QRISK2-2016 [26]. Centenarians, from all the regions of Portugal, were identified, enrolled, and evaluated at their usual place of residence, as previously described [27]. Cente-narian individuals, although uniformly distributed through-out the country, predominated in the Castelo Branco District, followed by Lisbon. The area of Castelo Branco Dis-trict, surrounded by mountains in the orographic aspect, is mainly rural. On the other hand, the area of Lisbon is mainly an urbanized area. At the time of the interview, most of the centenarians (69.2%) reported having lived most of the life in the interior of the country and only 30.8% in coastal regions. Most of them (51%) lived in small villages for most of their life, but it is noteworthy that one part (30.4%) reported having lived in a city environment. Although all the centenarian individuals presented a capacity for under-standing and communication (being an exclusion criterion otherwise), the centenarian men of the present study pre-sented cognitive scores superior to those of centenarian women. The control group included patients recruited from the Heart and Vessels Department of Santa Maria Hospital
and from a primary health care center in Lisbon, Portugal. Hospital de Santa Maria is a reference hospital at the national level, and as such, the controls are not all of the Lisbon region but of several regions of the country.
2.2. Nutrition Data. Anthropometric and body composition analyses were evaluated by bioimpedance, using a portable tetrapolar bioelectrical equipment, the Tanita® BC-420MA (Tanita Corporation of America Inc., Illinois, USA) device to estimate weight, body mass index (BMI), fat mass (FM), muscle mass (MM), and resting metabolic rate (RMR). The MM and FM indexes were calculated [kg/height (m2)]. Exclusion criteria for bioimpedance measurements were pre-viously described [27].
Data were collected by applying a semiquantitative food frequency questionnaire, based on a validated FFQ for a Por-tuguese population [28]. The questionnaire used was com-posed of a list of food groups with 10 items (red meat,fish, eggs, sweets, dairy products, vegetables, legumes, fruits, oil-seeds, and canned food) and one closed section withfive cat-egories of frequencies of consumption. A photographic manual was used, published by the Institute of Public Health Dr. Ricardo Jorge, I.P., [29] as a visual support for the identi-fication of multiples and submultiples of the middle portion. Data were statistically analyzed in order to know the differ-ences of consumption of food groups between the centenar-ians and the control group of both high and low CVR. 2.3. Biomarkers and Cardiovascular Risk. Participants or their direct supervisors were asked to provide access to the latest routine blood analyses. The following biochemical data, obtained by laboratory routine analysis measured in certified labs, were collected when available: glucose, total cholesterol (TC), LDL-C, HDL-C, non-HDL-C, triglycerides (TG), uric acid, urea, and creatinine, or calculated: non-HDL-C.
Dyslipidemia was defined when one of the following conditions was present: TC≥ 200 mg/dL, TG ≥ 150 mg/dL, LDL-C≥ 100 mg/dL, and HDL-C ≤ 40 mg/dL in men or ≤50 mg/dL in women [30].
The abdominal obesity (cm), BMI (kg/m2), and the cut-off for FM by gender were established in agreement with WHO guidelines [31]. Sarcopenia was defined by muscle mass index cut-off ≤ 16.7 kg/m2
[32].
CVR was calculated using a QRISK 2-2016 risk calculator program (https://qrisk.org), based on age, gender, ethnicity, smoking habits, diabetes status, angina or heart attack in a 1st degree relative age below 60 years, chronic kidney disease (stage 4 or 5), atrialfibrillation, hypertension, and rheuma-toid arthritis and also based on cholesterol/HDL ratio, sys-tolic blood pressure, and body mass index [26, 33].
2.4. Ethical Considerations. This study was approved by the Scientific and Ethics Committees of the Lisbon Academic Medical Centre (Faculty of Medicine of the University of Lisbon and Santa Maria Hospital) and by the National Commission for Data Protection and was conducted in agreement with the Helsinki Declaration. All the participants
gave their written informed consent in order to be included in the study.
2.5. Statistical Analysis. Statistical analysis was performed using the computer software for Windows SPSS, version 20.0 (SPSS Inc., Chicago). The results of quantitative variables were expressed as the mean± standard deviation and for qualitative categorical variables as the number and percent-age. To test the normality of all variables, the Kolmogorov-Smirnov test was applied. Categorical variables were compared with the chi-square with the Z-proportion test or Mann–Whitney U test. The comparison of means between groups of numeric variables and normally distributed means was performed by one-way analysis of variance (ANOVA) or Kruskal-Wallis test, followed by the Tukey test. The values of nonnormal parameters are presented in median and inter-quartile range. Numeric variables were related by the applica-tion of Pearson or Spearman correlaapplica-tion coefficients. Binary and multivariate logistic regression analysis was performed. As the measure of association, the odds ratio (OR) was used with the respective 95% confidence interval. All the tests were considered statistically significant if P < 0 05.
3. Results
There were differences in the frequency of food groups’ consumption between centenarians and controls, except for the oilseed group (see Table 1). As shown in Figure 1, the daily intake of red meat, adjusted for age and gender, was a protective factor for sarcopenia (OR = 0.25, 95% CI: 0.096– 0.670, P = 0 006); however, it contributes for FM excess (OR = 4.946, 95% CI: 1.471–16.626, P = 0 01), overweight, and obesity (OR = 4.804, 95% CI:1.666–13.851, P = 0 004). Only 2% of the centenarians reported this eating habit in the opposite 64.3% of the HCR group. In Figure 2, we can see that the frequency history of red meat intake was associ-ated with higher CVR (χ2= 239 807; df = 8, P < 0 0001), in the same way of canned food intake (χ2= 225 321; df = 8,
P < 0 0001).
Basal metabolism (Kcal) was lower in centenarians and higher in the HCR group (Figure 3) (CENT = 1176.78± 201.98 versus LCR = 1356.54 ± 170.65 versus HCR = 1561.33± 267.85; P < 0 0001). Compared with con-trols, centenarians also had a lower BMI (CENT = 21.06± 3.68 versus LCR = 28.49± 4.69 versus HCR = 29.56 ± 5.26;
P < 0 0001) (Figure 4), waist circumference (cm) (CENT =
85.29± 10.83 versus LCR = 96.02 ± 11.71 versus HCR = 104.50± 11.84; P < 0 0001) (Figure 5(a)), and waist-hip ratio (CENT = 0.88± 0.07 versus LCR = 0.92 ± 0.08 versus HCR = 1.01± 0.08; P < 0 0001) (Figure 5(b)).
Considering the biochemical parameter values of CVR, particularly, lipidogram and lipid profile, there were signifi-cant differences between the results obtained between the group of centenarian individuals and those of the low-risk and high-risk control groups (Table 2).
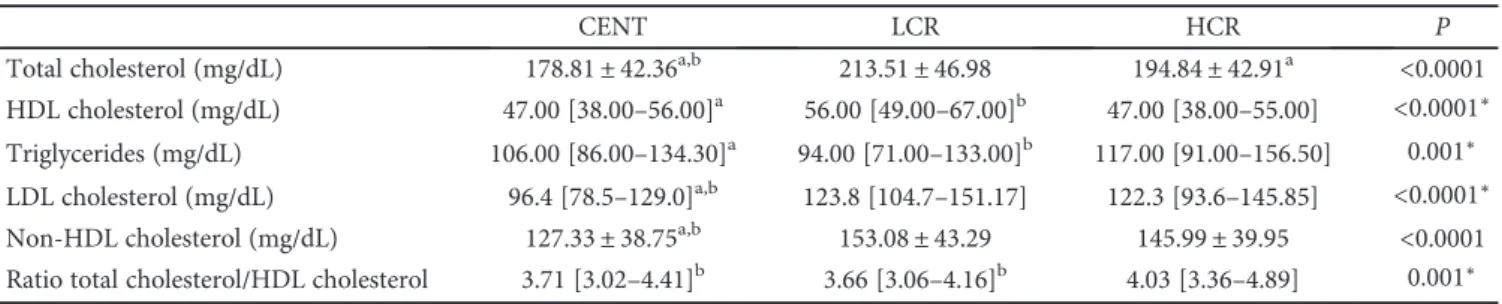
Total cholesterol (P < 0 0001), LDL-C (P < 0 0001), and non-HDL cholesterol (P < 0 0001) levels were lower in the centenarian group and differed significantly from
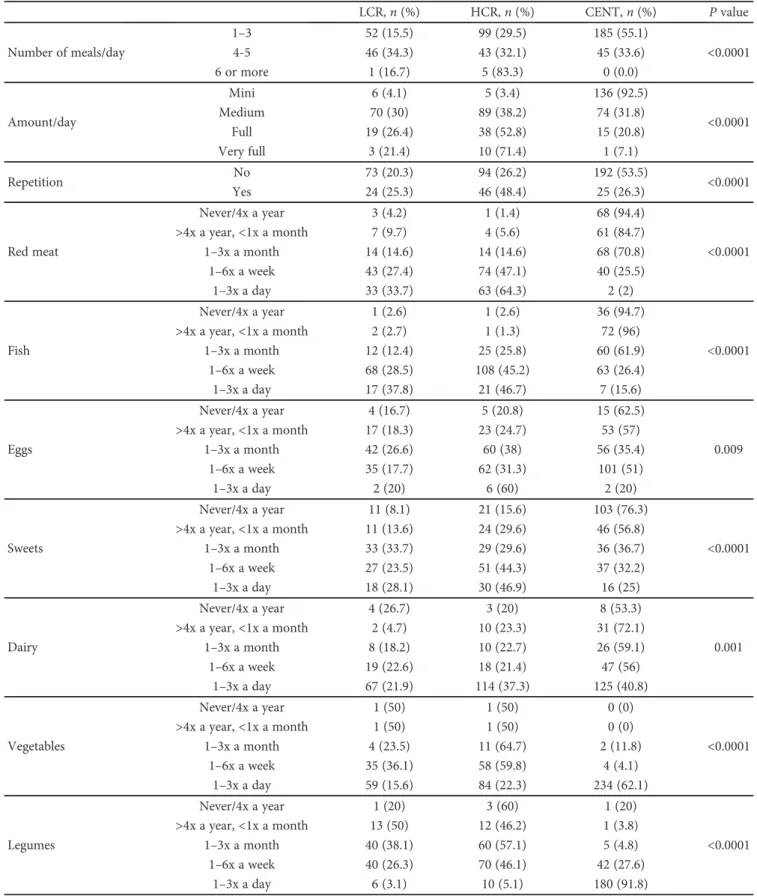
Table 1: Frequency of food consumption and comparison between centenarians (CENT) and low (LCR) and high (HCR) cardiovascular risk control groups. The amount/day and repetition refers to the main meal.
LCR, n (%) HCR, n (%) CENT, n (%) P value Number of meals/day 1–3 52 (15.5) 99 (29.5) 185 (55.1) <0.0001 4-5 46 (34.3) 43 (32.1) 45 (33.6) 6 or more 1 (16.7) 5 (83.3) 0 (0.0) Amount/day Mini 6 (4.1) 5 (3.4) 136 (92.5) <0.0001 Medium 70 (30) 89 (38.2) 74 (31.8) Full 19 (26.4) 38 (52.8) 15 (20.8) Very full 3 (21.4) 10 (71.4) 1 (7.1) Repetition No 73 (20.3) 94 (26.2) 192 (53.5) <0.0001 Yes 24 (25.3) 46 (48.4) 25 (26.3) Red meat Never/4x a year 3 (4.2) 1 (1.4) 68 (94.4) <0.0001 >4x a year, <1x a month 7 (9.7) 4 (5.6) 61 (84.7) 1–3x a month 14 (14.6) 14 (14.6) 68 (70.8) 1–6x a week 43 (27.4) 74 (47.1) 40 (25.5) 1–3x a day 33 (33.7) 63 (64.3) 2 (2) Fish Never/4x a year 1 (2.6) 1 (2.6) 36 (94.7) <0.0001 >4x a year, <1x a month 2 (2.7) 1 (1.3) 72 (96) 1–3x a month 12 (12.4) 25 (25.8) 60 (61.9) 1–6x a week 68 (28.5) 108 (45.2) 63 (26.4) 1–3x a day 17 (37.8) 21 (46.7) 7 (15.6) Eggs Never/4x a year 4 (16.7) 5 (20.8) 15 (62.5) 0.009 >4x a year, <1x a month 17 (18.3) 23 (24.7) 53 (57) 1–3x a month 42 (26.6) 60 (38) 56 (35.4) 1–6x a week 35 (17.7) 62 (31.3) 101 (51) 1–3x a day 2 (20) 6 (60) 2 (20) Sweets Never/4x a year 11 (8.1) 21 (15.6) 103 (76.3) <0.0001 >4x a year, <1x a month 11 (13.6) 24 (29.6) 46 (56.8) 1–3x a month 33 (33.7) 29 (29.6) 36 (36.7) 1–6x a week 27 (23.5) 51 (44.3) 37 (32.2) 1–3x a day 18 (28.1) 30 (46.9) 16 (25) Dairy Never/4x a year 4 (26.7) 3 (20) 8 (53.3) 0.001 >4x a year, <1x a month 2 (4.7) 10 (23.3) 31 (72.1) 1–3x a month 8 (18.2) 10 (22.7) 26 (59.1) 1–6x a week 19 (22.6) 18 (21.4) 47 (56) 1–3x a day 67 (21.9) 114 (37.3) 125 (40.8) Vegetables Never/4x a year 1 (50) 1 (50) 0 (0) <0.0001 >4x a year, <1x a month 1 (50) 1 (50) 0 (0) 1–3x a month 4 (23.5) 11 (64.7) 2 (11.8) 1–6x a week 35 (36.1) 58 (59.8) 4 (4.1) 1–3x a day 59 (15.6) 84 (22.3) 234 (62.1) Legumes Never/4x a year 1 (20) 3 (60) 1 (20) <0.0001 >4x a year, <1x a month 13 (50) 12 (46.2) 1 (3.8) 1–3x a month 40 (38.1) 60 (57.1) 5 (4.8) 1–6x a week 40 (26.3) 70 (46.1) 42 (27.6) 1–3x a day 6 (3.1) 10 (5.1) 180 (91.8)
either the low or the high cardiovascular risk control sub-groups (Table 2).
In relation to LDL values, there were no significant differ-ences between LCR and HCR subjects (P = 0 161, Tukey test). In cholesterol/HDL cholesterol ratio, there was no significant difference between centenarians and LCR subjects (P = 0 960, Tukey test) (Table 2).
4. Discussion
As far as we know, this is an original work in human longev-ity which investigates some aspects of eating habits, anthro-pometry, basal metabolism, and blood parameters. We sought to know the history of the eating habits of Portuguese centenarians and verify if these habits were or not coincident with the history of the dietary profile of younger individuals, some of them with HCR and others with LCR, whose proba-ble life expectancy, according to the projection of the 2011 census, does not exceed 84 years [34].
We applied a semiquantitative food frequency question-naire using photographic models because it was considered to be the most appropriate for the population studies [35, 36]. The 24-hour questionnaire is a retrospective method considered the one with the best accuracy to estimate food intake [37]. However, as mentioned in epidemiological stud-ies in the elderly, the required repetition of the previous 24-hour questionnaire may be more inaccurate in comparison with a food frequency questionnaire in which participants report their past eating habits in a single interview. A large part (71.9%) of the centenarians studied was institutionalized so the present eating habits were very different from the past ones. In the centenarians, it was possible to observe the difference in the ease to recall past eating habits in relation to the most recent ones.
The food history showed that the frequency of consump-tion of legumes, fruits, and vegetables is higher and red meat consumption is lower in the centenarians compared to the control group. The latter was frequently ingested with larger and repeated food portions (Table 1). Both aspects are indic-ative that the daily caloric intake of the centenarians may be lower than that of the controls and that by consuming foods with health benefits (vitamins, bioactive compounds, and die-taryfiber) more often supports the idea that can promote lon-gevity (Figure 2). These data may lead to a reflection on the importance of eating habits such as caloric overload and in particular that associated with red meat ingestion in longevity. The centenarians had distinguished themselves from controls in all food groups that have been evaluated with the exception of oilseed ingestion. There are studies that indi-cate the excess consumption of red meat as a negative impact related to good health since this consumption was associated with obesity, type 2 diabetes, CVD, cancer [10], and higher all-cause mortality [8], and accumulating scientific evidence has indicated that high consumption of red meat, especially processed meat, may be associated with an increased risk of major chronic diseases [22].
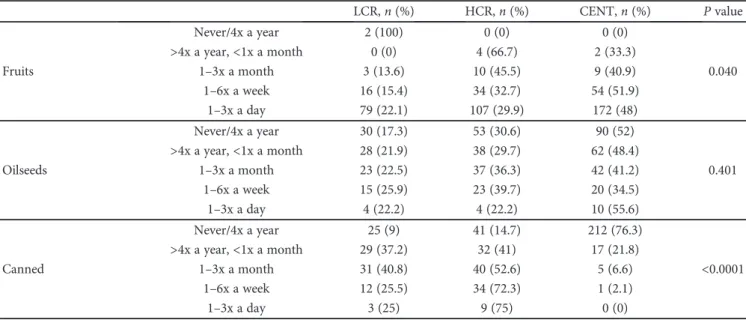
Table 1: Continued. LCR, n (%) HCR, n (%) CENT, n (%) P value Fruits Never/4x a year 2 (100) 0 (0) 0 (0) 0.040 >4x a year, <1x a month 0 (0) 4 (66.7) 2 (33.3) 1–3x a month 3 (13.6) 10 (45.5) 9 (40.9) 1–6x a week 16 (15.4) 34 (32.7) 54 (51.9) 1–3x a day 79 (22.1) 107 (29.9) 172 (48) Oilseeds Never/4x a year 30 (17.3) 53 (30.6) 90 (52) 0.401 >4x a year, <1x a month 28 (21.9) 38 (29.7) 62 (48.4) 1–3x a month 23 (22.5) 37 (36.3) 42 (41.2) 1–6x a week 15 (25.9) 23 (39.7) 20 (34.5) 1–3x a day 4 (22.2) 4 (22.2) 10 (55.6) Canned Never/4x a year 25 (9) 41 (14.7) 212 (76.3) <0.0001 >4x a year, <1x a month 29 (37.2) 32 (41) 17 (21.8) 1–3x a month 31 (40.8) 40 (52.6) 5 (6.6) 1–6x a week 12 (25.5) 34 (72.3) 1 (2.1) 1–3x a day 3 (25) 9 (75) 0 (0) 0.01 0.1 1 10 100 SARCOPENIA FM BMI
Figure 1: Odds ratio of daily intake of red meat, adjusted for age and gender concerning sarcopenia, fat mass excess, and overweight/obesity. The x-axis is in logarithmic scale (log 10).
We found that the individuals with the highest CVR were those who had the highest frequencies of red meat consumptions (Figures 2, 5(a), and 5(b)). In fact, this con-sumption, in particular, processed meat, is associated with a
higher incidence of CVD such as coronary heart disease, heart failure, and stroke in addition to other pathologies [22]. Red meat, on the other hand, is a source of heme iron [38]. Free heme may catalyze oxidant processes involving several components of biological systems, resulting in tissue damage and ultimately leading to disease. Actually, heme-catalyzed oxidations can damage lipids, proteins, DNA, and other nucleic acids and various components of biological sys-tems. A major pathway involves reactions of lipids with heme: LOOH (lipid hydroperoxide) + Fe-ligands (heme) ➔ LOOFe ligands➔ LO∗(lipid alkoxy radical) +∗OFe ligands (heme oxyradical). The alkoxy radicals and the heme oxy radicals can initiate further oxidations some of which would result in oxidative chain reactions. Heme catalysis of oxida-tion is the strongest oxidizing system for developing tissue damage. These heme-catalyzed oxidations can lead to the ini-tiation of biochemical and cellular damage and subsequently disease processes [39]. Also, the formation of N-nitroso com-pounds in the intestine conditioned by the ingestion of red meat may lead to oxidative stress and DNA damage [40]. High red meat consumption was associated with modestly higher concentrations of plasma GGT and hs-CRP, whereas high whole grain bread consumption was related to modestly lower concentrations of GGT, ALT, and hs-CRP [41]. The association of red meat consumption with increased levels of hs-CRP could be modified by high whole grain bread consumption [41].
These facts highlighted the hypothesis that dietary factors may modulate these biomarkers, which may be potential mediators related to the risk of diabetes and CVD [41]. Even more, the discovery of a link between L-carnitine ingestion, gut microbiota metabolism, and CVD risk revealed a new pathway linking dietary red meat ingestion with atheroscle-rosis pathogenesis pointing out the role of gut microbiota in this pathway suggesting a new potential therapeutic target for preventing CVD [42].
Red meat is known to have higher contents of saturated fat and cholesterol [38]; this fact agrees with our observations
0 50 100 150 200
Never/4x Year >4x Year and <1x Month 1-3x Month 1-6x Week 1-3x Day Number of subjects Red me at co n sum p tio n CENT LCR HCR
Figure 2: Distribution of the frequencies of red meat intake during most of the life among the groups: centenarians (CENT), low cardiovascular risk (LCR) control group, and high cardiovascular risk (HCR) control group.
0 500 1000 1500 2000
CENT LCR HCR
Basal metabolism (Kcal)
Figure 3: Basal metabolism of all groups: centenarians (CENT), low cardiovascular risk (LCR) control group, and high cardiovascular risk (HCR) control group.
0 10 20 30 40
CENT LCR HCR
BMI(kg)/height (m2)
Figure 4: BMI (kg)/height (m2) of all groups: centenarians (CENT),
low cardiovascular risk (LCR) control group, and high cardiovascular risk (HCR) control group.
revealing that centenarians (24.1%) have low hypercholes-terolemia frequency than controls of low (75.8%) and high (78.9%) CVR. Additionally, the cholesterol/HDL ratio was statistically higher (P = 0 017) in the high-risk subgroup (4.24± 1.18) compared to centenarians (3.81 ± 1.09) (Table 2). We assumed that the centenarians have low CVR since they reached extreme longevity. We observed that they differ from the other groups, namely, the HCR group having lower values of total cholesterol, LDL choles-terol, non-HDL-C, and cholesterol/HDL ratio. LDL-C and non-HDL-C are atherogenic factors, the latter including TG-rich lipoproteins, cholesteryl ester-enriched remnants of TG-rich lipoproteins, and lipoprotein(a) with great predic-tive CVR value [43].
Excess meat consumption was associated with an increase in fat mass, obesity, and waist circumference and increased waist-hip ratio associated with the HCR group (Figures 4, 5(a), and 5(b)). As observed for red meat intake, our results support this observation, since the frequency (at least 1x a week) of consumption of red meat (χ2= 239 807; df = 8, P < 0 0001) as well as canned/industrialized foods (χ2= 225 321; df = 8, P < 0 0001) was associated with HCR individuals compared to the other groups.
Similarly to that observed with red meat, a higher fre-quency of canned/industrialized food consumption in HCR individuals compared to LCR and centenarians (72.3% ver-sus 25.5% verver-sus 2.1%, resp., consumed at least 1x per week) was observed. It is known that polyphosphates are com-monly used as an additive in industrially processed food
and may increase serum phosphate levels leading to vascular damage and cardiovascular morbidity inducing aging pro-cesses [44].
Concerning meat consumption, however, we found a benefit in relation to a possible contributor to prevent sarco-penia, as verified by Rondanelli et al. [45]. The underlying cause of sarcopenia is unclear but may include a lower basal rate of protein synthesis in aged muscle. Meats are nutrient-rich sources of protein which are potently stimula-tory for muscle protein synthesis and may aid in mediating gains in muscle mass and strength when combined with exercise program [46].
Although beneficial for the prevention of sarcopenia, however, red meat consumption may increase the risk of stroke. In fact, red meat is a source of saturated fatty acids and cholesterol. Some studies have indicated that a high intake of saturated fatty acids increases total cholesterol levels, LDL, and triglycerides, which could increase the risk of stroke [47]. No sarcopenic obesity was observed either in the controls or in the centenarians, which were mostly eutrophic.
It was verified that the group of centenarians consumed more vegetables/legumes/fruits than the control groups (HCR and LCR, Table 1) that may contribute to longevity. Epidemiological studies suggest a role of fruits and vegeta-bles, in protection against disease of aging [23], and the WHO considers that these should be the main foods to be ingested [48]. Actually, the exogenous antioxidants, greatly relevant for longevity, such as vitamin C (ascorbic acid/ ascorbate), vitamin E (tocopherols, tocotrienols), carotenoids
0 50 100 150 CENT LCR HCR Waist circumference (cm) (a) 0.0 0.5 1.0 1.5 CENT LCR HCR Hip-waist ratio (b)
Figure 5: (a) Waist circumference (cm) of all groups: centenarians (CENT), low cardiovascular risk (LCR) control group, and high cardiovascular risk (HCR) control group. (b) Waist-hip ratio of all groups: centenarians (CENT), low cardiovascular risk (LCR) control group, and high cardiovascular risk (HCR) control group.
Table 2: Lipid profile comparison between centenarians (CENT) and low (LCR) and high (HCR) cardiovascular risk control groups.
CENT LCR HCR P
Total cholesterol (mg/dL) 178.81± 42.36a,b 213.51± 46.98 194.84± 42.91a <0.0001 HDL cholesterol (mg/dL) 47.00 [38.00–56.00]a 56.00 [49.00–67.00]b 47.00 [38.00–55.00] <0.0001∗
Triglycerides (mg/dL) 106.00 [86.00–134.30]a 94.00 [71.00–133.00]b 117.00 [91.00–156.50] 0.001∗ LDL cholesterol (mg/dL) 96.4 [78.5–129.0]a,b 123.8 [104.7–151.17] 122.3 [93.6–145.85] <0.0001∗ Non-HDL cholesterol (mg/dL) 127.33± 38.75a,b 153.08± 43.29 145.99± 39.95 <0.0001 Ratio total cholesterol/HDL cholesterol 3.71 [3.02–4.41]b 3.66 [3.06–4.16]b 4.03 [3.36–4.89] 0.001∗
(α-carotene, carotene, zeaxanthin, lutein, lycopene, β-cryptoxanthin, etc.), polyphenols (flavonols, flavanols, antho-cyanins, isoflavones, and phenolic acid), and trace elements (selenium, zinc), predominate in dietary sources derived mainly from the vegetable kingdom [20].
It must be considered protein supplementation in patients with sarcopenia with no medical contraindications [49], which can contribute to improve not only the muscular mass but also the cognitive aspects [50].
The basal metabolism decreases with age [51], which was also observed in our study. It was found that individual HCR controls had an increased basal metabolism compared to the other groups (LCR and centenarians). We assume that the centenarians had a low CVR profile; otherwise, they would not have reached that age.
5. Study Strengths and Limitations
In this case-control study design, the sample size is adequate according to what has been previously explained [27]. The group of centenarians is compared with a group of younger individuals assuming that the probability of reaching 100 years is remote for the control group. On the other hand, it is also assumed that the CVR of centenarians is small com-pared to the control group since otherwise they would not have reached 100 years. Estimation of energy and nutrient intake may be considered a study limitation although the fre-quency of consumption and food portion size were evaluated.
6. Conclusions
Centenarians have a different food history than the control population. Frequent consumption of red meat contributes to obesity and increased CVR, since LDL-cholesterol and heme iron of red meat that catalyze oxidations may lead to atherosclerosis disease processes. Menus mainly with vegeta-bles and legumes and less red meat, observed in centenarians, although associated with sarcopenia, may promote a longer life span.
Disclosure
An earlier version of this paper was presented as an abstract at the 19th European Congress of Endocrinology, held in Lisbon: Endocrine Abstracts (2017) 49: OC5.4.
Conflicts of Interest
The authors declare no conflict of interest.
Acknowledgments
The authors acknowledge Dr. Sara Cardoso (Social Researcher and Writer, Lisbon, Portugal) valuable assistance to the establishment of contacts for the recruitment of cente-narians and Cesar Oliveira for operational collaboration in thefieldwork.The authors would like to thank also Professor Doutor Fausto Pinto, Dean of Faculdade de Medicina da Universidade de Lisboa and of the Heart and Vessels Depart-ment of Santa Maria Hospital, for the support given.
References
[1] M. Kouvari, S. Tyrovolas, and D. B. Panagiotakos,“Red meat consumption and healthy ageing: a review,” Maturitas, vol. 84, pp. 17–24, 2016.
[2] A. H. Lichtenstein, H. Rasmussen, W. W. Yu, S. R. Epstein, R. M. Russell, and J. Mayer,“Modified MyPyramid for older adults,” The Journal of Nutrition, vol. 138, no. 1, pp. 5–11, 2008.
[3] L. J. M. Fagúndez, A. R. Torres, M. E. G. Sánchez, M. L. de Torres Aured, C. P. Rodrigo, and J. A. I. Rocamora,“Historia dietética: metodología y aplicaciones,” Nutrición Hospitalaria, vol. 31, pp. 57–61, 2015.
[4] B. M. Lennernas,“Dietary assessment and validity: to measure what is meant to measure,” Scandinavian Journal of Nutrition, vol. 42, no. 1, pp. 63–65, 1998.
[5] M. Bouchoucha, M. Akrout, H. Bellali et al.,“Development and validation of a food photography manual, as a tool for estimation of food portion size in epidemiological dietary sur-veys in Tunisia,” Libyan Journal of Medicine, vol. 11, no. 1, pp. 32676–32679, 2016.
[6] W. Willet,“Food frequency methods,” in Nutritional Epidemi-ology, W. C. Willett, Ed., pp. 74–100, Oxford University Press, New York, 2nd edition, 1998.
[7] J. Verdú and J. González,“Evaluación del estado nutricional,” in Nutrición y slaud pública, pp. 73–89, Masson, Barcelona, 1995.
[8] S. C. Larsson and N. Orsini,“Red meat and processed meat consumption and all-cause mortality: a meta-analysis,” American Journal of Epidemiology, vol. 179, no. 3, pp. 282– 289, 2014.
[9] V. Bouvard, D. Loomis, K. Z. Guyton et al.,“Carcinogenicity of consumption of red and processed meat,” The Lancet Oncol-ogy, vol. 16, no. 16, pp. 1599-1600, 2015.
[10] L. D. Boada, L. A. Henríquez-Hernandez, and O. P. Luzardo, “The impact of red and processed meat consumption on can-cer and other health outcomes: epidemiological evidences,” Food and Chemical Toxicology, vol. 92, pp. 236–244, 2016. [11] D. Aune, G. Ursin, and M. B. Veierød,“Meat consumption
and the risk of type 2 diabetes: a systematic review and meta-analysis of cohort studies,” Diabetologia, vol. 52, no. 11, pp. 2277–2287, 2009.
[12] R. C. M. Van Kruijsdijk, E. Van Der Wall, and F. L. J. Visseren, “Obesity and cancer: the role of dysfunctional adipose tissue,” Cancer Epidemiology, Biomarkers & Prevention, vol. 18, no. 10, pp. 2569–2578, 2009.
[13] A. Giacosa, R. Barale, L. Bavaresco et al., “Cancer preven-tion in Europe: the Mediterranean diet as a protective choice,” European Journal of Cancer Prevention, vol. 22, no. 1, pp. 90–95, 2013.
[14] M. Yakabe, S. Ogawa, and M. Akishita,“Clinical manifesta-tions and pathophysiology of sarcopenia,” RNA and Tran-scription, vol. 1, no. 2, pp. 10–17, 2015.
[15] K. Sakuma, W. Aoi, and A. Yamaguchi, “Molecular mecha-nism of sarcopenia and cachexia: recent research advances,” Pflügers Archiv - European Journal of Physiology, vol. 469, no. 5-6, pp. 573–591, 2017.
[16] D. Lee, R. P. Shook, C. Drenowatz, and S. N. Blair,“Physical activity and sarcopenic obesity: definition, assessment, preva-lence and mechanism,” Future Science OA, vol. 2, no. 3, article FSO127, 2016.
[17] J. M. Beasley, J. M. Shikany, and C. A. Thomson,“NIH public access,” Nutrition in Clinical Practice, vol. 28, no. 6, pp. 684– 690, 2014.
[18] J. D. Walston,“Sarcopenia in older adults,” Current Opinion in Rheumatology, vol. 24, no. 6, pp. 623–627, 2012.
[19] J. E. Morley,“Decreased food intake with aging,” The Journals of Gerontology: Series A, vol. 56, Supplement 2, pp. 81–88, 2001.
[20] L. A. Da Costa, A. Badawi, and A. El-Sohemy,“Nutrigenetics and modulation of oxidative stress,” Annals of Nutrition & Metabolism, vol. 60, no. s3, pp. 27–36, 2012.
[21] S. Friso and S. Choi, “Gene-nutrient interactions in one-carbon metabolism,” Current Drug Metabolism, vol. 6, no. 1, pp. 37–46, 2005.
[22] A. Wolk,“Potential health hazards of eating red meat,” Journal of Internal Medicine, vol. 281, no. 2, pp. 106–122, 2017. [23] A. Virmani, L. Pinto, Z. Binienda, and S. Ali,“Food,
nutrige-nomics, and neurodegeneration - neuroprotection by what you eat!,” Molecular Neurobiology, vol. 48, no. 2, pp. 353– 362, 2013.
[24] L. Mosconi, J. Murray, M. Davies et al.,“Nutrient intake and brain biomarkers of Alzheimer’s disease in at-risk cognitively normal individuals: a cross-sectional neuroimaging pilot study,” BMJ Open, vol. 4, no. 6, article e004850, 2014. [25] M. D. Niculescu and D. S. Lupu,“Nutritional influence on
epigenetics and effects on longevity,” Current Opinion in Clinical Nutrition and Metabolic Care, vol. 14, no. 1, pp. 35–40, 2011.
[26] J. Hippisley-Cox, C. Coupland, Y. Vinogradova et al., “Predict-ing cardiovascular risk in England and Wales: prospective der-ivation and validation of QRISK2,” BMJ, vol. 336, no. 7659, pp. 1475–1482, 2008.
[27] A. Pereira da Silva, A. Matos, A. Valente et al.,“Body compo-sition assessment and nutritional status evaluation in men and women Portuguese centenarians,” The Journal of Nutrition, Health & Aging, vol. 20, no. 3, pp. 256–266, 2016.
[28] C. Lopes,“Reproducibility and validation of a food frequency questionnaire,” Diet and Myocardial Infarction: A Commu-nityBased Control Study. A Population-Based Case-Control Study (PhD Thesis in Portuguese), University of Porto, Porto, 2000.
[29] M. Rombo, D. Silveira, I. Martins, and A. Cruz, Modelos Foto-gráficos para Inquéritos Alimentares, Instituto Nacional de Saúde Dr. Ricardo Jorge, Lisboa, 1996.
[30] P. S. Jellinger, Y. Handelsman, P. D. Rosenblit et al.,“AACE 2017 guidelines American Association of Clinical Endocrinol-ogists and American College of Endocrinology guidelines for management of dyslipidemia and prevention of atherosclero-sis,” Endocrine Practice, vol. 23, no. 2, pp. 1–87, 2017. [31] WHO Expert Committee, Physical Status: The Use and
Inter-pretation of Anthropometry, WHO Technical Report Series, Geneve, 1995.
[32] J. L. Atkins, P. H. Whincup, R. W. Morris, L. T. Lennon, O. Papacosta, and S. G. Wannamethee,“Sarcopenic obesity and risk of cardiovascular disease and mortality: a population-based cohort study of older men,” Journal of the American Geriatrics Society, vol. 62, no. 2, pp. 253–260, 2014. [33] M. F. Piepoli, A. W. Hoes, S. Agewall et al.,“2016 European guidelines on cardiovascular disease prevention in clinical practice,” European Heart Journal, vol. 37, no. 29, pp. 2315– 2381, 2016.
[34] INE,“Esperança de vida aos 65 anos,” Esperança de vida aos 65 anos, 2016, March 2017, https://www.ine.pt/xportal/ xmain?xpid=INE&xpgid=ine_indicadores&indOcorrCod= 0001723&contexto=bd&selTab=tab2.
[35] S. Tyrovolas, G. Pounis, V. Bountziouka, E. Polychronopoulos, and D. B. Panagiotakos, “Repeatability and validation of a short, semi-quantitative food frequency questionnaire designed for older adults living in Mediterranean areas: the MEDIS-FFQ,” Journal of Nutrition For the Elderly, vol. 29, no. 3, pp. 311–324, 2010.
[36] T. Eysteinsdottir, I. Gunnarsdottir, I. Thorsdottir et al., “Validity of retrospective diet history: assessing recall of midlife diet using food frequency questionnaire in later life,” The Journal of Nutrition, Health & Aging, vol. 15, no. 10, pp. 809–814, 2011.
[37] J. H. Brussaard, for the EFCOSUM Group, M. R. H. Löwik et al.,“A European food consumption survey method–conclu-sions and recommendations,” European Journal of Clinical Nutrition, vol. 56, no. S2, pp. S89–S94, 2002.
[38] P. G. Williams,“Nutritional composition of red meat,” Nutri-tion and Dietetics, vol. 64, no. s4, pp. S113–S119, 2007. [39] A. Tappel,“Heme of consumed red meat can act as a catalyst
of oxidative damage and could initiate colon, breast and prostate cancers, heart disease and other diseases,” Medical Hypotheses, vol. 68, no. 3, pp. 562–564, 2007.
[40] A. M. C. P. Joosen, G. G. C. Kuhnle, S. M. Aspinall et al., “Effect of processed and red meat on endogenous nitrosation and DNA damage,” Carcinogenesis, vol. 30, no. 8, pp. 1402– 1407, 2009.
[41] J. Montonen, H. Boeing, A. Fritsche et al.,“Consumption of red meat and whole-grain bread in relation to biomarkers of obesity, inflammation, glucose metabolism and oxidative stress,” European Journal of Nutrition, vol. 52, no. 1, pp. 337–345, 2013.
[42] R. A. Koeth, Z. Wang, B. S. Levison et al.,“Intestinal microbi-ota metabolism of l-carnitine, a nutrient in red meat, promotes atherosclerosis,” Nature Medicine, vol. 19, no. 5, pp. 576–585, 2013.
[43] M. Miller, H. N. Ginsberg, and E. J. Schaefer,“Relative athero-genicity and predictive value of non-high-density lipoprotein cholesterol for coronary heart disease,” The American Journal of Cardiology, vol. 101, no. 7, pp. 1003–1008, 2008.
[44] E. Ritz, K. Hahn, M. Ketteler, M. K. Kuhlmann, and J. Mann, “Phosphate additives in food—a health risk,” Deutsches Ärzteblatt International, vol. 109, no. 4, pp. 49–55, 2012. [45] M. Rondanelli, S. Perna, M. A. Faliva, G. Peroni, V. Infantino,
and R. Pozzi,“Novel insights on intake of meat and prevention of sarcopenia: all reasons for an adequate consumption,” Nutrición Hospitalaria, vol. 32, no. 5, pp. 2136–2143, 2015. [46] S. M. Phillips, “Nutrient-rich meat proteins in offsetting
age-related muscle loss,” Meat Science, vol. 92, no. 3, pp. 174–178, 2012.
[47] V. Demarin, M. Lisak, S. Morovic, and T. Cengic,“Low high-density lipoprotein cholesterol as the possible risk factor for stroke,” Acta Clinica Croatica, vol. 49, no. 4, pp. 429–439, 2010.
[48] WHO, “Diet, nutrition and the prevention of chronic dis-eases,” World Health Organ Technical Report Series, vol. 916, pp. 1–149, 2003.
[49] J. M. Beasley, J. M. Shikany, and C. A. Thomson,“The role of dietary protein intake in the prevention of sarcopenia of
aging,” Nutrition in Clinical Practice, vol. 28, no. 6, pp. 684– 690, 2013.
[50] R. M. Daly, J. Gianoudis, M. Prosser et al.,“The effects of a protein enriched diet with lean red meat combined with a multi-modal exercise program on muscle and cognitive health and function in older adults: study protocol for a randomised controlled trial,” Trials, vol. 16, no. 1, p. 339, 2015.
[51] H. Shimokata and F. Kuzuya,“Aging, basal metabolic rate, and nutrition,” Nippon Ronen Igakkai Zasshi. Japanese Journal of Geriatrics, vol. 30, no. 7, pp. 572–576, 1993.
Stem Cells
International
Hindawi www.hindawi.com Volume 2018 Hindawi www.hindawi.com Volume 2018 INFLAMMATIONEndocrinology
International Journal of Hindawi www.hindawi.com Volume 2018 Hindawi www.hindawi.com Volume 2018Disease Markers
Hindawi www.hindawi.com Volume 2018 BioMed Research InternationalOncology
Journal of Hindawi www.hindawi.com Volume 2013 Hindawi www.hindawi.com Volume 2018Oxidative Medicine and Cellular Longevity
Hindawi
www.hindawi.com Volume 2018
PPAR Research
Hindawi Publishing Corporation
http://www.hindawi.com Volume 2013 Hindawi www.hindawi.com
The Scientific
World Journal
Volume 2018 Immunology Research Hindawi www.hindawi.com Volume 2018 Journal ofObesity
Journal of Hindawi www.hindawi.com Volume 2018 Hindawi www.hindawi.com Volume 2018 Computational and Mathematical Methods in Medicine Hindawi www.hindawi.com Volume 2018Behavioural
Neurology
Ophthalmology
Journal of Hindawi www.hindawi.com Volume 2018Diabetes Research
Journal ofHindawi
www.hindawi.com Volume 2018
Hindawi
www.hindawi.com Volume 2018 Research and Treatment
AIDS
Hindawiwww.hindawi.com Volume 2018
Gastroenterology Research and Practice
Hindawi www.hindawi.com Volume 2018