1
Universidade Federal de Minas Gerais, Escola de Enfermagem, Programa de Pós-Graduação em Enfermagem. Belo Horizonte, MG, Brasil.
2
Universidade Federal de Minas Gerais, Departamento de Estatística, Instituto de Ciências Exatas. Belo Horizonte, MG, Brasil.
3
Universidade de São Paulo, Faculdade de Saúde Pública, Departamento de Nutrição. São Paulo, SP, Brasil.
4
Universidade Federal de Minas Gerais, Escola de Enfermagem, Departamento de Nutrição. Av. Alfredo Balena, 190, Sala 316, Santa Efigênia, 30130-100, Belo Horizonte, MG, Brasil. Correspondência para/Correspondence to: ACS LOPES. E-mail: <[email protected]>.
Support: Fundação de Amparo à Pesquisa de Minas Gerais (EDT-3245/06).
Effectiveness of nutritional intervention
in overweight women in
Primary Health Care
Efetividade de intervenção nutricional
em mulheres com excesso de peso
na Atenção Primária à Saúde
Nathália Luíza FERREIRA1 Sueli Aparecida MINGOTI2 Patrícia Constante JAIME3 Aline Cristine Souza LOPES4
A B S T R A C T
Objective
To assess the effectiveness of nutritional intervention in overweight women undergoing Primary Health Care.
Methods
An intervention study was conducted with overweight adult and elderly women aged 20 years or older (body mass index ≥25.0 kg/m² and ≥27.0 kg/m², respectively) who were subjected to 12 months of individual
nutritional monitoring. The effectiveness of the intervention was assessed by dietary, health, and anthropometric indicators.
Results
Conclusion
The proposed nutritional intervention was effective and viable for improving the care of overweight individuals and those suffering from destabilized comorbidities, and may be extended to other contexts.
Indexing terms: Effectiveness. Food consumption. Obesity. Overweight.
R E S U M O
Objetivo
O presente estudo tem como objetivo avaliar a efetividade de intervenção nutricional em mulheres com excesso de peso acompanhadas na Atenção Primária à Saúde.
Métodos
Trata-se de estudo de intervenção, com mulheres com excesso de peso (índice de massa corporal ≥25,0 kg/m² em adultas; e ≥27,0 kg/m² em idosas), ≥20 anos, em acompanhamento nutricional individual durante 12 meses. Avaliou-se a efetividade da intervenção por indicadores dietéticos, de saúde e antropométricos.
Resultados
A maioria das 71 usuárias era adulta, com baixa renda e escolaridade. Após a intervenção, houve aumento do número de refeições, realização do desjejum e consumo de frutas e hortaliças, além da redução da disponibilidade domiciliar de sal, açúcar e óleo, e diminuição no consumo de frituras. Observou-se melhoria da autopercepção da saúde e do peso, bem como diminuição da massa corporal e adiposidade abdominal, sobretudo entre aquelas que participaram de mais encontros (n>9).
Conclusão
A intervenção nutricional proposta foi efetiva e viável para o cuidado de indivíduos com excesso de peso e comorbidades desestabilizadas, podendo ser ampliada para outros contextos.
Termos de indexação: Efetividade. Consumo de alimentos. Obesidade. Sobrepeso.
I N T R O D U C T I O N
There has been a rapid increase in the portion of the global population that can be categorized as overweight. In Brazil, the prevalence of overweight has increased from 21.0% to
49.0% over the past 30 years1,2.
Due to its multifactorial etiology, magnitude, and contribution to the development of Chronic Noncommunicable Diseases (NCD), such as Systemic Arterial Hypertension (SAH), Diabetes Mellitus (DM) and dyslipidemias, managing overweight is a challenge for the health sector
and results in increasing costs over the years3,4.
Therefore, implementing actions that minimize the effects of these diseases on population health is critical, and demonstrates an urgent demand
for health interventions5,6.
Hence, different strategies have been proposed for nutritional care, in particular, the
nutritional counseling, an approach in which the professional can better understand the individual’s lifestyle and encourage their autonomy concerning food choices. Therefore, nutritional counseling offers great potential for the promotion of dietary changes, and, consequently, improvements in
anthropometric profile7,8.
However, despite the relevance of nutritional counseling to lifestyle improvement, few studies exist that evaluate its effectiveness,
especially long-term investigations (≥12 months)
carried out in the context of health services9,10.
nutritional intervention on the health and nutritional status of overweight women at Primary Health Care (PHC).
M E T H O D S
This is an intervention study that includes individuals aged 20 years or older, undergoing nutritional monitoring at Primary Health Care
Units (PHCU) and participating in Project Belo
Horizonte (BH)+Healthy - Project for the Promotion of Healthy Lifestyles launched by the municipal
administration of Belo Horizonte (MG). This project
aims to contribute to the improvement of the population’s quality of life by promoting healthy lifestyles. Some of its main actions are carried out
in public services nominated by Academias da
Cidade Program (ACP, City Academies Program), that together with local PHCU offer regular physical exercise and nutritional counseling to individuals aged 18 years or older. The physical exercise performed at ACP is carried out 3 times weekly, lasting 60 minutes per class. This includes both aerobic and anaerobic exercises with a focus
on improving balance, strength and flexibility11.
In Belo Horizonte, by August 2014, there were 63 operational ACP directly linked to a PHCU, corresponding to approximately 43% of the units of the municipality.
Two Primary Health Care Units in different
regions of Belo Horizonte and their respective local
ACP participated in this study. The individuals included in the study were referred by physical educators of ACP for individual nutritional monitoring at PHCU, carried out by students and certified nutritionists who were trained and supervised by the lead investigators. The criteria for referral to PHCU were agreed upon between the teams of different services - ACP and PHCU with the research team - and consisted of being
overweight in adults (Body Mass Index [BMI] ≥25.0
kg/m²)12 and in elderly (BMI ≥27.0 kg/m²)13, with
or without destabilized DM and/or SAH.
In this study, inclusion criteria included having been referred for nutritional monitoring at PHCU and having completed at least 12 months of intervention. Males were excluded from the analyses due to the low number of referrals, and for maintaining group homogeneity.
Intervention effectiveness was assessed by analyzing the evolution of dietary, health and anthropometric indicators, at baseline and after 12 months.
The anamnesis employed consisted of an instrument developed by national investigations, which was tested and used in previous primary
health care studies14. This included sociodemographic
and economic data (age, years of schooling, per
capita income, professional occupation); issues referring directly to health (self-report of morbidity and sleep quality, use of medication, time spent watching television or using the computer, self-perception of health and body weight); self-report of weekly exercise practices; reported eating habits (number of meals, frequency of breakfasting, liquid consumption during meals, and habit of
chewing food), food profile (reported per capita
household availability of salt, oil, and sugar, frequency of specific food consumption), and anthropometric measurements.
To assess food consumption, a qualitative Food Frequency Questionnaire (FFQ) was used, and pertains to 27 foods, consumed over the last 6 months. This instrument was calibrated for the
population of a municipality in Minas Gerais and
revised according to the foods identified in a study
carried out in 9 PHCU of Belo Horizonte14. The
FFQ used included 5 categories of consumption frequency: daily, weekly, monthly, rarely, and never. These were categorized for the analysis in daily and other consumption (weekly, monthly, rarely, and no ingestion). The consumption of fruit
was categorized either as ≥4 times per week or
<4 times per week.
(WC) in meters were measured. From these
measurements, the BMI (BMI = weight/height2),
waist-height ratio (WHR = WC/height) and the
conicity index [C index = WC(m)/0.109 x √ (weight/
height)] were calculated.
Classification of BMI was separately
performed for adult12 and elderly women13.
Evaluation of the risk of metabolic complications associated with obesity (WC) was carried out as
recommended by the World Health Organization15.
For WHR, values higher than 0.50 were
considered to be high coronary risk16; and the C
index was used to classify high coronary risk, as
proposed by Pitanga16 (up to 49 years old: ≥1.18;
50 years or older: ≥1.22).
For conducting interviews and collecting anthropometric measurements, a manual developed by the researchers was adopted. It included guidelines for applying anamnesis, and assessing and interpreting anthropometric data, in addition to logistics for monitoring of individuals; this allowed for standardization of interviewer conduct and intervention development. The interviewers were periodically trained and supervised by the lead investigators, and the equipments were certified by a competent organization, calibrated, and consistently examined. The consistency of the anamneses was continually analyzed, along with the subsequent consistency of the database.
The intervention consisted of carrying out individualized care, based on verbal or written nutritional counseling. At the end of each consultation, strategies for health recovery were agreed upon, these being feasible for the reality of the users and carried out as maximum 3 points of guidance per consultation, with the aim to avoid excessive information and abrupt changes, which would not be sustainable.
Consultations were scheduled at intervals of 30 to 50 days, at which point the users were queried regarding the occurrence of changes in their health, physical exercise practices, and eating habits. At all stages, the participants were
questioned about their adherence to the agreed-upon changes. The modifications that were not implemented were discussed, as well as potential barriers that limited the adherence to these changes; new forms of dietary intervention were also suggested.
Nutritional intervention was based on
materials provided by the Ministry of Health5,17-19
using tools such as food pictures, domestic utensils, educational games, and printed material with information about treatment goals and the importance of a healthy weight and diet.
A descriptive analysis of the data and evaluation of the normality of the variables was
assessed using the Shapiro-Wilk test.Those with
a normal distribution were presented as mean and standard deviation, with the remaining data as
median and interquartile range (P25-P75). Outlier
values were assessed using a boxplotand were
excluded from the analysis.
The Mann-Whitney test was used to
compare the medians between groups (p<0.05).
To assess the effectiveness of the intervention, we compared the data at the baseline and the reassessment after 12 months using the paired
Student’s t test, Wilcoxon signed rank test and
McNemar’s test(p<0.05).
To assess the magnitude of the variation of anthropometric parameters, delta percentages were calculated: {[(final variable-initial variable)/ initial variable] x 100}. The data were analyzed using the Statistical Package for the Social Sciences
software(SPSS)version 17.0.
The study was approved by the Ethics
Committee of the Universidade Federal de Minas
Gerais (ETIC 328/06) and of the municipality of Belo Horizonte (Protocol nº 017/2007). All participants signed the Free and Informed Consent Form, as required by the Operational norm nº 001/2013 of the National Health Council.
R E S U L T S
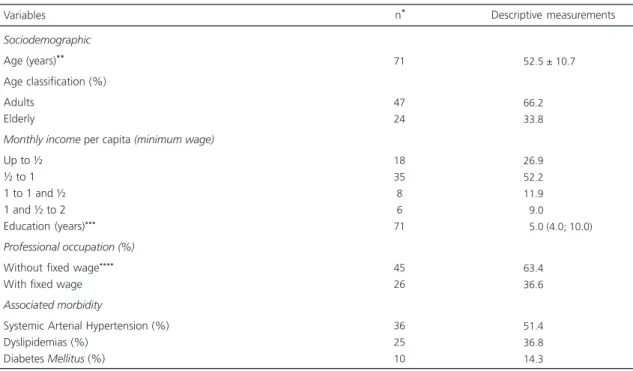
intervention period of 12 months (42.5%). No significant differences were observed between the sociodemographic, economic, and morbidity data of women who either completed or abandoned the monitoring. Among the users that completed the intervention, most were adults, either with a monthly per capita income corresponding to the minimum wage or less, and without receiving a fixed salary. The average age of the group was 52.5 years, with the average length of education being less than 8 years (Table 1). Most individuals reported good sleep quality and perceived themselves as “fat” (Table 2).
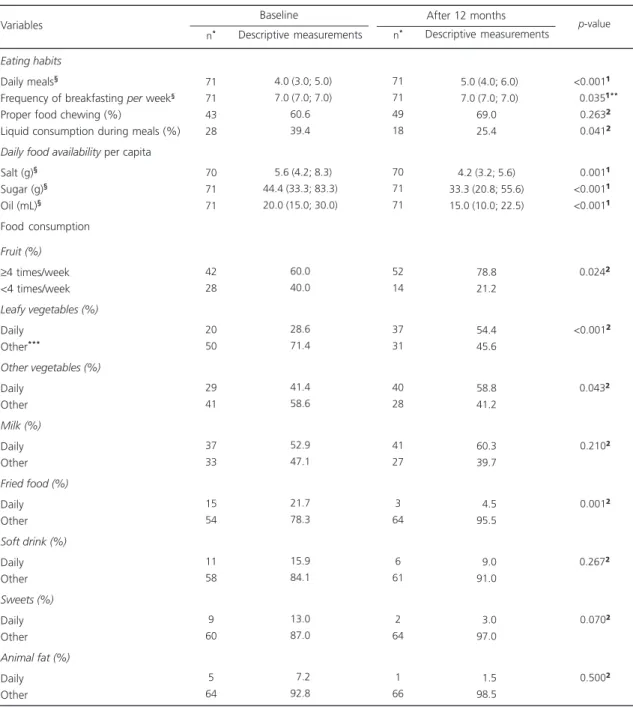
Before intervention, 40.0% of users reported consuming fruit with a frequency of <4 times per week, with less than half of the participants consuming vegetables and legumes daily. There was a median of 4.0 (3.0; 5.0) daily meals and 39.4% users reported consuming liquids during their main meals (Table 3).
Moreover, we observed high frequency of metabolic complications risk associated with
obesity (WC), as well as high coronary risk (WHR and C index) (Table 4).
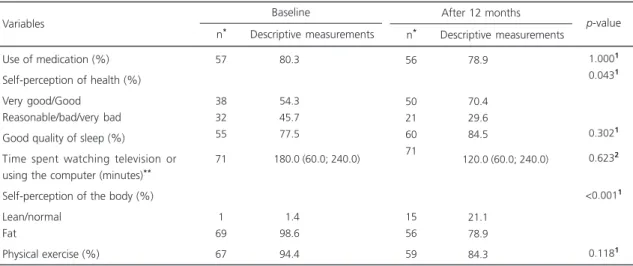
After 12 months of individual nutritional monitoring, an increase in the percentage of users reporting good or very good health was observed
(p=0.043), as well as a higher frequency of
women perceiving their weight as normal or lean (p<0.001) (Table 2).
A decrease in the daily consumption of
fried foods (p=0.001), ingestion of liquids during
meals (p=0.041), and daily household availability
per capita of salt (p=0.001), sugar (p<0.001), and
oil (p<0.001) was observed. Moreover, we noted
an increase in the percentage of fruit consumption
≥4 times per week (p=0.013), daily ingestion of
leafy vegetables (p<0.001) and other vegetables
(p=0.043), number of daily meals (p<0.001) and
frequency of breakfast per week (p=0.035)
(Table 3).
A decrease in body weight (p<0.001) was
observed, which corresponded to a median reduction of 2.9% when compared to the initial
weight, as well as a decrease in BMI (p<0.001),
Table 1. Sociodemographic and health data of participants. Belo Horizonte (MG), 2007-2010.
Sociodemographic
Age (years)** Age classification (%) Adults
Elderly
Monthly income per capita (minimum wage)
Up to ½ ½ to 1 1 to 1 and ½ 1 and ½ to 2 Education (years)***
Professional occupation (%)
Without fixed wage****
With fixed wage Associated morbidity
Systemic Arterial Hypertension (%) Dyslipidemias (%)
Diabetes Mellitus (%)
71
47 24
18 35 8 6 71
45 26
36 25 10
52.5 ± 10.7
66.2 33.8
26.9 52.2 11.9
09.0
05.0 (4.0; 10.0)
63.4 36.6
51.4 36.8 14.3
Note: *Number of responses for the removal of outliers or data absent from the questionnaire; **Mean and standard deviation; ***Median and
interquartile range; ****Housewives and unemployed women.
WC (p<0.001), WHR (p<0.001), C index
(p<0.001), and the percentage of very high risk
of metabolic complications associated with
obesity (WC) (p=0.036) (Table 4).
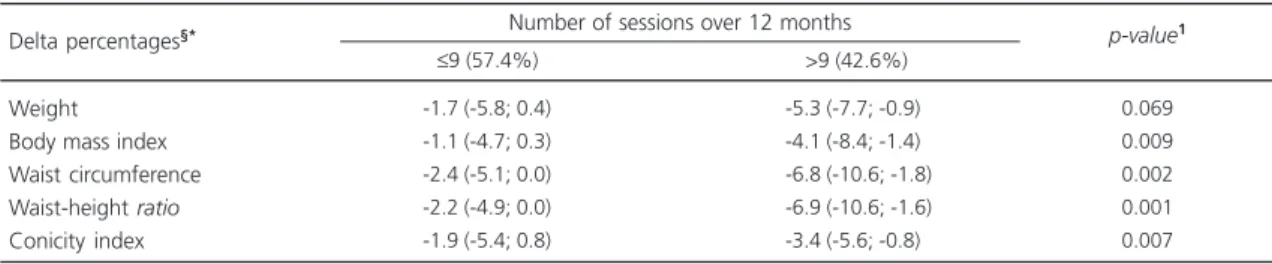
During the 12 months of intervention, there was an average of 9 consultations, ranging from 6 to 15 attendances. When comparing the development of the participants according to the frequency of the sessions, it was observed that women who attended more consultations (>9) presented higher reduction of BMI and measurements of abdominal adiposity (Table 5).
D I S C U S S I O N
The intervention for the management of overweight presented in this study proved to be effective, given the observed changes in eating habits and food consumption, with positive repercussions in anthropometric parameters and self-perception of health and body weight, and with varied results according to the intervention intensity.
On average, participants presented with a low level of education (less than completion of primary school), in addition to having a low
monthly income per capita20. These poor levels
of education and income confer more relevance
Table 2. Evolution ofthehealth conditions of the participants. Belo Horizonte (MG), 2007-2010.
Use of medication (%) Self-perception of health (%) Very good/Good
Reasonable/bad/very bad Good quality of sleep (%)
Time spent watching television or using the computer (minutes)** Self-perception of the body (%) Lean/normal
Fat
Physical exercise (%)
57
38 32 55
71
1 69
67
080.3
054.3
045.7
077.5
180.0 (60.0; 240.0)
001.4
098.6
094.4
Variables
Descriptive measurements n*
Baseline
56
50 21 60 71
15 56
59
078.9
070.4
029.6
084.5
120.0 (60.0; 240.0)
021.1
078.9
084.3
Descriptive measurements n*
After 12 months
1.0001
0.0431
0.3021
0.6232
<0.0011
0.1181 p-value
Note: *Number of response for the removal of outliers or data absent from questionnaire; **Median and interquartile range; ¹McNemar test;
²Wilcoxonsigned rank test.
to our findings, since they are factors that can negatively interfere with healthy decisions and in the interpretation of guidance given by health
professionals21.
The increased number of daily meals and
frequency of breakfast per week acts as a
protective factor against obesity, due to the ingestion of smaller portions of food and consequently lower caloric content; it is associated with a better distribution of meals and other healthy behaviors, such as the consumption of
dairy products, vegetables and whole grains22,23.
A decrease in liquid intake during meals may be beneficial for weight control; liquid foods are less in contact with oropharyngeal receptors due to lack of chewing. Thus, excessive liquid intake reduces the ability to control appetite compared to solid foods, causing excessive caloric intake24.
In addition, it is known that reduced household availability of sugar and oil may favor the restriction of the consumption of sugar and fat-rich food, respectively; these changes, together with an increased consumption of fruits, leafy vegetables and other vegetables, may favor weight loss, prevention and control of
Reduced household salt availability, seen as a
proxyvariable of its consumption, appears as an
appropriate modification to control blood
pressure, primarily in SAH individuals17,18.
Regarding the improvements in the anthropometric pattern, a median reduction of 2.9%
Table 3. Evolution of eating habits and food consumption of the participants. Belo Horizonte (MG), 2007-2010.
Eating habits
Daily meals§
Frequency of breakfasting per week§
Proper food chewing (%)
Liquid consumption during meals (%) Daily food availability per capita
Salt (g)§ Sugar (g)§ Oil (mL)§ Food consumption Fruit (%)
≥4 times/week <4 times/week Leafy vegetables (%)
Daily Other***
Other vegetables (%)
Daily Other Milk (%)
Daily Other Fried food (%)
Daily Other Soft drink (%)
Daily Other Sweets (%)
Daily Other Animal fat (%)
Daily Other 71 71 43 28 70 71 71 42 28 20 50 29 41 37 33 15 54 11 58 9 60 5 64
04.0 (3.0; 5.0)
07.0 (7.0; 7.0) 60.6 39.4
05.6 (4.2; 8.3) 44.4 (33.3; 83.3) 20.0 (15.0; 30.0)
60.0 40.0 28.6 71.4 41.4 58.6 52.9 47.1 21.7 78.3 15.9 84.1 13.0 87.0 07.2 92.8 71 71 49 18 70 71 71 52 14 37 31 40 28 41 27 3 64 6 61 2 64 1 66
05.0 (4.0; 6.0)
07.0 (7.0; 7.0) 69.0 25.4
4.2 (3.2; 5.6) 33.3 (20.8; 55.6) 15.0 (10.0; 22.5)
78.8 21.2 54.4 45.6 58.8 41.2 60.3 39.7 04.5 95.5 09.0 91.0 03.0 97.0 01.5 98.5 <0.001¹
..0.035¹**
-.0.263²
<0.041²
<0.001¹
<0.001¹
<0.001¹
<
..0.024²
<0.001²
..0.043²
<0.210²
<0.001²
..0.267²
<0.070²
<0.500²
Note: *Number of response for the removal of outliers or data absent from the questionnaire; **Evolution of minimum and maximum values for the
number of times used to have breakfast: baseline: 7.0 (0.0; 7.0); after 12 months: 7.0 (3.0; 7.0); ***Other: weekly, monthly, rarely and no consumption;
§Median and interquartile range; ¹Wilcoxonsigned rank test; ²McNemar test.
Variables
n* Descriptive measurements n* Descriptive measurements p-value
Baseline After 12 months
of the initial weight was measured, as well as decreased WC (a recognized parameter for measuring abdominal obesity), and indexes of topographic assessment of body fat (WHR and C index).
Table 4. Anthropometric evolution of the participants. Belo Horizonte (MG), 2007-2010.
Body weight (kg) BMI (kg/m²)
Classification of BMI - adults (%)
Eutrophy Overweight Obesity
Classification of BMI - elderly (%)
Eutrophic Overweight WC (cm)
Risk of metabolic complications - WC (%)
No risk High risk Very high risk WHR
High coronary risk - WHR (%)
No risk With Risk C Index
High coronary risk - conicity index
No risk Risk
n* Descriptive measurements
p-value Baseline 70 70 0 5 43 0 23 70 1 8 62 70 1 70 70 25 46
080.4 ± 11.0†
033.2 (31.7; 35.1)§
000.0
010.4
089.6
000.0 100.0
097.2 ± 7.8†
001.4
011.3
087.3
000.63 ± 0.06†
001.4
098.6
001.24 ± 0.07†
035.2
064.8
n* Descriptive measurements After 12 months
70 70 1 15 31 1 22 70 5 15 50 70 2 68 70 31 39
77.8 ± 12.1†
32.0 (29.4; 35.0)§
02.1 31.9 66.0
04.3 95.7 93.4 ± 9.6†
7.1 21.4 71.4
00.60 ± 0.06†
2.9 97.1
01.21 ± 0.07†
44.3 55.7
-2.9 (-6.4; -0.1) -2.6 (-6.3; -0.2)
--3.2 (-6.7; -0.3)
--3.1 (-6.9; 0.0)
--1.6 (-3.9; 0.8)
-<0.001¹ <0.0012 -<0.001¹
<0.036³
<0.001¹ < 1.000³ <0.001¹ < 0.286³ Delta percentage§**
Note: BMI: Body Mass Index; WC: Waist Circumference; WHR: Waist-Height Ratio; *Number of the response for the removal of outliers or data
absent from the questionnaire; **Delta percentage = {[(final variable-initial variable)/ initial variable] X 100}; †Mean and standard deviation;§Median
and interquartile range; ¹Paired t test; ²Wilcoxon signed ranktest; ³McNemar Test.
Table 5. Comparison of the deltas percentages of anthropometric measurements, according to the number of attendance over 12 months. Belo Horizonte (MG), 2007-2010.
Weight Body mass index Waist circumference Waist-height ratio Conicity index Delta percentages§*
-1.7 (-5.8; 0.4) -1.1 (-4.7; 0.3) -2.4 (-5.1; 0.0) -2.2 (-4.9; 0.0) -1.9 (-5.4; 0.8)
≤9 (57.4%)
-5.3 (-7.7; -0.9) -4.1 (-8.4; -1.4) -6.8 (-10.6; -1.8) -6.9 (-10.6; -1.6) -3.4 (-5.6; -0.8)
>9 (42.6%) 0.069 0.009 0.002 0.001 0.007 p-value1 Number of sessions over 12 months
Note: §Median and interquartile range;*Delta percentage = {[(final variable-initial variable)/initial variable] X 100}; ¹Mann-Whitney test.
beneficial for the health of these individuals, such as a possible decrease in the risk of developing or exacerbating DM, or a decrease in blood pressure, total cholesterol serum levels and atherogenic fractions, risk of occurrence of cardiovascular disease, or joint pain. In
addition to these biological benefits, factors such as improved health and body perception may promote well-being and favor social interactions5,26,27.
status of a population28. The decrease in reporting
body self-perception as “fat” is also an important change, since individuals who feel overweight frequently have a negative view of the intervention process, which may hinder adopting and
maintaining a healthy lifestyle long-term29.
One of the strengths of this study is it was conducted in PHC, a scenario of few studies on
diet and nutritional intervention10. It is also
important to highlight that few studies carried out in this context assessed the evolution of a variety of anthropometric parameters, such as WHR and C-index, of which combined analysis confirms the effectiveness of the intervention.
The link between different points of the health care network - ACP and PHCU - in search of integral care for overweight individuals is a relevant feature of this study, by enabling individuals with distinct health requirements to be differentially attended.
Moreover, it is important to emphasize the positive results obtained, even in a context of low income and education, among individuals with high rates of overall and abdominal obesity as well as of comorbidities. This favors the applicability of this proposal for the care context at PHC. However, for this, it is important to highlight that further studies should be carried out incorporating a control group, as well as performed using representative samples. Nevertheless, to be viably implemented into the health service network, it is believed that the prioritization of individual intervention through specific criteria would be required, given the high demand caused by obesity and other NCD. Therefore, we propose that individual intervention should be realized primarily in individuals with higher levels of overweight than those in this
study (BMI ≥30.0 kg/m² in adults and BMI
≥27.0 kg/m² in the elderly) and with associated
comorbidities, ratifying the criteria recommended by the Brazilian government for the Unified Health System described in the Line of Care for Overweight Individuals6.
To ensure the internal validity of the study, there was great concern with regard to quality control, both in the planning of actions in the field and in the analyses of consistency of questionnaires and databases. Regarding external validity, it is considered out of the scope of the study, as this study was proposed with the aim was to contribute an initial model for the structuring of nutritional actions in the management of overweight through the dialogue between ACP and PHCU.
In the context of the national implementation
of the Health Academy Program30, it is believed
that this study may contribute to the structuring and articulation of food and nutrition interventions in these services, given that the professionals included in this study - ACP physical educators and PHCU nutritionists - are already allocated in the PHC.
The 12-month intervention period may been responsible for the higher number of
follow-up loss5,7, resulting in a smaller sample size;
this likely hindered the observation of some significant results, as in the case of sleep quality, hours watching television or using the computer, decreased physical activity, or consumption of milk, sweets and soft drinks, for instance. On the other hand, it is believed that the long monitoring period, with a higher number of consultations, was essential to achieve more prominent results, and possibly more sustainable post-intervention, given the complexity and chronicity of overweight. Therefore, it is possible to perceive the relevance of the intervention duration and intensity, and consequent adhesion of the participants for control of overweight.
C O N T R I B U T O R S
NL FERREIRA collected, analyzed, and interpreted the data, and wrote the article. SA MINGOTI contributed to the analysis and interpretation of the data, the critical and intellectual revision, and the approval of the final version. PC JAIME contributed to the critical and intellectual revision, and the approval of the final version. ACS LOPES contributed to the conception and delineation of the study, the acquisition of data, participation in analysis and interpretation of the data, the critical and intellectual revision, the approval of the final version, and also helped obtain financial support.
A C K N O W L E D G E M E N T S
We would like to thank the Dean of Research of Universidade Federal de Minas Gerais and the
Fundação de Amparo à Pesquisa do Estado de Minas Gerais for financing the project, the Health Secretariat of Belo Horizonte, and Primary Health Care Units and
Academias da Cidade Program involved.
R E F E R E N C E S
1. Instituto Brasileiro de Geografia e Estatística. Pes-quisa de orçamentos familiares 2008-2009: antropometria e estado nutricional de crianças, adolescentes e adultos no Brasil. Rio de Janeiro: IBGE; 2010.
2. Appel LJ, Clark JM, Yeh HC, Wang NY, Coughlin JW, Daumit G, et al. Comparative effectiveness of weight-loss interventions in clinical practice. N Engl J Med. 2011; 365(21):2959-68. doi: 10.1056/NEJ Moa1108660
3. Sichieri R, Nascimento S, Coutinho W. The burden of hospitalization due to overweight and obesity in Brazil. Cad Saúde Pública. 2007; 23(7):1721-7. doi: 10.1590/S0102-311X2007000700025 4. Bahia L, Coutinho ESF, Barufaldi LA, Abreu GA,
Malhão TA, Souza CPRS, et al. The costs of overweight and obesity-related diseases in the Brazilian public health system: Cross-sectional study. BMC Public Health. 2012; 12(440):1-7. doi: 10.1 186/1471-2458-12-440
5. Brasil. Ministério da Saúde. Departamento de Aten-ção Básica. Cadernos de AtenAten-ção Básica: obesidade. Brasília: Ministério da Saúde; 2006.
6. Brasil. Ministério da Saúde. Consulta Pública n° 14, de 24 de setembro de 2012. Atualiza as diretrizes para organização da prevenção e do tratamento do excesso de peso e obesidade como linha de cuidado prioritária da Rede de Atenção às Pessoas com Doenças Crônicas e dá outras providências. 2012 [acesso 2012 nov 2]. Disponível em: <http:// bvsms.saude.gov.br/bvs/saudelegis/sas/2012/ cop0014_24_09_2012.html>.
7. Rodrigues EM, Piza FPT, Boog MCF. Resgate do conceito de aconselhamento no contexto do aten-dimento nutricional. Rev Nutr. 2005; 18(1):119-28. doi: 10.1590/S1415-52732005000100011 8. Dansinger ML, Tatsioni A, Wong JB, Chung M, Balk
EM. Meta-analysis: The effect of dietary counseling for weight loss. Ann Intern Med. 2007; 147(1):41-50. doi: 10.7326/0003-4819-147-1-200707030-0 0007
9. Guimarães NG. Aconselhamento nutricional em grupo para adultos com excesso de peso e co-morbidades: adesão, repercussões clínicas e meta-bólicas [dissertação]. Brasília: Universidade de Brasília; 2006.
10. Canella DD, Silva ACF, Jaime PC. Produção científica sobre nutrição no âmbito da Atenção Primária à Saúde no Brasil: uma revisão de literatura. Cienc Saúde Colet. 2013; 18(2):297-308. doi: 10.1590/S14 13-81232013000200002
11. Dias MAS, Lopes ACS, Bicalho K, Mourão M, Alves MN, Evangelista PA, et al. Promoção à saúde e articulação intersetorial. In: Magalhães Júnior HM. Desafios e inovações na gestão do SUS em Belo Horizonte: a experiência de 2003 a 2008. Belo Horizonte: Mazza Edições; 2010.
12. World Health Organization. Obesity: Preventing and managing the global epidemic. Geneva: WHO; 1998.
13. Nutrition Screening Initiative. Nutrition interventions manual for professionals caring for older Americans. Washington (DC): NSI; 1992.
14. Lopes ACS, Ferreira AD, Santos LC. Atendimento nutricional na Atenção Primária à Saúde: proposi-ção de protocolos. Nutr Pauta. 2010; 18(101):40-4. 15. World Health Organization. Waist circumference
and waist-hip ratio: Report of a WHO expert consultation, Geneva, 8-11 December 2008. Geneva: WHO; 2011.
18. Brasil. Ministério da Saúde. Departamento de Aten-ção Básica. Cadernos de atenAten-ção básica: hiper-tensão arterial sistêmica. Brasília: Ministério da Saúde; 2006.
19. Brasil. Ministério da Saúde. Departamento de Aten-ção Básica. Cadernos de AtenAten-ção Básica: diabetes
Mellitus. Brasília: Ministério da Saúde; 2006. 20. Instituto Brasileiro de Geografia e Estatística. Síntese
de indicadores sociais: uma análise das condições de vida da população brasileira. Rio de Janeiro: IBGE; 2010.
21. Velásquez-Meléndez G, Pimenta AM, Kac G. Epidemiologia do sobrepeso e da obesidade e seus fatores determinantes em Belo Horizonte (MG), Brasil: estudo transversal de base populacional. Rev Panam Salud Pública. 2004; 16(5):308-14. doi: 10.1590/S1020-49892004001100003
22. Menezes MC, Horta PM, Santos LC, Lopes ACS. Avaliação do consumo alimentar e de nutrientes no contexto da Atenção Primária à Saúde. CERES. 2011; 6(3):175-90.
23. Freitas PP, Mendonça RD, Lopes ACS. Factors associated with breakfasting in users of a public health service. Rev Nutr. 2013; 26(2):195-203. doi: 10.1590/S1415-52732013000200007
24. Mourão DM, Bressan J. Influência de alimentos líquidos e sólidos no controle do apetite. Rev Nutr. 2009; 22(4):537-47. doi: 10.1590/S1415-527320 09000400009
25. Cotta RMM, Reis RS, Batista KCS, Dias G, Alfenas RCG, Castro FAF. Hábitos e práticas alimentares de hipertensos e diabéticos: repensando o cuidado a partir da atenção primária. Rev Nutr. 2009; 22(6):
823-35. doi: 10.1590/S1415-52732009000600 004
26. Ferreira SR, Gimeno SGA, Hirai A, Harima H, Matsumura L, Pittito BA. Effects of an intervention in eating habits and physical activity in Japanese-Brazilian women with a high prevalence of metabolic syndrome in Bauru, São Paulo State, Brazil. Cad Saúde Pública. 2008; 24(2):294-302. doi: 10.1590/S0102-311X2008001400014 27. Pimentel GD, Arimura ST, Moura BM, Silva ME,
Sousa MV. Short-term nutritional counseling reduces body mass index, waist circumference, triceps skinfold and triglycerides in women with metabolic syndrome. Diabetol Metab Syndr. 2010; 2(13):1-7. doi: 10.1186/1758-5996-2-13 28. Braga LS, Macinko J, Proietti FA, César CC,
Lima-Costa MF. Diferenciais intra-urbanos de vulnera-bilidade da população idosa. Cad Saúde Pública. 2010; 26(12):2307-15. doi: 10.1590/S0102-311X 2010001200009
29. Lemon SC, Rosal MC, Zapka J, Borg A, Andersen V. Contributions of weight perceptions to weight loss attempts: Differences by body mass index and gender. Body Image Amsterdam. 2009; 6(2):90-6. doi: 10.1016/j.bodyim.2008.11.004
30. Brasil. Ministério da Saúde. Portaria n° 719, de 7 de abril de 2011. Institui o Programa Academia da Saúde no âmbito do Sistema Único de Saúde. 2011 [acesso 2012 nov 2]. Disponível em: <http://portal. saude.gov.br/portal/arquivos/pdf/portaria_ academia_saude_719.pdf>.