RENATA HERNANDES PITA
CANDIDATE GENES FOR MEAT QUALITY AND GROWTH IN
SWINE
A Dissertation submitted to the Animal Science Graduate Program of the Federal University of Viçosa in partial fulfillment of the requirements of the degree Doctor Scientiae.
Viçosa
RENATA HERNANDES PITA
CANDIDATE GENES FOR MEAT QUALITY AND GROWTH
IN SWINE
A dissertation submitted to the Animal Science Graduate Program of the Federal University of Viçosa in partial fulfillment of the requirements of the degree Doctor Scientiae.
APPROVED: July 2nd, 2004.
_____________________________ ___________________________ Prof. Robledo de Almeida Torres Prof. Paulo Sávio Lopes (Committee member) (Committee member)
__________________________ ____________________________ Dr. Mário Luiz Martinez Prof. Mauro Pires Moraes
_____________________________________ Profa. Simone E. Facioni Guimarães
ACKNOWLEDGEMENTS
I would like to thank my major advisers, Profa. Dra. Simone Eliza Facioni Guimarães and Paulo Sávio Lopes at Federal University of Viçosa and Prof. Dr. Max F. Rothschild at Iowa State University, for their support, patience, and friendship.
I also would like to express my highest respect and special thanks to Dr. Rothschild for giving me the great opportunity to work at Iowa State University, helping me to develop my academic career and sharing his knowledge with me.
I would like to thank the professors of Brazil, especially Dr. Paulo Sávio Lopes for all help during all my PhD work, in special for helping to solve many academic problems that I had and for his encouragement for my study in Iowa State University.
I would like to extend my gratitude to my committee members, Drs. Paulo Sávio Lopes, Robledo de Almeida Torres, Mário Luiz Martinez and Mauro Pires Moraes for all corrections and suggestions.
My thanks also go to the pig molecular genetics laboratory at ISU: Nguyet-Thu Nguyen, Dr. Charles Otieno, Dr. Kwan-Suk Kim, Antonio Marcos Ramos, Dr. Laura Grapes, Vicki Wilke, and Kim Glenn for their friendship and assistance. Also thanks to my friends from ISU department, especially Gretchen, Hauke, Radu, Mehmet and Petek.
I also thank Brazilian friends from Ames, especially Carla and Cristiano, Grace and Aguimar, Ricardo and Luciana, and Brazilians from Viçosa, in special Adriana, Urbano, Rogerio, and Fernanda.
I also give special thanks to my family for their love and support that helped make my graduate study possible and for never letting me give up on my dreams. Especially, my father Hermelindo and my mother Araci for their orientation and encouragement. Also my mother and father in-law for all patience and support.
CONTENTS
pg
RESUMO... vi
ABSTRACT... ix
1. INTRODUCTION... 1
2. REVIEW OF LITERATURE... 3
2.1. Pig gene mapping... 3
2.2. Candidate gene approach... 5
2.3. Candidate genes... 6
2.3.1. Meat quality ... 6
2.3.1.1. Peroxisome proliferator – Activated receptor alpha (PPARA)... 7
2.3.1.2. Peptide YY... 9
2.3.2. Region of high growth ... 10
2.3.2.1. CRADD gene ... 11
2.3.2.2. SOCS2 gene... 11
2.3.2.3. PLXNC1 gene... 12
3. OBJECTIVES ... 14
4.1. Animals... 15
4.2. Management... 15
4.3. Traits measured... 16
4.4. Candidate genes, primer sequences, PCR conditions and polymorphisms. 20 4.5. Linkage mapping and statistical analysis... 25
5. RESULTS... 26
5.1. Identification of polymorphisms and linkage mapping... 26
5.1.1. Meat quality genes... 26
5.1.2. High growth genes... 27
5.2. Berkshire x Yorkshire F2 association study ... 32
5.2.1. Meat quality genes... 32
5.2.2. High growth genes... 33
6. DISCUSSION... 43
7. CONCLUSIONS ... 46
8. REFERENCES CITED ... 47
RESUMO
PITA, Renata Hernandes, D.S., Universidade Federal de Viçosa, Julho 2004.
Genes candidatos para qualidade da carne e crescimento em suínos.
Orientadora: Simone Eliza Facioni Guimarães. Conselheiros: Paulo Sávio Lopes e Robledo de Almeida Torres.
camundongos: Dominíos CASP2 e RIPKI contendo adaptador com domínio da morte (CASP2 e RIPKI domain containing adaptor with death domain - CRADD), suppressor da sinilazição 2 da citoquinas (suppressor of cytokine signaling 2 - SOCS2) e receptor viral de semaforina codificada (viral encoded semaphrin
receptor - PLXNC1). Polimorfismos foram identificados e usados para mapear esses três genes no cromossomo suíno. O PPARA, CRADD, SOCS2 e PLXNC1 foram mapeados no cromossomo 5 de suínos e o PYY foi mapeado no cromossomo 12. Análises de associações foram feitas na população de estudo Berkshire e Yorkshire e observou-se efeitos significativos do genótipo
ABSTRACT
PITA, Renata Hernandes, D.S., Universidade Federal de Viçosa, July 2004.
Candidate genes for meat quality and growth in swine. Adviser: Simone
Eliza Facioni Guimarães. Committee members: Paulo Sávio Lopes and Robledo de Almeida Torres.
1. INTRODUCTION
Conventional selection methods using phenotypic information to assist in the selection of animals with favorable alleles have been practiced for millennia. The response to direct selection for many traits such as reproductive traits have been slow because heritabilitity of many traits is low or the trait is measured after slaughter or they are very expensive to measure phenotypically, such as meat quality characteristics, reproductive traits and diseases traits. (De Vries and Plastow, 1998). Recently, advances in molecular genetic engineering have promised to revolutionize agricultural practices (Lande and Thompson, 1990) .The molecular biology should be integrated with conventional selection methods to obtain the maximum improvement in the economic value of domesticated populations.
The development of molecular biology techniques and the application of these techniques to farm animals have progressed rapidly and have opened new vistas for investigators wishing to identify genes that control quantitative traits (quantitative trait loci - QTL). These include the Halothane (HAL) or stress gene (Christian 1972; Fujii et al., 1991), the Rendement Napole (RN) or acid meat gene (Monin and Sellier, 1985; Ciobanu et al., 2001), the heart-fatty acid binding protein (H-FABP) gene, the fatty acid binding protein (A-FABP) gene (Gerbens et al., 1998), Estrogen receptor (ER) gene (Rothschild et al., 1997) and many others.
genes that have smaller individual effects but large aggregate effects on the trait (Kennedy et al., 1992).
The development and application of molecular biology techniques to farm animals have progressed rapidly allowing us to identify chromosomal regions and genes responsible for differences in pork production. Known functional roles of genes and its genomic locations in species that are rich in genome information, such as human and mouse, can be used to find positional candidate genes (Lander et al., 2001. Therefore, specific genes identified in the human genome in regions that are syntenic with a specific region in the pig, as identified using bi-directional chromosomal painting (Goureau et al., 1996), could be a source of positional candidate genes in the pig for traits of interest.
The candidate gene approach has proven extremely powerful for studying the genetic architecture of complex traits. Quantitative trait locus (QTL) mapping is frequently used to identify genomic regions associated with a phenotypic trait of interest. These regions are generally large and may have thousands of putative genes. By definition, all genes in the QTL region are candidate loci for the trait and fine mapping in the region of QTL can reduce the number of candidate genes.
2. REVIEW OF LITERATURE
2.1. Pig gene mapping
Mapping genes and construction of gene maps are fundamental approaches to achieve the comprehensive understanding of an organism and also, to detect genes or regions with major influences on production traits.
The gene mapping efforts have focused basically on two types of maps, genetic linkage and physical maps. The genetic linkage map defines the genetic distance between two genes or markers as the frequency of recombination caused by crossing over during meiosis. The physical map is to assign genes or markers to specific chromosomal regions regardless of the rate of recombination.
The physical gene map is useful to characterize specific chromosome regions of interest and to facilitate further positional cloning. A somatic cell hybrid panel (Yerle et al., 1996) is an important tool to map the gene. In the pig, the method retains the fragments of all pig chromosomes in the 27 hybrid lines and the porcine somatic cells were fused with rodent tumor cells and only hybrids cells could be positively selected. During subsequent cell divisions a total of 27 somatic cell hybrids were obtained and characterized cytogenetically. Over 1000 genes and markers have been mapped using the somatic hybrid panel.
Genetic maps are primarily developed as tools for the localization and characterization of genes controlling important phenotypic traits. The major impetus for gene mapping research in livestock species is to identify genes underlying economic trait loci (Johansson, et al., 1995).
based on the observation that genes that are closely linked in one species tend to be closely linked in other species if the species have evolved from a common source. The completed human sequence will be compared with non-human sequences and those comparisons will give scientists new insights into evolutionary, biochemical, genetic, metabolic, or physiological pathways (Tilghman, 1996).
Species that are closely related usually accumulate fewer rearrangements and therefore have many long conserved segments. The evidence of conserved segments for mammals is considerable, therefore many human and mouse genes have been mapped with some segments showing strong conservation (Nadeau and Sankoff, 1998).
Comparative mapping between humans and other organisms has revealed that synteny relationships are often conserved across a wide range of species. Therefore, groups of genes that are tightly linked in humans have a high probability of also being linked in other species (Rettenberger et al., 1995). The relationship between position and function of genes in one species can also explain the potential function of the gene in other species because the evolutionary processes might have conserved the clustered multigene families in the genome and the conserved clusters might be homologous to those in other organisms (Clark, 1999).
Recent genome analyses on more amenable organisms such as the mouse,
al., 1999). These results contributed to the specification of borders of homologous segments in each species and have allowed the orientation of these segments.
To explore the molecular genetics of growth or reproduction it will be necessary to identify and isolate the candidate genes involved in specific trait development (Rettenberger, et al., 1995).
2.2. Candidate gene approach
This approach assumes that candidate genes represent a proportion of the QTL that determine a particular trait. The following are steps involved in a candidate gene analysis (Rothschild and Soller, 1997):
1) Choosing the candidate gene. In this case three sources of information can be used: Physiological approach, mutational approach and positional approach. The physiological approach involves prior knowledge of the biochemistry and / or physiology of a trait to draw up a list of genes. The mutational approach looks for mutations in genes from other species, and the positional approach combines information about a gene’s chromosomal location with QTL information for easier identification of a potential causative gene. Also, comparative mapping can be used to utilize information of known genes in another species to map a gene in the species of interest.
chromosomal region, advanced fine mapping of QTL, and positional comparative candidate gene analysis.
2) Designing primer sequences to amplify the gene. The primers can be made from existing databases or using sequence similarity between species.
3) Uncovering polymorphisms in the gene. Several technologies exist to uncover the polymorphisms in candidate genes. The PCR-RFLP test allows amplification and analysis of large number of individuals.
4) Analysis of associations between traits of interest and genotype for the candidate gene.
Several candidate gene analyses have been successfully conducted. For example, in pigs from PIC (Pig Improvement Company), there has been an increase in the rate of genetic response by up to 30% by incorporating the ESR genotype in selection indices for dam lines in nucleus herds. Also, PIC reduced mortalities of between 4-16 per 1000 head to near zero and improved meat quality in commercial products when they removal the Halothane stress gene (Rothschild and Plastow, 1999).
2.3. Candidate genes
2.3.1. Meat quality
technological i.e. the suitability to processing, storage and distribution (Nardone and Valfrè, 1999).
Pig meat quality is more important than for others animals because of its use in processed or technological products. The main characteristics of technological quality are the emulsifying capacity, from which depends on the stability of fat and meat emulsions; the preservation length, related to post-mortem pH, shear force and micro-organisms development; and water retention (Nardone and Valfrè, 1999). Molecular biology will allow to improve technological quality of meat, as well as chemical and organoleptic characteristics. Particularly, it may be possible to identify unfavorable alleles and then remove them or increase the favorable ones with selection.
2.3.1.1. Peroxisome proliferator – Activated receptor alpha (PPARA)
Perixisome proliferator activated receptors (PPARs) define a subfamily of nuclear hormone receptors, which regulate the transcription of genes involved in metabolism of lipids. They are nuclear hormone receptors that mediate the effects of fatty acids and their derivatives at the transcriptional level. To date, three mammalian PPAR subtypes have been isolated; termed PPARA (PPAR alpha), PPARD (PPAR delta) and PPARG (PPAR gamma). PPARs play important roles in lipid metabolism, which make them interesting as candidate genes for intramuscular fat (IMF) and other fat-related meat quality traits (Bocher et al., 2002).
role in regulating the catabolic pathway of lipids in response to a variety of compounds named peroxisome proliferators (PPs). Its expression, in mouse, is mainly detected in tissues exhibiting high rates of β-oxidation, i.e. in liver, kidney, heart and skeletal muscle where it promotes cellular uptake, activation and oxidation of fatty acids through activation of target gene expression. In contrast to rodents, in which PPARA is highly expressed in liver, in pig PPARA is highly expressed in adipose tissue and to a much lesser extent in liver and skeletal muscle (Ding et al., 2000).
The physiological response to peroxisome proliferators is species-dependent and in rats and mice this involves an increase in size and number of hepatic peroxisomes (peroxisome proliferation) that after sustained exposure leads to tumor growth in the liver. Importantly, humans treated with the fibrate drug, whose administration reduces the serum level of triglycerides and cholesterol, appear refractory to these pleitropic responses of PPs (Sundvold et al., 2001).
PPARA is involved in fatty acid oxidation by up-regulating the expression of the acyl-Coa oxidase and carnitine palmitoyltransferase enzymes (Ding et al., 2000). Recently, a missense mutation has been identified in the human exon 5 of PPARA gene resulting in the substitution of a leucine for a valine at codon 162. This mutation was associated with reduced adiposity and may be involved in the pathogenesis of obesity (Bossé et al., 2003).
differentiation such as tetradecanoylphorbol acetate topical application, hair plucking, or skin wound healing. PPARA is mainly involved in the early inflammation phase of the healing.
2.3.1.2. Peptide YY
The pancreatic polypeptide (PP) family consists of three peptides: pancreatic polypeptide, peptide tyrosine tyrosine (PYY), and neuropeptide tyrosine (NPY) and they are found both in the central nervous system and in peripheral tissue (Lundberg et al., 1982). PYY and pancreatic polypeptide are mainly found in gastrointestinal mucosa and pancreas and are involved in the control of digestive functions, while NPY is the most abundant neuropeptide present in the nervous systems. Many nutrients, hormones, growth factors, and neurotransmitters have been demonstrated to stimulate PYY release from mucosal endocrine cells in the distal intestine. Some studies have shown that bile acid, but not nutrients, plays a crucial role in the regulation of PYY secretion (Onaga et al., 2002).
The receptors belong to the large family of G protein-coupled receptors and are denoted as Y receptores subtypes (Y1, Y2, Y4, Y5, and Y6). This receptors bind all three peptides, but with different affinities (Balasubramaniam, 1997).
PYY has two molecular forms. The major molecular known as PYY 1-36,
consists of 36 amino acids. The secondary, truncated, molecular form is PYY 3-36,
2.3.2. Region of high growth
The study of mammalian growth-control genes is essential for elucidating the mechanism of growth at the tissue, organ, or whole-body level and the identification of quantitative trait loci (QTL) involved in the control of growth in the swine is of obvious importance. In mouse, the high growth (hg) mutation is a 460 Kb deletion of chromosome 10 which causes a 30-50% increase in growth in the homozygous animal without becoming obese (Bradford and Famula, 1984). In high-growth mice was observed that they have increased levels of plasma insulin-like growth factor I (IGF-I) and decreased levels of plasma and pituitary growth hormone (GH), suggesting that the causal mutation influences growth through deregulating the GH/IGF1 system (Horvat and Medrano, 2001). Animals with extreme body growth are often accompanied by poor reproductive performance. Cargill et al. (1999) suggest that the hypothalamic-pituitary unit of the high growth female provides an inadequate signal to the ovaries to maintain pregnancy and the luteal failure may be due to insufficient prolactin.
Studies with the mouse have shown that three genes, CASP2 and RIPKI domain containing adaptor with death domain (CRADD), suppressor of cytokine signaling-2, also known as Cish2 (SOCS2) and viral encoded semaphorin receptor (Vespr or Plexin C1 or PLXNC1), have been identified within this region of high growth (Wong et al., 2002). In the chicken, the CRADD gene was mapped on chromosome 1 in a potential growth QTL region and showed conserved synteny with regions of human chromosome 12 and mouse chromosome 10 (Smith et al., 2000).
bp upstream to PLXNC1 exon 3, resulting in the fusion of the two genes, SOCS2 exons 1-2 and PLXNC1 exons 3-20, and deletion of all CRADD gene in the high growth genome (Wong et al., 2002).
2.3.2.1. CRADD gene
CRADD is an adapter molecule that contains an aminoterminal CARD (Caspase Recruitment Domain) region and a carboxy-terminal “death domain”. It mediates the action of cysteine proteases involved in the apoptosis pathway (Duan and Dixit, 1997). The human death adaptor molecule CRADD shares a very high homology with the mouse CRADD gene. Therefore, possibly the increase in cell number observed in high growth is the result of alterations in the apoptosis pathway (Horvat and Medrano, 1998).
Also, CRADD interact with caspase-2 and the caspase-2 knockout mouse has an attenuated female germ cell apoptosis resulting in a significant increase in the number of primordial follicles in the postnatal ovary, which could be related to increase of ovulation rate in high growth females (Dilts et al., 1991). Overexpression of CRADD cDNA in 3T3L1 cell inhibited differentiation in mouse, suggesting that CRADD plays a role in controlling differentiation of mouse preadipocytes and, perhaps, in other cell types, in addition to its established role in apoptosis (Felmer et al., 2003).
2.3.2.2. SOCS2 gene
transcription (STAT) signal-transduction pathway (Greenhalgh et al., 2002). The suppressors of cytokine signaling (SOCS) proteins are a family of eight SH2 domain-containing proteins, comprising cytokine-inducible SH2 domain-containing protein (CIS) and SOCS-1-7. SOCS proteins operate as part of a classical negative feedback loop, in which activation of cytokine signaling leads to their expression. (Greenhalgh et al., 2002).
SOCS2 deficient animals exhibit accelerated post-natal growth resulting in a 30-50% increase in body weight by 12 weeks of age, significant increase in bone and body lengths, thickening of the skin due to collagen deposition, and increases in internal organ size due apparently from elevated cell numbers rather than increase cell size. SOCS2 is an essential down regulator of growth hormone (GH) signalling in vivo, and its absence leads to increase growth through increase production of IGF-1 (Metcalf et al., 2000) and SOCS2 regulates neuronal differentiation by inhibiting growth hormone signaling (Turnley et al., 2002).
Greenhalgh et al. (2002) produced mice that transgenically overexpress SOCS2 and find that this mouse did not have repressed growth and actually, significantly increase in a number of growth parameters. Also, they found that SOCS2 interacts with endogenous GH receptors in primary cells, and using synthesized peptides they observed that SOCS2 shows one site of interaction to Tyrisine 595 (Tyr595) of the GH receptor.
2.3.2.3. PLXNC1 gene
(Comeau et al., 1998). The extracellular domains of Plexin contain approximately 500 amino acid semaphorin domains. Semaphorins are implicated in cardiac and skeletal development, in the immune response, in the regulation of angiogenesis and in tumor growth and metastasis (Tamagnone et al., 1999).
The Plexins subfamily including four genes Plexin-A, -B, -C, and –D. The Plexin –A subfamily includes Plexin-A1, Plexin-A2, Plexin-A3 and Plexin-A4, whose genes are located on human chromosome 3, 1, X and 7, respectively. The Plexin-B subfamily includes Plexin –B1 (located on human chromosome 3), Plexin-B2 (human chromosome 22) and Plexin-B3 located on human chromosome X. The Plexin-C subfamily is defined by Plexin-C1 and the Plexin-D subfamily contains Plexin-D1 (located in human chromosome 3).
3. OBJECTIVES
4. MATERIALS AND METHODS
4.1. Animals
The experiment began in 1996 and animals F2 were born and collected in 1997 to 1999. The group of animals used in this study was a three-generation family of pigs generated by an intercross between two purebred Berkshire boars and nine purebred Yorkshire sows that were used to produce nine F1 litters. The boars were chosen from commercial boar studs and were mated artificially to sows from the Iowa State University Swine Breeding Farm. From the resulting F1 litters, 8 boars and 26 gilts were selected to produce the 525 F2 animals used in this study. A total of 65 matings were made to produce four sets of F2 offspring. The pigs were weighed at weekly intervals and sent to a commercial facility to be slaughtered when they reached approximately 110 kg. These breeds were chosen for their divergence in growth and body composition phenotypes. Details of the rearing and management procedures are described in Malek et al. (2001a, b).
4.2. Management
days and then a 20% protein complete feed for 3 weeks. This was changed to an 18% protein ration for another 2 - 3 weeks. When the pigs left the nursery, they were placed in pens that allowed for an average of eight sq. ft. per pig. The diet was changed to an 18.8% protein diet until the pig’s weight reached 34 kg on a pen average. At that time, the diet was changed to a 17.5% protein diet until pigs reached 72 kg, and then to a 16% protein diet until the pigs went to market. All diets were fortified with vitamins and minerals for the age of the pig. Water was provided ad libitum. The slaughter point was determined by weighing pigs at weekly intervals when they approached 110 kg.
4.3. Traits measured
For the research described in this thesis, body composition and meat quality were evaluated on the basis of 39 traits (Malek et al., 2001 a, b).
The traits measured on the live animal were: birth weight, 16 day weight, average daily gain from birth to weaning, and average daily gain on test from weaning to slaughter. After slaughter and chilling, carcass traits were evaluated at the plant by trained personnel according to National Pork Producers Council guidelines (NPPC, 1991). Traits recorded were carcass weight, carcass length, tenth rib back fat, lumbar back fat, last rib back fat, average back fat, and loin eye area.
Color also was evaluated objectively with a Minolta chromometer and a Hunter lab scan. Minolta and Hunter L values measure light reflectance of the muscle. Lower values indicate darker color, which is desirable, and higher values indicate paler, lighter colored meat. Color was measured at two locations: 1) at the Hormel slaughter plant in Austin, Minnesota at 24 hrs after slaughter and 2) at the Iowa Sate University Meat Laboratory in Ames 48 hrs after slaughter. All measurements were taken by trained personnel following the guidelines of the National Pork Producers Council (NPPC, 1991).
Other objective measurements were muscle pH, drip loss, water holding capacity, gycolytic potential, total lipid and muscle fiber type composition. Muscle pH was measured in the longissimus dorsi and the semimembranosus muscles at 24 hours after slaughter, using a glass penetration pH electrode.
Drip loss measures the amount of moisture (purge) lost from the product over a period of time. Drip loss was measured on a size-standardized sample from the longissimus dorsi (3 cm in diameter and 2.5 cm thick) (Honikel et al., 1986; Kauffman et al., 1986a) that was collected at 48 hours postmortem. The sample was weighed, suspended in a plastic bag, held at 4°C for 72 hours, and re-weighed at the end of the holding time. Drip loss was calculated as the percentage of product weight that was lost over the 72 hour storage period. This was done with duplicate samples and the average value was used for analysis.
the loin muscle 48 hours postmortem for three seconds to allow it to absorb surface moisture, and then re-weighed. The difference in weight was used as the measure of water holding capacity (Kauffman et al., 1986 a), with a lower value indicating that less moisture was lost from the tissue, which is more desirable.
To evaluate the sensory characteristics of the meat (juiciness, tenderness, chewiness, pork flavor, and off-flavor) was used a 10-point category scale. The scale was anchored on the left end with a term representing a low degree of juiciness, tenderness, chewiness, flavor, and off-flavor intensity. On the right end of the scale was a term representing a high degree of each characteristic. Any flavor that was not associated with normal pork flavor was considered as an off-flavor. The values for each pork chop were averaged across the three panelists.
For these sensory characteristics of the meat were taken a vacuum packaged boneless chops from the longissimus dorsi of each animal in 48 hours after slaughter and stored for 10 days at 4°C. Following the storage period, chops were broiled to 71°C in an electric oven broiler (Amana Model ARE 60) that had been preheated to 210°C. The temperature of each chop was monitored in the center of the chop using thermocouples (Chromega/Alomega) attached to an Omega digital thermometer (Model DSS-650, Omega Engineering).
of the sample height. Each chop was punctured 3 times and the average was recorded.
Sensory evaluation of the broiled chops was done using three highly-trained professional sensory panelists. Panelists were seated in individual booths with red lighting overhead to mask any differences in product color. Cubes, 1.3 cm in size, were removed from the center of the broiled loin chops, placed in preheated, individually-coded glass petri dishes and served to each panelist. Room temperature deionized, distilled water and unsalted crackers were used to cleanse the palates of the panelists between samples.
At 48 hours postmortem, a sub-sample of the loin was frozen and sent to the University of Illinois, where glycogen, free glucose, glucose-6-P, and lactate content were measured in µMol/g (Monin and Sellier, 1985). Postmortem metabolism of elevated glycogen stores results in increased production of lactate, which is a pH lowering by-product of muscle metabolism. Glycolytic potential is a measure of glycogen stores and was calculated as follows: glycolytic potential = 2 x ([glycogen] + [glucose] + [glucose-6-phosphate]) + [lactate] (Monin and Sellier, 1985; Maribo et al., 1999). Glycolytic potential is expressed in µMol lactate equivalents per gram muscle wet weight. In addition to glycolytic potential and lactate concentration, residual glycogen concentration was used as a trait of interest in this study.
Muscle fiber type composition was evaluated in 48-hour postmortem samples from the longissimus dorsi by separation of myosin isoforms on high porosity SDS-PAGE gels. The procedure used was as described by Talmadge and Roy (1993) but with modifications as described by Huff-Lonergan et al., (2002). Results were expressed as the ratio of the density of the II a b and of myosin to the density of the IIb band within a sample. Porcine diaphragm muscle (extracted as described in Huff-Lonergan et al., 2002) was used as a standard on each gel to aid in identifying the myosin isoforms. Diaphragm muscle contains primarily type IIa, IIx, and type I associated myosin isoforms (Talmadge and Roy, 1993).
See Table 1 and 2 in Appendix for more details of the traits.
4.4. Candidate genes, primer sequences, PCR conditions and polymorphisms
The gene nomenclature and the gene symbol used in this work follow the rules developed by the HUGO / GDB nomenclature committee (http://www.gene.ucl.ac.uk/nomenclature).
PPARA primers were designed in exon 4 (PP1F) and exon 5 (PP1R) from a published porcine partial cDNA sequence (GenBank accession no. AF228696).
For the PYY gene, a consensus primer (PY1F and PY1R) was designed in conserved regions among the human, mouse and bovine PYY gene sequences (GenBank accession nos. NM_004160, NM145435, and L37369, respectively).
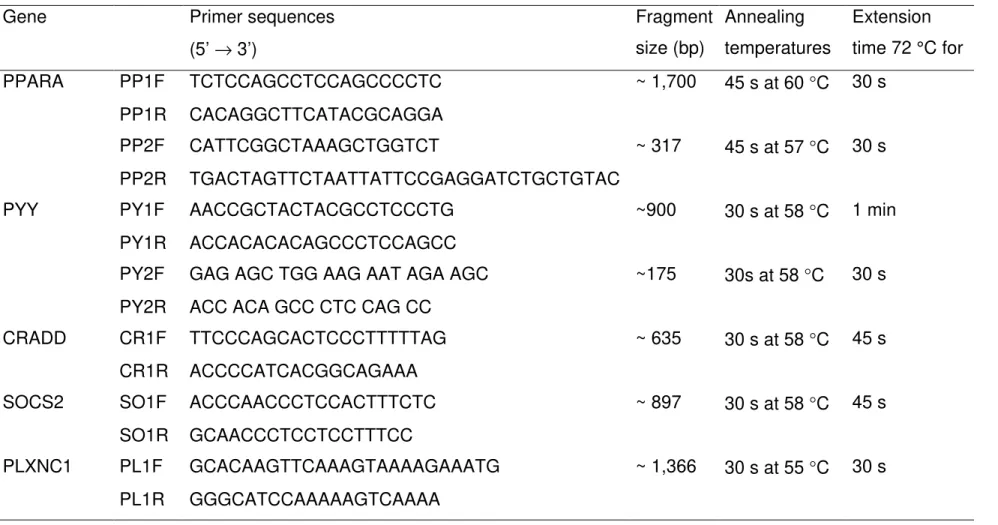
Table 1. PCR primers, fragment size (bp) and amplification conditions
Gene Primer sequences
(5’ → 3’)
Fragment size (bp)
Annealing temperatures
Extension time 72 °C for
PPARA PP1F TCTCCAGCCTCCAGCCCCTC ~ 1,700 45 s at 60 °C 30 s
PP1R CACAGGCTTCATACGCAGGA
PP2F CATTCGGCTAAAGCTGGTCT ~ 317 45 s at 57 °C 30 s
PP2R TGACTAGTTCTAATTATTCCGAGGATCTGCTGTAC
PYY PY1F AACCGCTACTACGCCTCCCTG ~900 30 s at 58 °C 1 min
PY1R ACCACACACAGCCCTCCAGCC
PY2F GAG AGC TGG AAG AAT AGA AGC ~175 30s at 58 °C 30 s PY2R ACC ACA GCC CTC CAG CC
CRADD CR1F TTCCCAGCACTCCCTTTTTAG ~ 635 30 s at 58 °C 45 s
CR1R ACCCCATCACGGCAGAAA
SOCS2 SO1F ACCCAACCCTCCACTTTCTC ~ 897 30 s at 58 °C 45 s
SO1R GCAACCCTCCTCCTTTCC
The PCR reactions were performed using 12.5 ng of porcine DNA, 1x PCR buffer, 1.25 mM MgCl2 (PP1F and PP1R), 1.0 mM MgCl2 (PP2F and PP2R), 0.75
mM MgCl2 (PY1F and PY1R), 1.5 mM MgCl2 (CRADD and PLXNC1) and 1.0 mM
MgCl2 (SOCS2), 0.125 mM dNTPs, 0,3 µM of each primer, and 0.5 U Taq DNA
polymerase (Promega, Madison, WI, USA) in a 10 µL final volume. The PCR profile included 4 min at 94 °C; 35 cycles of 45 s at 94 °C. Annealing temperatures (TA) and extension time specific for each primer in Table 1, and 45 s at 72 °C (CRADD and SOCS2) or 30 s (PLXNC1); and a final 7 min extension at 72 °C in a PTC200 (MJ Research, Inc., Watertown, MA, USA). Primer sequences, fragment sizes, annealing temperatures and extension time are given in Table 1.
The PCR products from several individuals from several commercial breeds of pigs were directly sequenced. The sequences were analyzed with Sequencher software (Gene Codes Corporation, version 4.0.5, Ann Arbor, MI) to identify polymorphisms. Sequences were compared with human sequence for similarity.
Table 2. Primer, Polymorphism locations, restriction enzymes, size of the allelic polymorphisms.
Primer Polymorphism locations Restriction enzymes Size of the allelic polymorphisms
PP2F and PP2R Intron 4 BsrGI 317-bp (allele 1), or 286
and 31-bp (allele 2)
PY2F and PY2R 3’ UTR Hinf I 175bp (allele 1), or 105
and 70 bp (allele 2)
CR1F and CR1R 5’UTR AvaI 635, 470 and 165
SO1F and SO1R intron 2 SacII 439, 262 (all genotypes)
and 196 (only 12 and 22)
PL1F and PL1R intron 26 MscI 1158 (11 and 12
4.5. Linkage mapping and statistical analysis
The candidate genes were mapped to the Berkshire x Yorkshire family linkage map using the CRIMAP (version 2.4) mapping program (Green et al., 1990).
An analysis of variance procedure was used to test associations of candidate gene polymorphisms with meat quality and body composition traits using the SAS general linear model computer program (SAS/STAT, 1990). The traits were tested using a mixed-model, which included the fixed effects of sex, slaughter date, genotype and the random effect of dam. Sire was not used as it was confounded with slaughter date.
Live weight at slaughter was added in the model as a covariate for average backfat, tenth rib backfat, lumbar backfat, last rib backfat, loin eye area, carcass weight, carcass length, total lipid, marbling, and cholesterol.
For the traits average glycogen, average glycolytic potential and average lactate the Rendiment of Napole (RN) gene was added to the model as a fixed effect.
5. RESULTS
5.1. Identification of polymorphisms and linkage mapping
5.1.1. Meat quality genes
The 1,700-bp product from PP1F and PP1R was sequenced and the sequence revealed 85% and 87% exonic nucleotide identity to the corresponding human and mouse sequences of PPARA gene, respectively. Sequence analysis of the PCR products from several individual pigs of different breeds detected an intronic nucleotide substitution. A restriction enzyme that would recognize this substitution was not found. Thus, a restriction site was created using a mismatch primer that created a recognition site for the enzyme BsrGI (PP2F and PP2R). The PCR fragment from these primers was 317 bp and spanned intron 4 and exon 5. The porcine PPARA genomic sequence has been submitted to GenBank (accession no.AY344366).
The PPARA gene was significantly linked with several markers on porcine chromosome 5 (SSC5). For SSC5, no QTL was detected near the PPARA locus in the Berkshire and Yorkshire crossed family. Two-point linkage analysis determined that the most closely linked markers (recombination fraction and LOD score) were ACR (0.06, 21.77) and SW413 (0.10, 15.02). The best map order for PPARA produced by multipoint linkage analysis with other linked markers (with distances in centimorgans listed between markers) was:
The porcine sequence from PY1F and PY1R was identified as the porcine PYY gene spanning exons 2 and the 3’ UTR and showed 86% and 76% exonic identity to the corresponding human and bovine PYY sequences, respectively. Sequence analysis of the PCR products from several individual pigs of different breeds detected a 3’ UTR nucleotide substitution, which is a recognition site for the enzyme Hinf I. The porcine PYY sequence has been submitted to GenBank (accession no. AY344365). Using this sequence, pig specific primers, PY02F and PY02R, were designed to amplify a 175 bp product.
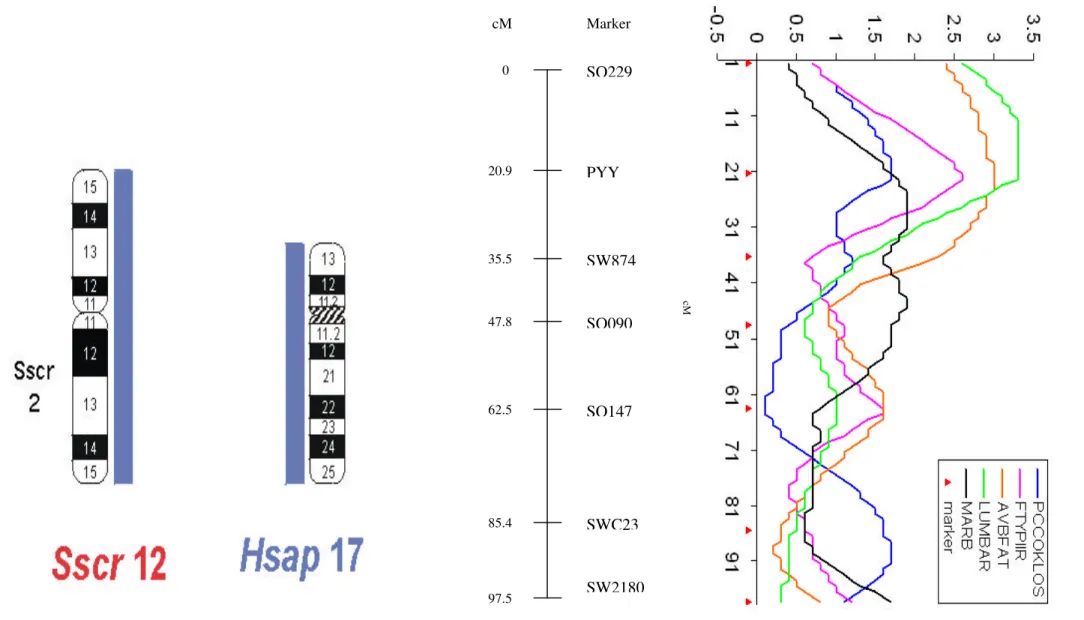
The porcine PYY gene was assigned to chromosome 12 (P=1.00) and the p11- (2/3 p13) region (P= 0.89) by PCR analysis of a pig-rodent somatic cell hybrid panel (Yerle et al., 1996).
Two-point and multipoint linkage analyses were performed using CRIMAP 2.4 against other genotypes in the Iowa State Berkshire x Yorkshire resource population. Most significant linkage between the PYY gene and other markers were obtained with microsatellites S0229 (recombination fraction = 0.19 and LOD = 41.17) and SW874 (recombination fraction = 0.13 and LOD = 59.93) on chromosome 12. The best map order for the PYY gene produced by multipoint linkage analyses with other linked markers was (with distances between markers in centimorgans): S0229 – 20.9 – PYY- 14.6 - SW874 – 12.3 – S0090 – 14.7 – S0147 – 22.9 – SWC23 – 12.2 - SW2180. In Figure 1 is shown the QTL analyses and the comparative mapping between human chromosome 17 and swine 12.
5.1.2. High growth genes
previously submitted mRNA of the human CRADD gene. Sequencing PCR products of several individual pigs of different breeds showed one nucleotide substitution in the 5’ UTR situated within an AvaI restriction enzyme recognition site.
The SOCS2 primers amplified a fragment of approximately 897 bp, which spanned exon 2 and exon 3, and this product after sequencing showed 88% of similarity to the previously submitted mRNA of the human SOCS2 gene. Sequencing PCR products of several individual pigs of different breeds showed one nucleotide substitution in the intron 2 situated within a SacII restriction enzyme recognition site.
For PLXNC1 the primers amplified a fragment of approximately 1,366 bp and spanned exon 26 and exon 27. The PCR product was sequenced and the sequence showed 91% of similarity to the previously submitted mRNA of the human Plexin gene. Comparing several sequences of different pig breeds revealed one nucleotide substitution situated within a MscI restriction enzyme recognition site in the intron 26 of this gene.
A single nucleotide polymorphism (SNP) was discovered for each gene and confirmed by enzyme for all of the genes. The enzyme, the fragments sizes are presented in Table 2.
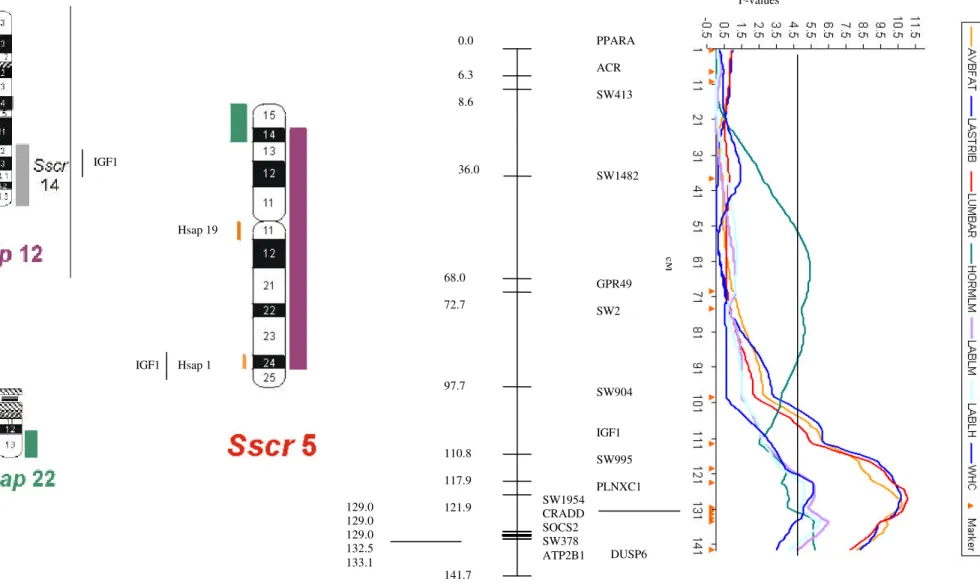
and there are not recombination fraction between CRADD, SOCS2 and the marker SW1954 (Figure 1).
Figure 1. Comparative physical and linkage map of pig chromosome12 with human chromosome 17 and QTL analyses on pig chromosome 12. The shared regions summarize previous results of chromosomal painting.
SO229
SW874 PYY
SO090
SO147
SWC23
SW2180
0
20.9
35.5
47.8
62.5
85.4
97.5 cM
F-values
cM
Figure 2. Comparative physical and linkage map of pig chromosome 5 with human chromosomes 12 and 22 and QTL analyses on pig chromosome 5. The shaded regions summarize previous results of chromosomal painting.
cM IGF1 IGF1 Hsap 19 Hsap 1 F-values 6.3 8.6 36.0 68.0 72.7 97.7 110.8 117.9 121.9 129.0 129.0 129.0 132.5 133.1 141.7 0.0 cM SW1954 CRADD SOCS2 SW378
ATP2B1 DUSP6
5.2. Berkshire x Yorkshire F2 association study
5.2.1. Meat quality genes
Frequencies of Allele 1 in the Berkshire and Yorkshire grandparents were 0.25 and 0.22 for PPARA, and 1.00 and 0.33 for PYY. The frequency of allele 1 in the total F2 Berkshire x Yorkshire population was 0.17 for PPARA, and 0.73 for PYY.
Some significant associations were found between the genotypes of candidate genes and meat quality phenotypes (Table 3 and 4).
There were significant effects of PPARA genotypes on birth weight and average drip loss (p<0.05), and loin eye area (p<0.1). Animals 11 had higher birth weight and loin eye area, and smaller drip loss. Also, a low significance was observed for cholesterol, hormel loin Hunter, average lactate, and average glycolytic potential (p<0.20). Animals 22 had higher cholesterol level and hormel loin Hunter while genotypes 11 had the lowest amount of average glycolytic potential and average lactate.
Table 3 - Association results of PPARA gene with phenotypes in a Berkshire x Yorkshire pig population. The number of animals is in parenthesis.
TRAIT PPARA Genotype
11 12 22 Pr > F
Average back fat (cm) (AVBFAT) 3.19±0.20 (10) 3.30±0.06 (156) 3.25±0.05 (339) 0.6796
Carcass weight (kg) (CARCWT) 87.15±0.88 (10) 87.39±0.23 (156) 87.05±0.18 (339) 0.3734
Last rib back fat (cm) (LASTRIB) 3.27±0.21 (10) 3.17±0.06 (156) 3.13±0.05 (339) 0.6853
Loin eye area (cm2) (LEA)
37.24±1.79 (10) 36.66±0.65 (156) 35.61±0.57 (339) 0.0959
Carcass Length (cm)(LENGTH) 83.72±0.79 (10) 84.06±0.20 (156) 84.19±0.15 (339) 0.7226
Lumbar back fat (cm) (LUMBAR) 3.42±0.25 (10) 3.59±0.07 (156) 3.52±0.06 (339) 0.5780
Tenth rib back fat (cm) (TENTHRIB) 2.93±0.24 (10) 3.11±0.07 (156) 3.10±3.10 (339) 0.7722
Average daily gain to weaning (kg)
(ADGWT) 0.20±0.02 (10) 0.23±0.01 (156) 0.24±0.01 (338) 0.4287
Average daily gain on test (kg)
(AGDTEST) 0.66±0.02 (10) 0.68±0.01 (156) 0.69±0.01 (338) 0.2033
Birth weight (kg) (BIRTHWT) 1.65±0.11 (10) 1.48±0.04 (156) 1.55±0.04 (338) 0.0416
16 day weight (kg) (SIXTHEWT) 4.47±0.46 (10) 4.87±0.16 (156) 4.98±0.14 (338) 0.4524
Cholesterol (mg/100g) (CHOLES) 53.91±2.71 (10) 58.16±0.68 (156) 58.90±0.52 (339) 0.1353
Marbling (MARB) 3.37±0.25 (10) 3.67±0.07 (156) 3.68±0.06 (339) 0.4670
Total lipid (%) (TOTLIPPR) 3.30±0.44 (10) 3.11±0.16 (156) 3.09±0.14 (339) 0.8797
Average drip loss (%) (AVDRIPPR) 4.18±0.70 (10) 6.01±0.18 (156) 5.68±0.14 (338) 0.0161
Color (COLOR) 3.49±0.18 (10) 3.27±0.04 (156) 3.23±0.03 (338) 0.3165
Firmness (FIRM) 3.56±0.23 (10) 3.44±0.05 (153) 3.36±0.04 (334) 0.3534
Fiber type I (FTYPI) 0.11±0.05 (10) 0.07±0.01 (153) 0.08±0.01 (334) 0.8046
Fiber type II ratio (FTYPIIR) 0.57±0.30 (10) 1.03±0.07(153) 1.03±0.05 (334) 0.3184
Ham Hunter (HAMH) 41.08±0.22 (10) 41.24±0.29 (156) 41.74±0.21 (338) 0.2991
Ham Minolta (HAMM) 16.87±1.03 (10) 17.15±0.24 (156) 17.55±0.18 (338) 0.3211
Ham pH (HAMPH) 5.88±0.07 (10) 5.89±0.01 (156) 5.89±0.01 (338) 0.9722
Hormel loin Hunter (HORMLH) 42.15±1.81 (10) 44.39±0.61(156) 45.03±0.53 (338) 0.1622
Hormel loin Minolta (HORMLM) 20.96±1.65 (10) 21.65±0.46 (156) 21.02±0.37 (338) 0.3850
Hormel loin pH (HORMLPH) 5.78±0.06 (10) 5.77±0.01 (156) 5.76±0.01 (338) 0.8519
Lab Loin Hunter (LABLH) 44.96±1.26 (10) 46.93±0.33 (156) 46.98±0.25 (338) 0.2763
Lab loin Minolta (LABLM) 20.23±1.20 (10) 22.10±0.31(156) 22.05±0.23 (338) 0.3049
Lab loin pH (LABLPH) 5.89±0.06 (10) 5.82±0.01 (156) 5.81±0.01 (338) 0.5422
Water holding capacity (g) (WHC) 0.16±0.04 (10) 0.20±0.01 (156) 0.19±0.01 (338) 0.6141
Average Instron force (kg)
(AVINSFOR) 4.49±0.30 (10) 4.38±0.08 (153) 4.51±0.06 (334) 0.3077
Chew score (CHEWSCR) 2.74±0.35 (10) 2.52±0.09 (153) 2.41±0.06 (334) 0.3958
Flavor score (FLAVSCR) 2.45±0.60 (10) 2.70±0.14 (153) 2.89±0.10 (334) 0.4407
Juiciness score (JUICSCR) 6.15±0.53 (10) 6.03±0.12 (153) 6.04±0.08 (334) 0.9728
Off Flavor score (OFFLAVSC) 1.72±0.70 (10) 1.48±0.17 (153) 1.46±0.12 (334) 0.9343
Percent cooking loss (%)
(PCCOKLOS) 18.02±1.55 (10) 18.72±0.35 (153) 18.70±0.24 (334) 0.9047
Tenderness score (TENDSCR) 7.55±0.46 (10) 7.78±0.11 (153) 7.85±0.08 (334) 0.7122
Average glycogen (µmol/g) (AVGGG) 7.64±1.19 (10) 8.99±0.27 (155) 8.75±0.19 (335) 0.4569
Average glycolytic potential (µmol/g)
(AVGP) 98.60±6.12 (10) 106.75±1.51 (155) 104.23±1.10 (335) 0.1772
Table 4 - Association results of PYY gene with phenotypes in a Berkshire x Yorkshire pig population. The number of animals is in parenthesis.
TRAIT PYY Genotype
11 12 22 Pr > F
Average back fat (cm) (AVBFAT) 3.23±0.05 (254) 3.30±0.06 (206) 3.41±0.09 (43) 0.0878
Carcass weight (kg) (CARCWT) 87.10±0.19 (254) 87.27±0.20 (206) 87.18±0.38 (43) 0.7381
Last rib back fat (cm) (LASTRIB) 3.12±0.05 (254) 3.18±0.05 (206) 3.24±0.09 (43) 0.2848
Loin eye area (cm2) (LEA) 36.00
±0.59 (254) 36.01±0.62 (206) 35.25±0.89 (43) 0.5868
Carcass Length (cm) (LENGTH) 84.13±0.16 (254) 84.20±0.17 (206) 84.01±0.34 (43) 0.8427
Lumbar back fat (cm) (LUMBAR) 3.49±0.06 (254) 3.60±0.07(206) 3.77±0.11(43) 0.0181
Tenth rib back fat (cm) (TENTHRIB) 3.07±0.07 (254) 3.13±0.07 (206) 3.22±0.11 (43) 0.3392
Average daily gain to weaning (kg)
(ADGWT) 0.24±0.01 (254) 0.23±0.01 (205) 0.22±0.01 (43) 0.4086
Average daily gain on test (kg)
(AGDTEST) 0.69±0.01 (254) 0.69±0.01 (205) 0.68±0.01 (43) 0.2756
Birth weight (kg) (BIRTHWT) 1.54±0.04 (254) 1.54±0.04 (205) 1.48±0.05 (43) 0.3849
16 day weight (kg) (SIXTHEWT) 5.00±0.14 (254) 4.90±0.14 (205) 4.70±0.22 (43) 0.2939
Cholesterol (mg/100g) (CHOLES) 58.97±0.53 (254) 58.32±0.59 (206) 58.07±1.17 (43) 0.5366
Marbling (MARB) 3.70±0.07 (254) 3.61±0.07 (206) 3.96±0.12(43) 0.0064
Total lipid (%) (TOTLIPPR) 3.12±0.15 (254) 3.02±0.16 (206) 3.41±0.23(43) 0.1239
Average drip loss (%) (AVDRIPPR) 5.74±0.15 (254) 5.83±0.16 (205) 5.84±0.31 (43) 0.8359
Color (COLOR) 3.23±0.03 (254) 3.28±0.04 (205) 3.28±0.08 (43) 0.4528
Firmness (FIRM) 3.41±0.05 (254) 3.33±0.05(203) 3.55±0.10(43) 0.0728
Fiber type I (FTYPI) 0.082±0.01 (250) 0.08±0.01 (203) 0.08±0.02 (42) 0.9842
Fiber type II ratio (FTYPIIR) 1.05±0.06 (250) 0.97±0.06(203) 1.20±0.13(42) 0.1872
Ham Hunter (HAMH) 41.85±0.23 (254) 41.39±0.26 (205) 40.90±0.52(43) 0.1172
Ham Minolta (HAMM) 17.62±0.20 (254) 17.28±0.22 (205) 16.88±0.44 (43) 0.1695
Ham pH (HAMPH) 5.89±0.01 (254) 5.882±0.01 (205) 5.93±0.03 (43) 0.4454
Hormel loin Hunter (HORMLH) 44.98±0.55 (254) 44.77±0.57 (205) 43.82±0.87 (43) 0.3298
Hormel loin Minolta (HORMLM) 21.30±0.39 (254) 21.032±0.42 (205) 21.712±0.74 (43) 0.5780
Hormel loin pH (HORMLPH) 5.77±0.01 (254) 5.75±0.01 (205) 5.79±0.03 (43) 0.3680
Lab Loin Hunter (LABLH) 46.92±0.27 (254) 46.94±0.29 (205) 47.30±0.55 (43) 0.7894
Lab loin Minolta (LABLM) 21.99±0.25 (254) 22.07±0.27 (205) 22.54±0.52 (43) 0.5945
Lab loin pH (LABLPH) 5.82±0.01(254) 5.82±0.01 (205) 5.82±0.03 (43) 0.9477
Water holding capacity (g) (WHC) 0.19±0.01 (254) 0.22±0.01(204) 0.21±0.02(43) 0.0160 Average Instron force (kg)
(AVINSFOR) 4.50±0.07 (250) 4.45±0.07 (203) 4.44±0.14 (42) 0.7612
Chew score (CHEWSCR) 2.44±0.07 (250) 2.46±0.08 (203) 2.54±0.15 (42) 0.8126
Flavor score (FLAVSCR) 2.94±0.11 (250) 2.66±0.13 (203) 2.81±0.26 (42) 0.1787
Juiciness score (JUICSCR) 6.03±0.09 (250) 6.10±0.106 (203) 5.93±0.22 (42) 0.7380
Off Flavor score (OFFLAVSC) 1.57±0.13 (250) 1.32±0.15 (203) 1.55±0.30 (42) 0.3204
Percent cooking loss (%)
(PCCOKLOS) 19.01±0.27 (250) 18.40±0.31 (203) 18.21±0.66 (42) 0.2239
Tenderness score (TENDSCR) 7.83±0.09 (250) 7.84±0.10 (203) 7.72±0.20 (42) 0.8332
Average glycogen (µmol/g) (AVGGG)
8.63±0.21 (253) 8.89±0.24(204) 9.75±0.52(41) 0.1146
Average glycolytic potential (µmol/g) (AVGP)
103.77±1.20 (253) 105.94±1.35 (204) 109.07±2.67(41) 0.0985
5.2.2. High growth genes
Frequencies of allele 1 in the Berkshire and Yorkshire grandparents were 0.75 and 0.67 for CRADD, 0.75 and 0.33 for S0CS2, and 1.00 and 0.78 for PLXNC1. The frequency of allele 1 in the total F2 Berkshire x Yorkshire population was 0.75 for CRADD, 0.58 for S0CS2, and 0.89 for PLXNC1.
Many significant associations were found between the genotype of candidate genes and meat quality phenotypes in the Berkshire x Yorkshire family (Table 5, 6 and 7).
There were significant effects of CRADD genotypes on total lipid (p<0.001), average daily gain on test and fiber type I (p<0.05), and lumbar back fat, flavor score, and marbling (p<0.10). Animals 11 had smaller total lipid, fiber type I, lumbar back fat, and marbling. Animals with genotypes 22 had smaller average daily gain on test and flavor score. The average back fat, last rib back fat, average instron force, and off flavor score were also nearly significant (p<0.20). Animals 11 had smaller average back fat and last rib back fat, and genotypes 22 had highest average instron force, and off flavor score.
Association analyses with SOCS2 genotypes showed significant effects on 16 day test (p<0.01), average daily gain to weaning, fiber type II ratio (p<0.05) and average glycogen (p<0.1). Animals 22 had higher 16 day weight and daily gain to weaning, and smaller fiber type II and average glycogen. The average back fat and carcass weight showed nearly significant effects (p<0.20). Animals 22 had smaller average back fat and carcass weight.
Minolta. Also, nearly significant effects was found for ham pH and hormel loin Hunter (p<0.20). Animals 22 had higher amount of hormel loin Hunter and smaller ham pH.
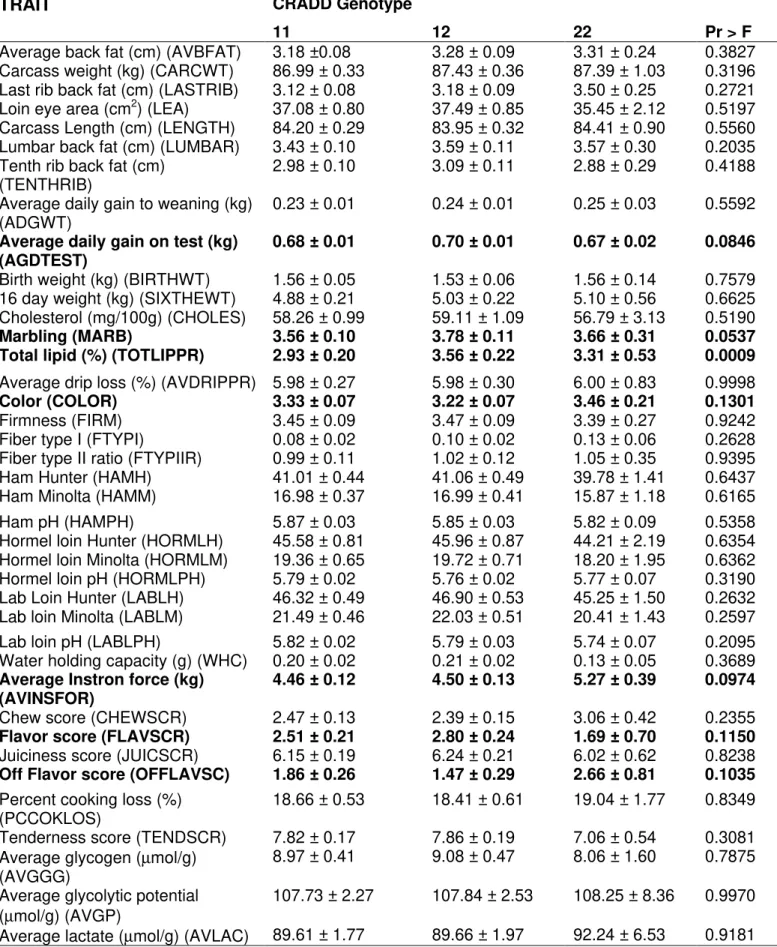
An analysis including all three genes as fixed effects (Table 8, 9 and 10) revealed significant effects for CRADD genotypes on total lipid (p<0.001), average daily gain on test, marbling and average instron force (p<0.1). Animals 11 had smaller total lipid and marbling, while animals with genotypes 22 had smaller average daily on test and average instron force. Also nearly significant effects for color, flavor score and off flavor score (p<0.20). Animals 22 had higher score of color and off flavor score, and smaller flavor score.
The SOCS2 genotypes showed significant effects on 16 day test, average daily gain to weaning and average glycogen (p<0.05), color and carcass weight (p<0.1). Animals 22 had higher 16 day weight, average daily gain to weaning, and lower average glycolytic, carcass weight and color. Also, nearly significant effects for fiber type II ratio, chew score and tenderness score (p<0.20). Animals 11 had higher chew score and fiber type II ratio and smaller tenderness score.
Table 5 - Association results of CRADD gene with phenotypes in a Berkshire x Yorkshire pig population. The number of animals is in parenthesis.
TRAIT CRADD Genotype
11 12 22 Pr > F
Average back fat (cm) (AVBFAT) 3.22±0.05 (270) 3.34±0.06 (228) 3.37±0.22 (7) 0.1840
Carcass weight (kg) (CARCWT) 87.06±0.20 (270) 87.32±0.22 (228) 87.12±0.93 (7) 0.6107
Last rib back fat (cm) (LASTRIB) 3.11±0.05 (270) 3.20±0.05 (228) 3.47±0.22 (7) 0.1801
Loin eye area (cm2) (LEA) 35.86±0.62 (270) 36.14±0.65 (228) 33.22±1.96 (7) 0.2903
Carcass Length (cm) (LENGTH) 84.21±0.17 (270) 84.09±0.18 (228) 83.79±0.82 (7) 0.7952
Lumbar back fat (cm) (LUMBAR) 3.47±0.06 (270) 3.66±0.07 (228) 3.55±0.27 (7) 0.0635
Tenth rib back fat (cm) (TENTHRIB) 3.06±0.07 (270) 3.17±0.07 (228) 3.09±0.26 (7) 0.3986
Average daily gain to weaning (kg)
(ADGWT) 0.24±0.01(271) 0.23±0.01 (228) 0.24±0.03 (7) 0.9869
Average daily gain on test (kg) (AGDTEST)
0.68±0.01 (271) 0.70±0.01 (228) 0.670±0.03 (7) 0.0318
Birth weight (kg) (BIRTHWT) 1.55±0.03 (271) 1.51±0.04 (228) 1.53±0.12 (7) 0.6373
16 day weight (kg) (SIXTHEWT) 4.97±0.15 (271) 4.93±0.16 (228) 4.97±0.50 (7) 0.9677
Cholesterol (mg/100g) (CHOLES) 58.26±0.56 (270) 59.20±0.62 (228) 57.00±2.81 (7) 0.3861
Marbling (MARB) 3.60±0.07 (270) 3.79±0.07 (228) 3.86±0.27 (7) 0.0707
Total lipid (%) (TOTLIPPR) 2.84±0.16 (270) 3.45±0.17 (228) 3.28±0.49 (7) 0.0006
Average drip loss (%) (AVDRIPPR) 5.79±0.15 (271) 5.78±0.17 (228) 5.70±0.74 (7) 0.9937
Color (COLOR) 3.27±0.03 (271) 3.22±0.04 (228) 3.51±0.19 (7) 0.2270
Firmness (FIRM) 3.37±0.05 (271) 3.42±0.05 (227) 3.29±0.24 (7) 0.6523
Fiber type I (FTYPI) 0.07±0.01 (264) 0.10±0.01 (227) 0.16±0.05 (7) 0.0275
Fiber type II ratio (FTYPIIR) 0.99±0.06 (264) 1.08±0.06 (227) 0.95±0.31 (7) 0.6062
Ham Hunter (HAMH) 41.58±0.23 (271) 41.65±0.26 (228) 40.05±1.2 (7) 0.4516
Ham Minolta (HAMM) 17.43±0.20 (271) 17.46±0.22 (228) 16.07±1.1 (7) 0.4273
Ham pH (HAMPH) 5.90±0.01 (271) 5.89±0.01 (228) 5.85±0.07 (7) 0.7798
Hormel loin Hunter (HORMLH) 44.74±0.59 (271) 44.92±0.63 (228) 43.16±1.99 (7) 0.6454
Hormel loin Minolta (HORMLM) 21.08±0.42 (271) 21.42±0.46 (228) 19.93±1.77 (7) 0.5933
Hormel loin pH (HORMLPH) 5.78±0.01 (271) 5.75±0.01 (228) 5.74±0.06 (7) 0.2804
Lab Loin Hunter (LABLH) 46.77±0.28 (271) 47.21±0.31 (228) 45.78±1.33 (7) 0.3287
Lab loin Minolta (LABLM) 21.87±0.27 (271) 22.31±0.30 (228) 20.86±1.27 (7) 0.2950
Lab loin pH (LABLPH) 5.83±0.01 (271) 5.81±0.01 (228) 5.76±0.06 (7) 0.3630
Water holding capacity (g) (WHC) 0.20±0.01 (271) 0.20±0.01 (228) 0.14±0.05 (7) 0.4313
Average Instron force (kg) (AVINSFOR)
4.47±0.07 (251) 4.47±0.07 (214) 5.16±0.34 (6) 0.1280
Chew score (CHEWSCR) 2.45±0.07 (270) 2.43±0.08 (218) 2.86±0.37 (7) 0.5185
Flavor score (FLAVSCR) 2.68±0.11 (270) 3.04±0.13 (218) 2.50±0.62 (7) 0.0698
Juiciness score (JUICSCR) 6.02±0.09 (270) 6.08±0.11 (218) 6.08±0.53 (7) 0.9183
Off Flavor score (OFFLAVSC) 1.61±0.14 (270) 1.28±0.16 (218) 2.17±0.73 (7) 0.1513
Percent cooking loss (%)
(PCCOKLOS) 18.75±0.26 (270) 18.66±0.31 (218) 19.09±1.56 (7) 0.9475
Tenderness score (TENDSCR) 7.85±0.09 (270) 7.82±0.10 (218) 7.39±0.47 (7) 0.6417
Average glycogen (µmol/g) (AVGGG) 8.85±0.21 (268) 8.77±0.24 (225) 8.05±1.39 (7) 0.8320
Average glycolytic potential (µmol/g) (AVGP)
104.94±1.26 (268) 105.00±1.42 (225) 102.13±7.27 (7) 0.9254
Table 6 - Association results of SOCS2 gene with phenotypes in a Berkshire x Yorkshire pig population.
The number of animals is in parenthesis.
SOCS2 genotype
TRAIT 11 12 22 Pr > F
Average back fat (cm) (AVBFAT) 3.31±0.06 (161) 3.28±0.06 (255) 3.16±0.08 (10) 0.1930
Carcass weight (kg) (CARCWT) 86.99±0.23 (161) 87.35±0.19 (255) 86.89±0.29 (10) 0.1533
Last rib back fat (cm) (LASTRIB) 3.19±0.06 (161) 3.16±0.05 (255) 3.05±0.07 (10) 0.2663
Loin eye area (cm2) (LEA) 35.67±0.64 (161) 35.90±0.59 (255) 36.59±0.73 (10) 0.4089
Carcass Length (cm) (LENGTH) 84.26±0.20 (161) 84.10±0.16 (255) 84.17±0.25 (10) 0.7458
Lumbar back fat (cm) (LUMBAR) 3.60±0.08 (161) 3.54±0.07 (255) 3.43±0.09 (10) 0.2309
Tenth rib back fat (cm)
(TENTHRIB) 3.13±0.08 (161) 3.12±0.07 (255) 2.99±0.09 (10) 0.3000
Average daily gain to weaning (kg) (ADGWT)
0.22±0.01 (162) 0.24±0.01(255) 0.25±0.01(10) 0.0109
Average daily gain on test (kg)
(AGDTEST) 0.69±0.01 (162) 0.68±0.01 (255) 0.69±0.01 (10) 0.2562
Birth weight (kg) (BIRTHWT) 1.51±0.04 (162) 1.55±0.04 (255) 1.56±0.05 (10) 0.3419
16 day weight (kg) (SIXTHEWT) 4.69±0.16 (162) 4.99±0.15(255) 5.26±0.19(10) 0.0084
Cholesterol (mg/100g) (CHOLES) 58.87±0.69 (161) 58.47±0.56 (255) 58.53±0.87 (10) 0.8660
Marbling (MARB) 3.67±0.08 (161) 3.68±0.07 (255) 3.70±0.09 (10) 0.9572
Total lipid (%) (TOTLIPPR) 3.08±0.16 (161) 3.10±0.15 (255) 3.10±0.18 (10) 0.9958
Average drip loss (%)
(AVDRIPPR) 5.83±0.19 (162) 5.87±0.15 (255) 5.51±0.23 (10) 0.3434
Color (COLOR) 3.30±0.04 (162) 3.25±0.03 (255) 3.19±0.06 (10) 0.3059
Firmness (FIRM) 3.40±0.06 (160) 3.40±0.05 (255) 3.36±0.07 (10) 0.8514
Fiber type I (FTYPI) 0.09±0.01 (160) 0.08±0.01 (250) 0.07±0.02 (9) 0.5785
Fiber type II ratio (FTYPIIR) 1.14±0.07 (160) 1.04±0.06(250) 0.84± 0.10(9) 0.0405
Ham Hunter (HAMH) 41.57±0.30 (162) 41.63±0.24 (255) 41.51±0.38 (10) 0.9545
Ham Minolta (HAMM) 17.39±0.25 (162) 17.48± 0.20 (255) 17.31±0.32 (10) 0.8671
Ham pH (HAMPH) 5.90±0.02 (162) 5.88±0.01 (255) 5.92±0.02 (10) 0.3829
Hormel loin Hunter (HORMLH) 44.78±0.62 (162) 44.86±0.57 (255) 44.74±0.72 (10) 0.9752
Hormel loin Minolta (HORMLM) 21.24±0.47 (162) 21.32± 0.40 (255) 21.12±0.57 (10) 0.9371
Hormel loin pH (HORMLPH) 5.76±0.02 (162) 5.76±0.01 (255) 5.79±0.02 (10) 0.4443
Lab Loin Hunter (LABLH) 46.86±0.34 (162) 47.04±0.28 (255) 46.91±0.42 (10) 0.8702
Lab loin Minolta (LABLM) 21.99±0.32 (162) 22.18±0.26 (255) 21.86±0.40 (10) 0.6934
Lab loin pH (LABLPH) 5.82±0.02 (162) 5.82±0.01 (255) 5.83±0.02 (10) 0.9330
Water holding capacity (g) (WHC) 0.20±0.01 (162) 0.21±0.01 (255) 0.19±0.01 (10) 0.7403
Average Instron force (kg)
(AVINSFOR) 4.46±0.08 (150) 4.49±0.07 (255) 4.48±0.10 (9) 0.9345
Chew score (CHEWSCR) 2.53±0.09 (154) 2.46±0.08 (253) 2.34±0.11 (10) 0.3977
Flavor score (FLAVSCR) 2.94±0.15 (154) 2.74±0.11 (253) 2.76±0.19 (10) 0.4750
Juiciness score (JUICSCR) 6.03±0.13 (154) 6.01±0.09 (253) 6.14±0.16 (10) 0.7979
Off Flavor score (OFFLAVSC) 1.47±0.18 (154) 1.55±0.14 (253) 1.35±0.22 (10) 0.6772
Percent cooking loss (%)
(PCCOKLOS) 18.81±0.36 (154) 18.78±0.28 (253) 18.34±0.46 (10) 0.6762
Tenderness score (TENDSCR) 7.72±0.12 (154) 7.81±0.09 (253) 8.01±0.15 (10) 0.2810
Average glycogen (µmol/g) (AVGGG)
8.67±0.28 (161) 9.13±0.21(251) 8.21±0.36(10) 0.0564
Average glycolytic potential (µmol/g) (AVGP)
Table 7 - Association results of PLXNC1 gene with phenotypes in a Berkshire x Yorkshire pig population. The number of animals is in parenthesis.
PLXNC1 genotype
TRAIT 11 12 22 Pr > F
Average back fat (cm) (AVBFAT) 3.29±0.05 (396) 3.20±0.07 (95) 3.14±0.19 (9) 0.3669
Carcass weight (kg) (CARCWT) 87.13±0.17 (396) 87.38±0.28 (95) 86.97±0.79 (9) 0.6619
Last rib back fat (cm) (LASTRIB) 3.17±0.05 (396) 3.06±0.07 (95) 3.17±0.19 (9) 0.2600
Loin eye area (cm2) (LEA) 35.70±0.55 (396) 36.81±0.71 (95) 39.40±1.61 (9) 0.0246
Carcass Length (cm) (LENGTH) 84.20±0.15 (396) 84.01±0.25(95) 84.13±0.71(9) 0.7783
Lumbar back fat (cm) (LUMBAR) 3.57±0.06 (396) 3.49±0.09 (95) 3.38±0.23 (9) 0.4992
Tenth rib back fat (cm)
(TENTHRIB) 3.13±0.06 (396) 3.04±0.09(95) 2.86±0.22 (9) 0.3465
Average daily gain to weaning (kg)
(ADGWT) 0.23±0.01 (398) 0.24±0.01 (94) 0.24±0.02 (9) 0.5893
Average daily gain on test (kg) (AGDTEST)
0.69±0.01 (398) 0.66±0.01 (94) 0.70±0.02 (9) 0.0018
Birth weight (kg) (BIRTHWT) 1.54±0.04 (398) 1.53±0.05 (94) 1.58±0.10 (9) 0.8845
16 day weight (kg) (SIXTHEWT) 4.91±0.14 (398) 5.06±0.18 (94) 4.98±0.43 (9) 0.6188
Cholesterol (mg/100g) (CHOLES) 58.77±0.48 (396) 58.38±0.83 (95) 58.69±2.40 (9) 0.9068
Marbling (MARB) 3.70±0.07 (396) 3.62±0.09 (95) 3.64±0.24 (9) 0.6440
Total lipid (%) (TOTLIPPR) 3.07±0.15 (396) 3.24±0.19 (95) 3.24±0.42 (9) 0.5139
Average drip loss (%)
(AVDRIPPR) 5.77±0.14 (398) 5.77±0.22 (94) 6.29±0.63 (9) 0.7125
Color (COLOR) 3.26±0.03 (398) 3.19±0.05 (94) 3.36±0.16 (9) 0.3686
Firmness (FIRM) 3.39±0.04 (398) 3.38±0.07 (94) 3.58±0.21 (9) 0.6286
Fiber type I (FTYPI) 0.08±0.01 (390) 0.07±0.02 (94) 0.10±0.05 (9) 0.6875
Fiber type II ratio (FTYPIIR) 1.05±0.05 (390) 0.94±0.09 (94) 0.91±0.27 (9) 0.5267
Ham Hunter (HAMH) 41.71± 0.21(398) 41.31±0.37(94) 40.23±1.10 (9) 0.3132
Ham Minolta (HAMM) 17.52±0.18 (398) 17.18±0.31 (94) 16.37±0.93 (9) 0.3427
Ham pH (HAMPH) 5.90±0.01 (398) 5.86±0.02 (94) 5.85±0.07 (9) 0.1958
Hormel loin Hunter (HORMLH) 44.84±0.55 (398) 44.51±0.71 (94) 47.63±1.66 (9) 0.1432 Hormel loin Minolta (HORMLM) 21.36±0.38 (398) 21.06± 0.56 (94) 16.14±1.49 (9) 0.0023
Hormel loin pH (HORMLPH) 5.76±0.01 (398) 5.76±0.02 (94) 5.81±0.06 (9) 0.6762
Lab Loin Hunter (LABLH) 46.98±0.25 (398) 47.01±0.40 (94) 45.71±1.14 (9) 0.5170
Lab loin Minolta (LABLM) 22.08±0.24 (398) 22.11±0.38 (94) 20.92±1.09 (9) 0.5523
Lab loin pH (LABLPH) 5.82±0.013 (398) 5.80±0.02 (94) 5.81±0.06 (9) 0.6365
Water holding capacity (g) (WHC) 0.20±0.01 (398) 0.19±0.01 (94) 0.22±0.04 (9) 0.6767
Average Instron force (kg)
(AVINSFOR) 4.46±0.06 (374) 4.58±0.10 (82) 4.38±0.27 (9) 0.4660
Chew score (CHEWSCR) 2.42±0.07 (386) 2.58±0.11 (95) 2.22±0.32 (9) 0.2864
Flavor score (FLAVSCR) 2.89±0.11 (386) 2.67±0.18 (95) 2.20±0.55 (9) 0.3136
Juiciness score (JUICSCR) 6.06±0.09 (386) 5.89±0.16 (95) 6.69±0.48 (9) 0.2142
Off Flavor score (OFFLAVSC) 1.44±0.13 (386) 1.53±0.21 (95) 2.00±0.63 (9) 0.6641
Percent cooking loss (%)
(PCCOKLOS) 18.79±0.24 (386) 18.64±0.45 (95) 18.14±1.39 (9) 0.8798
Tenderness score (TENDSCR) 7.85±0.08 (386) 7.72±0.14 (95) 8.12±0.41 (9) 0.4942
Average glycogen (µmol/g) (AVGGG)
8.76±0.19 (391) 8.98±0.35 (95) 9.23±1.07 (9) 0.8076
Average glycolytic potential (µmol/g) (AVGP)
Table 8 - Association results of CRADD gene with phenotypes in a Berkshire x Yorkshire pig including the three genes in the model.
TRAIT CRADD Genotype
11 12 22 Pr > F
Average back fat (cm) (AVBFAT) 3.18 ±0.08 3.28 ± 0.09 3.31 ± 0.24 0.3827
Carcass weight (kg) (CARCWT) 86.99 ± 0.33 87.43 ± 0.36 87.39 ± 1.03 0.3196
Last rib back fat (cm) (LASTRIB) 3.12 ± 0.08 3.18 ± 0.09 3.50 ± 0.25 0.2721
Loin eye area (cm2) (LEA) 37.08 ± 0.80 37.49 ± 0.85 35.45 ± 2.12 0.5197
Carcass Length (cm) (LENGTH) 84.20 ± 0.29 83.95 ± 0.32 84.41 ± 0.90 0.5560
Lumbar back fat (cm) (LUMBAR) 3.43 ± 0.10 3.59 ± 0.11 3.57 ± 0.30 0.2035
Tenth rib back fat (cm)
(TENTHRIB) 2.98 ± 0.10 3.09 ± 0.11 2.88 ± 0.29 0.4188
Average daily gain to weaning (kg)
(ADGWT) 0.23 ± 0.01 0.24 ± 0.01 0.25 ± 0.03 0.5592
Average daily gain on test (kg) (AGDTEST)
0.68 ± 0.01 0.70 ± 0.01 0.67 ± 0.02 0.0846
Birth weight (kg) (BIRTHWT) 1.56 ± 0.05 1.53 ± 0.06 1.56 ± 0.14 0.7579
16 day weight (kg) (SIXTHEWT) 4.88 ± 0.21 5.03 ± 0.22 5.10 ± 0.56 0.6625
Cholesterol (mg/100g) (CHOLES) 58.26 ± 0.99 59.11 ± 1.09 56.79 ± 3.13 0.5190
Marbling (MARB) 3.56 ± 0.10 3.78 ± 0.11 3.66 ± 0.31 0.0537
Total lipid (%) (TOTLIPPR) 2.93 ± 0.20 3.56 ± 0.22 3.31 ± 0.53 0.0009
Average drip loss (%) (AVDRIPPR) 5.98 ± 0.27 5.98 ± 0.30 6.00 ± 0.83 0.9998
Color (COLOR) 3.33 ± 0.07 3.22 ± 0.07 3.46 ± 0.21 0.1301
Firmness (FIRM) 3.45 ± 0.09 3.47 ± 0.09 3.39 ± 0.27 0.9242
Fiber type I (FTYPI) 0.08 ± 0.02 0.10 ± 0.02 0.13 ± 0.06 0.2628
Fiber type II ratio (FTYPIIR) 0.99 ± 0.11 1.02 ± 0.12 1.05 ± 0.35 0.9395
Ham Hunter (HAMH) 41.01 ± 0.44 41.06 ± 0.49 39.78 ± 1.41 0.6437
Ham Minolta (HAMM) 16.98 ± 0.37 16.99 ± 0.41 15.87 ± 1.18 0.6165
Ham pH (HAMPH) 5.87 ± 0.03 5.85 ± 0.03 5.82 ± 0.09 0.5358
Hormel loin Hunter (HORMLH) 45.58 ± 0.81 45.96 ± 0.87 44.21 ± 2.19 0.6354
Hormel loin Minolta (HORMLM) 19.36 ± 0.65 19.72 ± 0.71 18.20 ± 1.95 0.6362
Hormel loin pH (HORMLPH) 5.79 ± 0.02 5.76 ± 0.02 5.77 ± 0.07 0.3190
Lab Loin Hunter (LABLH) 46.32 ± 0.49 46.90 ± 0.53 45.25 ± 1.50 0.2632
Lab loin Minolta (LABLM) 21.49 ± 0.46 22.03 ± 0.51 20.41 ± 1.43 0.2597
Lab loin pH (LABLPH) 5.82 ± 0.02 5.79 ± 0.03 5.74 ± 0.07 0.2095
Water holding capacity (g) (WHC) 0.20 ± 0.02 0.21 ± 0.02 0.13 ± 0.05 0.3689
Average Instron force (kg) (AVINSFOR)
4.46 ± 0.12 4.50 ± 0.13 5.27 ± 0.39 0.0974
Chew score (CHEWSCR) 2.47 ± 0.13 2.39 ± 0.15 3.06 ± 0.42 0.2355
Flavor score (FLAVSCR) 2.51 ± 0.21 2.80 ± 0.24 1.69 ± 0.70 0.1150
Juiciness score (JUICSCR) 6.15 ± 0.19 6.24 ± 0.21 6.02 ± 0.62 0.8238
Off Flavor score (OFFLAVSC) 1.86 ± 0.26 1.47 ± 0.29 2.66 ± 0.81 0.1035
Percent cooking loss (%)
(PCCOKLOS) 18.66 ± 0.53 18.41 ± 0.61 19.04 ± 1.77 0.8349
Tenderness score (TENDSCR) 7.82 ± 0.17 7.86 ± 0.19 7.06 ± 0.54 0.3081
Average glycogen (µmol/g) (AVGGG)
8.97 ± 0.41 9.08 ± 0.47 8.06 ± 1.60 0.7875
Average glycolytic potential (µmol/g) (AVGP)
107.73 ± 2.27 107.84 ± 2.53 108.25 ± 8.36 0.9970
Table 9 - Association results of SOCS2 gene with phenotypes in a Berkshire x Yorkshire pig including the three genes in the model.
SOCS2 genotype
TRAIT 11 12 22 Pr > F
Average back fat (cm) (AVBFAT) 3.29 ± 0.12 3.29 ± 0.12 3.20 ± 0.12 0.4667
Carcass weight (kg) (CARCWT) 87.15 ± 0.52 87.59 ± 0.47 87.08 ± 0.48 0.0969
Last rib back fat (cm) (LASTRIB) 3.30 ± 0.12 3.30 ± 0.12 3.20 ± 0.12 0.4328
Loin eye area (cm2) (LEA) 36.48 ± 1.11 36.70 ± 1.04 36.83 ± 1.06 0.8962
Carcass Length (cm) (LENGTH) 84.30 ± 0.46 84.07 ± 0.42 84.19 ± 0.43 0.6261
Lumbar back fat (cm) (LUMBAR) 3.56 ± 0.15 3.55 ± 0.14 3.47 ± 0.14 0.6403
Tenth rib back fat (cm) (TENTHRIB) 2.99 ± 0.15 3.02 ± 0.14 2.94 ± 0.14 0.5624
Average daily gain to weaning (kg) (ADGWT)
0.22 ± 0.02 0.24 ± 0.02 0.26 ± 0.02 0.0158
Average daily gain on test (kg)
(AGDTEST) 0.68 ± 0.01 0.68 ± 0.01 0.69 ± 0.01 0.4724
Birth weight (kg) (BIRTHWT) 1.52 ± 0.07 1.56 ± 0.07 1.58 ± 0.07 0.4585
16 day weight (kg) (SIXTHEWT) 4.69 ± 0.29 5.03 ± 0.27 5.29 ± 0.28 0.0125
Cholesterol (mg/100g) (CHOLES) 57.77 ± 1.57 57.83 ± 1.44 58.56 ± 1.47 0.7558
Marbling (MARB) 3.57 ± 0.15 3.68 ± 0.14 3.75 ± 0.15 0.2718
Total lipid (%) (TOTLIPPR) 3.16 ± 0.28 3.32 ± 0.26 3.32 ± 0.27 0.4748
Average drip loss (%) (AVDRIPPR) 6.10 ± 0.42 6.11 ± 0.38 5.75 ± 0.39 0.3919
Color (COLOR) 3.42 ± 0.11 3.35 ± 0.10 3.24 ± 0.10 0.0889
Firmness (FIRM) 3.46 ± 0.14 3.46 ± 0.12 3.39 ± 0.13 0.7048
Fiber type I (FTYPI) 0.10 ±0.03 0.10 ± 0.03 0.10 ± 0.03 0.9661
Fiber type II ratio (FTYPIIR) 1.14 ± 0.18 1.06 ± 0.16 0.87 ± 0.17 0.1342
Ham Hunter (HAMH) 40.40 ± 0.71 40.61 ± 0.65 40.84 ± 0.66 0.7400
Ham Minolta (HAMM) 16.44 ± 0.59 16.64 ± 0.54 16.75 ± 0.55 0.7705
Ham pH (HAMPH) 5.84 ± 0.04 5.83 ± 0.04 5.87 ± 0.04 0.3043
Hormel loin Hunter (HORMLH) 45.17 ± 1.14 45.39 ± 1.07 45.19 ± 1.09 0.8959
Hormel loin Minolta (HORMLM) 18.86 ± 0.98 19.05 ± 0.91 19.37 ± 0.93 0.7963
Hormel loin pH (HORMLPH) 5.78 ± 0.04 5.77 ± 0.03 5.78 ± 0.03 0.8265
Lab Loin Hunter (LABLH) 45.88 ± 0.75 46.23 ± 0.69 46.37 ± 0.71 0.6406
Lab loin Minolta (LABLM) 21.12 ± 0.72 21.45 ± 0.66 21.36 ± 0.68 0.6848
Lab loin pH (LABLPH) 5.79 ± 0.04 5.78 ± 0.03 5.78 ± 0.04 0.9963
Water holding capacity (g) (WHC) 0.18 ± 0.03 0.19 ± 0.02 0.18 ± 0.03 0.7250
Average Instron force (kg)
(AVINSFOR) 4.75 ± 0.19 4.74 ± 0.17 4.73 ± 0.18 0.9833
Chew score (CHEWSCR) 2.81 ± 0.21 2.64 ± 0.19 2.47 ± 0.20 0.1182
Flavor score (FLAVSCR) 2.30 ± 0.35 2.29 ± 0.32 2.42 ± 0.32 0.8397
Juiciness score (JUICSCR) 6.02 ± 0.31 6.11 ± 0.28 6.27 ± 0.29 0.6036
Off Flavor score (OFFLAVSC) 2.19 ± 0.41 2.09 ± 0.37 1.70 ± 0.38 0.2714
Percent cooking loss (%)
(PCCOKLOS) 18.91 ± 0.90 18.81 ± 0.81 18.39 ± 0.82 0.7485
Tenderness score (TENDSCR) 7.38 ± 0.27 a 7.57 ± 0.25 7.79 ± 0.25 b 0.1484
Average glycogen (µmol/g) (AVGGG)
8.72 ± 0.74 9.21 ± 0.68 8.18 ± 0.68 0.0437
Average glycolytic potential (µmol/g) (AVGP)
109.21 ± 3.90 108.41 ± 3.60 106.21 ± 3.65 0.5614