TELECOM CUSTOMER SEGMENTATION AND PRECISE
PACKAGE DESIGN BY USING DATA MINING
Zhang Tianyuan (Victor)
Dissertation submitted as partial requirement for the conferral of
Master in Business Administration
Supervisor:
Prof. Luís Martins, ISCTE Business School, Departamento de Marketing,Operações e
Gestão Geral (IBS)
A
N
D
P
RE
CISE
P
A
C
K
A
G
E
DESI
G
N
D
E
SIG
N
CU
ST
O
ME
R
SE
G
M
E
N
T
A
T
IO
N
B
Y
US
IN
G
DA
T
A
M
INI
NG
Zha
n
g
T
ia
n
yu
an
(V
ict
or
)
T
E
L
E
CO
M
ACKNOWLEDGEMENT
My deepest gratitude goes first and foremost to Professor Luís Martins, my supervisor, for his constant support and guidance. Without his inclusive attitude and meticulous guidance, this dissertation could not have reached its present form. He is my important guide, encouraging me to go through all the difficulties in the thesis writing process.
I would also like to thank all the professors who have taught me in ISCTE. Your hard work and selfless help me quickly integrate into an unfamiliar environment, learned the knowledge that will benefit me forever, and laid a solid foundation for future work.
To my classmates, I also expressed my deepest gratitude. At ISCTE, I deeply understood the importance of teamwork. Their full cooperation and help made me grow rapidly.
Finally, I would like to thank my parents and family members. They are my strongest backing, giving me selfless dedication and great support. Without them, I have no chance to pursue my dreams and see such a wonderful world. I will always love them!
ABSTRACT
Changes in the form of communication have prompted the telecommunications industry to flourish. In the "big data era" of information explosion, as one of the leading industries in the information age, the development of the telecommunications industry depends not only on communication technology, but also on the ability of enterprises to optimize resource allocation. At present, the information resources owned by telecom companies mainly come from customers. During the development process, they have accumulated a large amount of customer data, which truly and objectively reflects the behavior of consumers.
This paper is dedicated to combining data mining technology with the rich data resources of the telecom industry and the latest marketing theories, not only effectively helping subdivide the telecommunications customer market, but also supporting telecommunications companies in developing more accurate and efficient marketing strategies. In addition, data analysis method such as factor analysis, regression analysis and discriminant analysis are used to analyze the
demographic, business, SMS messages and expense characteristics of telecom customers, providing a new vision and reference for the telecom industry to achieve accurate packaging design. Based on the above research results, a discriminant model for the loss of telecom customers is constructed, which will help telecommunications companies to obtain a control method for telecom customer management risk. At last, data mining technology is used to optimize the combination design of telecommunication services, which offer effective advice on precise telecom package design to telecommunications companies.
Key words: Telecom, Customer segmentation, data mining, targeted marketing, package design
INDEX
GLOSSARY ... 7 TABLES INDEX ... 8 FIGURES INDEX ... 9 APPENDIX INDEX ... 10 Chapter 1 Introduction ... 111.1 Framework and research motivation ...11
1.2 Objectives of the investigation ... 12
1.3 Thesis structure ... 12
Chapter 2 Contextualization ... 14
Chapter 3 Literature Review... 16
3.1 The application of marketing in the field of telecommunications ... 16
3.2 Client subdivision... 18
3.3 Application of data mining in the field of telecommunications... 20
3.4 Basic concept of marketing ... 20
3.4.1 Basic concept of marketing ... 20
3.4.2 Marketing classic theory ... 22
3.5 Customer segmentation ... 23
3.5.1 The main method of customer segmentation ... 23
3.5.2 Definition of Customer Segmentation ... 24
3.5.3 Customer Segmentation Technology ... 26
3.5.4 The implementation model of Customer Segmentation ... 29
3.5.5 Customer segmentation in telecom marketing ... 29
Chapter 4 Data Analysis by Applying SPSS Software ... 31
4.1 Design analysis and research hypotheses ... 31
4.2 Steps of the Investigation ... 33
4.3 Paradigm and Data Collection Methodology ... 34
4.4 The Exploratory study and methodological options ... 34
4.5 Demographic characteristics of telecom customers ... 35
4.5.1 Sex characteristics... 35
4.5.2 Age characteristics ... 35
4.6 Business information of telecom customers ... 36
4.6.1 Information about packages ... 36
4.6.2 Information about CRBT service ... 37
4.6.3 Information about interactive world flow ... 38
4.7 Factor analysis results of SMS of telecom customers ... 39
4.7.2 KMO and Bartlett’s test of sphericity (Testing the Research Hypotheses) ... 39
4.7.3 Common factor variance ... 40
4.7.4 Total variance of interpretation ... 41
4.7.5 Component matrix ... 43
4.8 Pearson correlation regression analysis of telecom customer expense information ... 44
4.9 Regression analysis and chi-square analysis results of telecom package ... 48
4.9.1 Regression analysis results of telecom package ... 48
4.9.2 Chi-square analysis results of telecom package ... 49
Chapter 5 Discriminant Model for the Loss of Telecom Customers ... 51
5.1 The importance of the construction of the discriminant model for the loss of telecom customers 51 5.2 Bayesian linear discriminant model based on Fisher linear discriminant analysis ... 51
5.3 Empirical analysis for the discriminant model of telecom customers loss ... 52
5.3.1 Selection of discriminant attributes ... 52
5.3.2 Result analysis of discriminant model ... 52
Chapter 6 Accurate Package Design Method ... 57
6.1 Package design ... 58
6.2 Tariff Calculation ... 58
Chapter 7 Conclusions ... 61
7.1 Main conclusions ... 61
7.2 Limitations and expectations ... 64
REFERENCES ... 65
GLOSSARY
Items Meaning of expression
MOU Minutes Of Usage
CRBT Color Ring Back Tone
MMS Multimedia Messaging Service
SMS Short Message Service
Local cost The cost generated by customers using local call service
Roaming cost The cost generated by customers using the mobile phone roaming
service
Unicom intranet cost The cost generated by customers using China Unicom intranet
service
Cost with China Mobile The cost generated by customers using China Mobile service
Cost with fixed line The cost generated by customers using fixed line
Monthly fixed cost The customers’ monthly fixed fee
Monthly total called MOU The total minutes of customers are called monthly
Monthly total caller MOU The total minutes of customers calling someone else
TABLES INDEX
Table 1-Summary of the Research Hypotheses ... 31
Table 2-KMO and Bartlett’s test ... 39
Table 3-Common factor variance ... 40
Table 4-Total variance of interpretation ... 41
Table 5-Component score coefficient matrix ... 43
Table 6-Pearson correlation coefficient intensity ... 44
Table 7-Pearson correlation regression analysis result ... 44
Table 8-Pearson correlation regression analysis result ... 44
Table 9-Pearson correlation regression analysis result ... 45
Table 10-Pearson correlation regression analysis result ... 45
Table 11-Pearson correlation regression analysis result ... 46
Table 12-Pearson correlation regression analysis result ... 46
Table 13-Pearson correlation regression analysis result ... 47
Table 14-Multivariate “logistic” regression analysis results ... 48
Table 15-Chi-square analysis results of telecom package ... 49
Table 16-Eigenvalues ... 52
Table 17-Lambda of Wilks ... 53
Table 18-Classification function coefficients ... 54
Table 19-Meaning of Independent variable ... 55
Table 20-Discriminant result checklist ... 56
Table 21-one telecom company A package design framework ... 58
Table 22-Initial calculation parameters of A package ... 59
Table 23-Target customer range assumptions for each grade package ... 60
FIGURES INDEX
Figure 1-“customer pyramid” subdivision figure ... 26
Figure 2-clustering algorithm understand schemes ... 27
Figure 3-decision tree algorithm for example figure ... 28
Figure 4-the figure of customer segmentation function model based on data mining ... 29
Figure 5-Conceptual Model and Research Hypotheses ... 33
Figure 6-Information about the selected packages of customers ... 36
Figure 7-Consumer expenditure information about CRBT service ... 37
Figure 8-Consumption information about interactive world flow ... 38
Figure 9-Scree plot ... 41
APPENDIX INDEX
APPENXID 1-Sex ratio characteristics ... 68 APPENDIX 2-Characteristics of age distribution ... 68
Chapter 1 Introduction
1.1 Framework and research motivation
With the rapid development of computer technology and Internet technology, people's lives have undergone earth-shaking changes. Changes in the form of communication have prompted the telecommunications industry to flourish. In the "big data era" of information explosion, as one of the leading industries in the information age, the development of the telecom industry depends not only on communication technology, but also on the resource optimization and configuration capabilities of enterprises, and the management of huge information and data resources becomes a enterprise. The key to improving competitiveness. Using data mining technology to improve the effectiveness of telecom enterprise information processing, from the perspective of the company's marketing level, in line with the internal needs of customer segmentation. The so-called customer segmentation mainly refers to the behavior of dividing an existing customer of an enterprise into different customer groups according to specific criteria.
Most traditional customer segmentation methods are based on criteria such as demographics and socioeconomics. For example, the customer base is divided according to the customer's age, gender, geographic location, occupation, social class and consumer behavior. However, the complexity of customer data makes customer segmentation increasingly difficult. Telecom operators have accumulated a large amount of customer information and consumption data during their
development. These data truly and objectively reflect the behavior of consumers. Combining data mining technology with the rich data resources of the telecom industry can effectively segment telecommunications customers and help telecommunications companies develop more accurate, efficient and effective marketing strategies.
This study aims to understand the related concepts and theories of telecommunication industry, telecom customers, market segmentation and data mining technology. On this basis, statistical analysis software is used to descriptive statistical analysis of telecom customers' demographic characteristics, business information and SMS usage. Then factor analysis, regression analysis and discriminant analysis are used to analyze the SMS messages and expense characteristics of telecom
customers, providing a new vision and reference for the telecom industry to achieve accurate packaging design. Based on the above research results, a discriminant model for the loss of telecom customers is constructed, which will help telecommunications companies to obtain a control
method for telecom customer management risk. At last, data mining technology is used to optimize the combination design of telecommunication services, which offer effective advice on precise telecom package design to telecommunications companies. Part of it lays the theoretical foundation.
1.2 Objectives of the investigation
The main purpose of this research survey and analysis is to:
(1) Review the concepts of market theory, relevant research status of telecommunication industry and data mining theory, and provide guidance for the direction of research, and lay a theoretical foundation for the smooth development of the following research;
(2) Conduct literature survey and summary on the research status of market segmentation, telecommunications industry and data mining technology, and seek methods and breakthrough points for this research;
(3) Conduct customer characteristics analysis on the telecom market to understand the inherent laws of the telecom market business and customer development;
(4) Using data mining technology to construct a telecom customer churn discriminant model, and then obtain a control method for telecom customer management risk;
(5) Based on the above research results, data mining technology is used to optimize the combination design of telecommunication services, which provides reference for customer segmentation
efficiency and business development in the telecom market.
1.3 Thesis structure
This research mainly includes nine parts, which are introduction, context, literature review, market segmentation theory part, data mining technology theory part, telecom customer data analysis part, customer churn discriminant model, business portfolio design optimization part and conclusion part. A brief introduction to these nine sections is now available:
(1) Introduction: This part mainly introduces the main contents of the research, including the research background and motivation, the purpose of the investigation and the main structure of the
article, laying the framework for the following;
(2) Contextualization: This part mainly introduces the development background of data mining technology and the development background of the telecom market, and provides an environmental basis for overall research;
(3) Literature review: This part mainly investigates and summarizes the research situation of telecom customer market management and data mining development and application in recent years, and provides reference for improving the research framework;
(4) Market segmentation theory part: This part mainly introduces the basic concepts and related theories of market management and market segmentation, and provides support for telecom customer feature analysis and telecommunication service analysis;
(5) Theoretical part of data mining technology: This part mainly introduces the basic concepts, technical principles, applications and other aspects of data mining, and provides support for the application analysis of data mining technology below;
(6) Telecom customer data analysis part: This part mainly uses statistical analysis software to analyze the internal law of telecom customer data;
(7) Customer churn discriminant model construction part: This part mainly discusses the specific application of data mining technology in discriminating customer churn;
(8) Business portfolio design optimization part: This part mainly studies how to use data mining technology to integrate telecom services, thereby improving the utilization rate of telecom customer resources;
Chapter 2 Contextualization
Nowadays, the informationization degree in the world is increasing, and all kinds of information play a more and more important role in people's production and life. People not only enjoy the great convenience brought by information technology, but also have to face the inconvenience caused by too much information redundancy. Data mining technology is generated and developed in such a context, it has solved this problem to a certain extent, people also can use information more efficiently.
2.1 The emergence of data mining
In the information society, people face a huge amount of data, which makes people feel confused, and even unable to start, on the other hand, many valuable and meaningful data are buried in them, it is difficult to play its role. With the progress of science and technology, people find the solution to this problem, through data mining technology, people can select valuable information from the huge data, find out the law hidden in the data. With the continuous development of data mining technology, it has played an important role in all walks of life, and promoted the development of society.
2.2 The development process of data mining
In the 1980s, data mining technology emerged, and initially the technology was applied to the commercial field.
In 1989, people held a conference in Detroit to discuss the development of data mining technology, which was the first officially proposed data mining concept in the world.
At present, data mining technology has become a topic of increasing concern, and the research on this technology is still ongoing, and the data mining system has been put into practical production and application, and plays an important role. Data mining technology will still be greatly improved in the future (Gangquan Si,Kai Zheng,Zhou Zhou, 2018).
2.3 definition of data mining
Data mining technology refers to the process of extracting hidden, meaningful, useful information and conclusions from huge, incomplete, incomplete and random data. Therefore, future trends and
behaviors can be predicted and forward-looking and knowledge-based decisions can be made. Data mining requires a variety of analytical methods and tools that can handle large amounts of data at the same time.
2.4 What can data mining do?
Data mining can find the association between data, and some rules existing between variables. Data can be classified, set up different categories and the corresponding classification criteria according to the attributes of the data. Data mining can directly classify the source data, and do not need to set up different categories, and only need to be classified according to the approximation between the data. This method is called clustering analysis. Data mining can be used to model to collect past data, get the change rule, as long as inputting the existing data, we can assess its future value range. This paper build customer loss model through the historical data of the telecom customers to determine the size of the possibility of the loss of telecom customers, and the accuracy rate reached 75%. In addition, data mining can analyze some special values, outliers and extreme values, and find out the potential law of deviation from the conventional data. This method is called deviation analysis. There are many methods of data mining, such as factor analysis and chi square analysis. They can play a huge role in revealing the laws of data and extracting useful information (Wen-Yu Chiang, 2017).
Chapter 3 Literature Review
With the rapid development of the information age, the telecommunications industry faces a more complex competitive environment, but also faces the task of transforming internal resources and technological innovation. In the current information explosion, how to make good use of all kinds of information resources inside and outside the enterprise, inside and outside the industry, and mine the content that is conducive to the development of the enterprise in the infinite data, provide an effective basis for the improvement of the marketing strategy of the enterprise, and become the modernization of the telecom enterprise. An important topic that cannot be evaded in development (Yin Mao, 2018).
3.1 The application of marketing in the field of telecommunications
The emergence and development of marketing is an important foundation for all industries to occupy superior resources and obtain comprehensive competitiveness. For the telecommunications field, an in-depth understanding of marketing theory, adopting advanced and targeted marketing strategies, will help promote the development of the telecommunications industry and its enterprises (Feng Jiang, 2018). At present, the application research for marketing in the field of
telecommunications mainly focuses on marketing value analysis, marketing strategy analysis and marketing development trend analysis.
And others used Pakistan's telecom business market as an example to conduct a relatively comprehensive analysis of Pakistan's telecommunications development environment. Research shows that the development of Pakistan's telecommunications business has become a rigid demand, mainly due to the growing development of Pakistan. At the same time, the implementation of China's “One Belt, One Road” strategy has also contributed to the vigorous development of Pakistan's telecommunications business. On the basis of good development, the author also
emphasizes the development status of Pakistan's national economy. He believes that in the context of the overall low level of national income, the development of telecommunication services should pay more attention to economics. Therefore, in the formulation of marketing strategies, The price strategy is not core(Syed Yasir Imtiaz,2015).
Some studies conducted a comprehensive evaluation of the customer value of the
through customer value analysis. The research indicates that in the marketing of the
telecommunications industry, it is necessary to maximize the lifetime value of customers, and at the same time, build a model based on the customer's purchasing behavior, and use the fuzzy analytic hierarchy process and the weighted RFM value TOPSIS method to rank the customer's lifetime value. Provide a basis for the formulation of marketing strategies. The author uses the customer value indicator to point out the direction of the marketing strategy of the telecom enterprise, and largely follows the principles of the relevant theory of the consumer market. It also conforms to the characteristics of the current social development and meets the essential needs of consumers. However, in the process of customer value evaluation, the study did not take into account the individual differences of customers, and lacked the division of customer types, resulting in one-sided evaluation of customer lifetime value( Azadnia, A.H.,2011).
Some researches further analyzed the customer value in marketing in the study. Research shows that customer value is an important reference factor in the process of formulating marketing
strategies. Different types of customers have different determinants of their value. At the same time, different customers' value contributes to marketing performance. . Therefore, in the process of customer value evaluation, enterprises should first classify customers, and can conduct research on customer value contribution by means of model processing methods and system engineering models. However, although the authors emphasized the value of the customer in the study, especially the importance of the value of the group's customers, there was no detailed analysis of the contribution of such high-value customers (Mikko Pynnonen, Paavo Ritala, and Jukka Hallikas,2011).
After analyzing the consumer demand of Japanese mobile communication business customers, realized that adult users have personal privacy protection and personalized differentiated services for communication services, and suggested that communication providers strengthen product innovation in user privacy protection service. (Yoshihiro Yamamoto ,2012)
And others believe that in the field of next-generation mobile communications, the differentiation of product differences between enterprises will be further narrowed. To win market competitiveness, enterprises can only work hard on services. At the same time, they also pointed out that as users' demand for social services increases, how operators can meet the social needs of users will be one of the deciding factors. (Claudio Feijoo, 2016)
3.2 Client subdivision
Customer segmentation is a segmentation strategy in which customer value is the core of marketing. Enterprises usually develop marketing strategies based on customer segments with different values, thereby improving the overall benefits of marketing. Customer segmentation has a long history of research and development. Therefore, the concepts, methods, and systems of customer
segmentation have been basically improved, stabilized, and widely used.
Some researches proposed to identify and segment customers in the context of lifestyle. Related research on lifestyle segmentation also stems from the assumption that the more you know about customers, the more effective marketing tools you can take. Although this lifestyle subdivision emphasizes the systematic nature of lifestyle, it still does not regulate its content. ( Lazer,1963) Published an article in the year that the three subdivision theories of geographic subdivision, demographic subdivision and sales subdivision dominated the market segmentation method to a certain extent. However, because these three theories are too dependent on descriptive factors and not causal factors, they cannot effectively predict the direction of customers' behavior in the future. Therefore, a method of a new multiple criteria decision aiding approach for market segmentation that integrates preference analysis and segmentation decision within a unified framework is proposed. (Jiapeng Liu,2018)
Researchers use attitude-function methods to segment the market, provide services to each individual's attitude, and identify groups to design a specific marketing mix for each functional profile. This approach is a qualitative assessment of the attitudes of consumers in their physical health and the development of a tool to identify the distribution of attitude functions. (Obinna O. Obilo,2018)
Based on the mathematical planning method, some scholars have studied the market segmentation strategy of the demand side platform, and established the selection model of the group real-time bidding advertising market granularity, which serves as the basis for the market segmentation strategy adjustment. (Rui Qin,2017)
Some researchers have explored the market segmentation needs of different market stages, and proposed a multi-stage market segmentation and an empirical model of subdivision alignment to strategically adjust the potential of multi-stage markets. (Thomas,2016)
used in database marketing. It is based on three variables: consumer time interval, frequency and monetary. Identify customers. R refers to the time interval since the customer's last consumption behavior has occurred. The shorter the interval, the larger the R is. F refers to the number of times the consumer behavior occurs in a certain period. The more times the customer is, the more likely it is that the customer will reach a new transaction with the company; M refers to the amount of consumption during a certain period of time. The larger the M, the more likely it is that the
customer is more likely to enter into a new transaction with the company. The RFM analysis scores each indicator for each customer, then calculates the product of the three indicators, and then sorts the results. Based on this, all customers are classified according to 20%, 60%, and 20%, and implemented for different customers. Different strategies. The three influencing factors are relatively easy for companies with databases to predict customer buying behavior. Predicting a customer's purchase behavior with recent behavior is more accurate and effective than predicting with either factor. (Hughes,1994)
Some researched argues that the right customer segmentation can effectively reduce costs while gaining a stronger, more profitable market penetration. Enterprises focus on investing limited resources into customers who have value and contribution to the company. Choosing and determining those customers that the company should retain is very important for effective
customer retention and enhancing corporate profitability. Therefore, he believes that customers are fine. Points are the key to a company's ability to successfully implement customer retention. (Soper,2002)
Some studies points out that customer segmentation is based on relational and relationship costs. Effective customer segmentation relies on relevant, efficient, and implementable, homogeneous market segmentation, seeking a range of variables. To describe the behavioral needs of all aspects. (Stringfellow,2004)
Some researched proposes that the customer market segmentation is conducive to the company's products and production capacity to meet customer needs more closely and effectively, that is, to facilitate the rational allocation of resources in potentially profitable market segments. (Albrecht, 2007)
It can be seen that market segmentation based on customer characteristics is widely recognized as the main way to improve marketing efficiency and helps to improve the rational allocation of resources.
3.3 Application of data mining in the field of telecommunications
The concept of data mining was first proposed at the first KDD International Academic Conference. Among them, KDD is the English abbreviation for knowledge discovery in the database. KDD is a specific process of discovering knowledge from a large data set, and data mining is the foundation of KDD. Since the concept and idea of data mining, people have done a lot of application research on data mining, and various academic discussions and research topics have also stimulated people's research enthusiasm. In particular, the "Data Processing" special report launched by the famous "science" magazine in the United States promotes the progress and development of data mining technology. Data mining applications are mainly for the storage, analysis and processing of large-scale data sets, and have high requirements on the computing performance of machines. In order to reduce the performance requirements of data mining for computing machines, Google has
developed a parallel computing algorithm mechanism for processing big data through distributed clusters, and released the famous Map Reduce computing model. The Map function defined in Map Reduc first converts the data sequence into a data stream with a key-value pair structure, and then reduces the size of the data stream by the Reduce function, which aggregates the key-value pairs with the same key, reducing the data size. Provides the computing performance of the system. Artur Rocha(2018) used the combined experimental data of the EU E-COMPARED Depression Test to explore the expressive power of multi-relational inductive logic programming (ILP) data mining methods. Vandana P. Janeja (2018) provides a mechanism for extracting task-related data using master data management (MDM) from a clinical trial database, distributed across multiple domain datasets; at the same time, researchers provide classification, aggregation Class and association rule mining.
3.4 Basic concept of marketing 3.4.1 Basic concept of marketing
Marketing is a value activity or an activity. Achieving product sales (or exchange) is the core value goal of marketing. Through marketing, the relationship between enterprises and consumers is built, which is conducive to enhancing consumers' perception of enterprises and products. Second, marketing is a process of information transfer. In this process, not only the transmission of
information in enterprises, partners, consumers and even the whole society. Third, marketing involves many links, including pricing, promotion, distribution, market research, etc. It is a
systematic project. Fourth, marketing is closely linked to corporate management. It can even be said that marketing is the most important management behavior of an enterprise (Rick Ferguson, Bill Brohaugh,2018). Based on this understanding, the author defines marketing as “enterprise in order to realize the transmission of information about enterprises and products or services with
consumers, partners and the whole society, and use this communication to achieve sales of enterprise products and obtain expected benefits. A series of active management activities around market research, pricing, promotion, distribution and other activities.
The strategy is considered to be “a set of plans to achieve the goal”, or as a “comprehensive combination of various strategies based on strategic objectives and development according to the situation.” Marketing must pay attention to certain strategies. It is generally believed that the marketing strategy refers to “the enterprise is based on the market conditions and the actual situation of the enterprise, focusing on the strategic objectives of the enterprise, and starting from the customer needs as much as possible, based on the experience of the previous market, combined with the macroeconomic development situation and industry development. Prospects, etc., planned design includes a series of strategic combinations including products, prices, channels and
promotion strategies.” Marketing strategy is an important path and guarantee for achieving
marketing objectives (Long Zhao, Qian Gao, XiangJun Dong, Aimei Dong, 2018). In other words, the question to be solved by the marketing strategy is: how to meet the needs of consumers and society? What measures need to be taken? How to make these measures effective marketing strategies are mainly divided into product strategy, price strategy, channel strategy, and promotion strategy. With the development of modern marketing practices, service strategies and brand strategies have also received great attention. The product strategy aims to solve the problems of “what products are needed in the market” and “what products can be provided by enterprises”; the price strategy is to answer “business-to-product pricing and profit expectations”; the channel strategy is to ensure the channel of the enterprise. Security, maintain channel security, so as to better achieve marketing objectives; promotion strategy to solve "how to promote", "how to attract consumers and put products into the market as soon as possible"; service strategy is for recent years of service The importance of corporate marketing is enhanced to improve the customer's service experience and win consumer loyalty; the brand strategy is aimed at the needs of brand competition
and plan how to promote corporate brand awareness as soon as possible. In addition to these marketing strategies, there are communication strategies, customer strategies, and associated strategies. It should be pointed out that there are many marketing strategies (Jiantao Wang; Caifeng He; Yijun Liu, 2017). In the actual design of marketing strategies, enterprises often do not use a single strategy, but a combination of multiple strategies. For example, a combination of products, prices, channels, and promotional strategies. The combination strategy is the most basic trend in the actual marketing strategy.
3.4.2 Marketing classic theory
(1)4Ps Marketing Theory.4Ps marketing as a classic marketing theory, first developed by
American marketing scholar Jerome? Presented by Jerome McCarthy. 4Ps marketing theory believes that product, price, pass and promotion are the four main factors affecting marketing effectiveness. Among the four elements, the product is considered the basic element. The 4Ps theory emphasizes that only products that meet market needs can gain an advantage in marketing. In order to meet the needs of the market, companies are required to strengthen their product image through reasonable product mix, product packaging and brand marketing. With the increasingly fierce competition among modern enterprises, product personalization strategies or differentiation strategies have been upgraded to strategic heights. Price is an economic factor that affects
marketing. In general, the higher the price, the more unfavorable the marketing. If the product has strong brand influence or innovation, such as Apple's mobile phone, consumers are still willing to pay a higher price for the product. Affected by the diffusion of technology, product homogeneity between enterprises has become more and more prominent, and the role of channels in marketing has also become increasingly prominent. Even “the channel has the world” has been widely recognized in marketing theory and corporate practice. The more diverse and secure the channels, the more beneficial it is to achieve the marketing goals of the company. Promotions are considered narrowly defined marketing for a long time. Promotions can be applied to new product promotion, market possession, elimination (or slow-moving) products to inventory, etc. It should be pointed out that with the development of marketing, the four elements of 4Ps continue to expand, and there have been 6Ps, 7Ps, 8Ps and other theories. . These theories integrate services, brands and other elements into the marketing concept. In addition, according to the 4Ps theory, theories such as 4Cs
and 4Rs have also been born. 4Cs emphasizes that the marketing of enterprises is from the
perspective of consumers, and the essence is “4Ps theory based on consumer perspective”. The 4Rs theory also emphasizes the need to establish positive relationships with consumers, aiming to achieve the company's value goals by meeting consumer needs. Although there are differences in the expression of these theories, the essential ideas are basically the same: not only through the regulation of marketing factors such as products, prices, channels and promotions, but also to achieve the corporate goals to achieve the strategic intentions of the enterprise (M. Ruiz; M. Germán; L.M. Contreras; L. Velasco,2016).
(2)Integrated marketing theory.Following the 4Ps theory, marketing academics and major
companies have continuously summarized various theories according to marketing practices, such as STP theory, network marketing theory, brand marketing theory and so on. The factors affecting marketing are increasing. From a realistic perspective, the integration of various marketing elements has become a fundamental trend in the development of marketing theory and practice. Therefore, integrated marketing has been highly valued. The essence of integrated marketing is that “enterprise can integrate various resources that are conducive to achieving its goals according to its own
strategic goals and actual disposable resources to maximize the benefits of the company.” In other words, integrated marketing is to fully mobilize all kinds of positive Elements to achieve the goal of corporate unity. According to the integrated marketing theory, consumers are at the core of
marketing, and companies must do their best to meet the needs of consumers (Vishal Mahajan, Richa Misra, Renuka Mahajan, 2015). With the development of integrated marketing, it is currently believed that integrated marketing includes at least two contents: First, the integration of marketing functions, such as organic integration of brand building, after-sales service, market research and product development. Second, the functional integration of relevant departments requires not only the marketing department to actively participate in marketing, but also the cooperation of
production, R&D and finance departments.
3.5 Customer segmentation
3.5.1 The main method of customer segmentation
Everyone is different, and the things they like are different. Therefore, there are huge differences between customers. A company cannot be liked by all customers. The customer’s loyalty to the brand is not constant. . Therefore, in order to make users loyal to a certain brand according to value
marketing, the most important thing is to carry out customer segmentation work and analyze the customers that can bring sustainable profits to the enterprise, so that the enterprise can guarantee long-term profit and sustainable development. The methods to achieve customer segmentation are as follows:
(1) Customer feature segmentation. The customer's socio-economic basis determines the customer's needs, so when the customer's feature segmentation, the customer's socio-economic basis can be subdivided, and the socio-economic foundation has many relevant elements, including geographic elements, such as the customer's home address. , administrative districts, etc.; social factors, such as age range, economic income, work industry, education level, etc.; psychological factors, such as personality, lifestyle, etc.; and consumer behavior, such as home ownership, brand loyalty (Hui Li, Di Wu, Gao-Xiang Li, Yi-Hao Ke,2015).
(2) Customer value interval segmentation. The value that customers can provide to the business is different. Companies need to divide different value ranges and identify high-value customers that can sustain growth for the business. The customer value range is sorted from high to low, and the value interval is assigned to the segmented customer group according to the characteristics of the customer. When developing a customer value interval, the segmentation attributes can be customer responsiveness, customer loyalty, customer profit contribution, and so on.
(3) Customer common needs segmentation. Focus on customer segmentation and customer value segmentation, identify the common needs reflected by the highest value customer segmentation, as the wind vane and market main point of the business process, and develop differentiated marketing solutions for the segmented customer market.
3.5.2 Definition of Customer Segmentation
In the mid-1950s, American scholar Wendell Smith first proposed the concept of customer segmentation based on the heterogeneity theory of customer demand. He believes that market resources are limited, and enterprises conduct market on this basis. Competition, so companies must clarify the direction of business and development model, according to customer behavior attributes, consumption practices, consumption concepts, potential needs, etc. to complete group
segmentation, in order to design targeted products and services in the actual market competition. In terms of researching customer needs, different customers have different needs. Only by providing differentiated products and services to meet the diverse needs of customers, can we make all
customers feel as satisfied as possible, and the entire customer. Group segmentation of group characteristics is a prerequisite for meeting the diverse heterogeneity needs. Studying customer value, different customers, the value brought to the enterprise is different, according to the amount of value that the customer can bring to the enterprise, the customer group is divided into high-value customers, low-value customers, potential value customers, etc., so customer segmentation Play an extremely important role in business management (Junhai Ma, Tiantong Xu, Wandong Lou, 2018). To study the ability of enterprises to deal with resources, the resources of enterprises are limited. How to allocate resources to customers reasonably and maximize the benefits of resources is a problem that enterprises need to seriously consider, so the statistics, analysis and subdivision of customer groups are at this time. It has become particularly important to rely on research results for resource allocation, which determines the operational efficiency of the company. Reasonable and effective resource allocation, based on the characteristics of each type of customer group, the implementation of targeted marketing activities, can maximize the value of each type of customer groups, deepen potential profit points, help companies provide decision-making basis, reduce operations Cost, improve management efficiency. The customer segmentation clarifies that consumers themselves are also diverse and cannot respond to all consumers with a single strategy (Kochetov Vadim, 2018). Customer segmentation can quickly improve the management level of the organization, find the corresponding customer market, and then adopt different marketing strategies for customers in different market segments.
Customer segmentation is a scientific analysis method. It divides customers into different customer bases. In the customer base, the customer's communication needs, consumption characteristics, and customer response to marketing are very similar. Different customer bases are independent of each other, and the characteristics vary greatly. Telecommunications companies can adopt corresponding marketing methods for each customer base, provide products or services that meet this customer base, and greatly increase marketing efficiency.
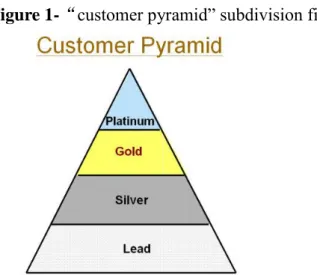
The segmentation of "Customer Pyramid" is a segmentation type in customer segmentation, as shown in the following figure: (Russell S.Winer, 2001)
Figure 1-“customer pyramid” subdivision figure
Source: California Management Review Summer, 2001
3.5.3 Customer Segmentation Technology
(1)Clustering algorithm
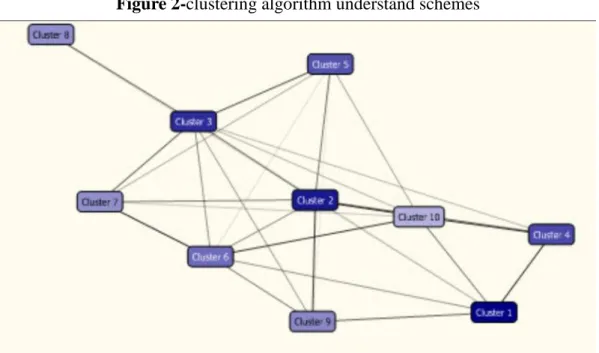
For the clustering of samples, the hierarchical clustering method is the most widely used one in statistical clustering analysis. The basic principles of system clustering are as follows:
1. set each of the n samples or indicator as a single cluster, resulting in n clusters;
2. Calculate the degree of closeness between the samples (or indicators), which is their distance; 3. Combine the two clusters with the highest degree of closeness (the closest distance) into one cluster, forming a new cluster;
4. Consider the degree of closeness between the merged cluster and other cluster, and then merge again. Repeat this process. After n-1times of merging, all samples (or indicators) become a cluster; 5. Determine the number of clusters and obtain the corresponding cluster analysis result from the above steps
The schematic diagram of clustering algorithms in data mining is shown in Figure 2: (Jukka Kainulainen, 2002)
Figure 2-clustering algorithm understand schemes
Source: Clustering Algorithms: Basics and Visualization, 2002
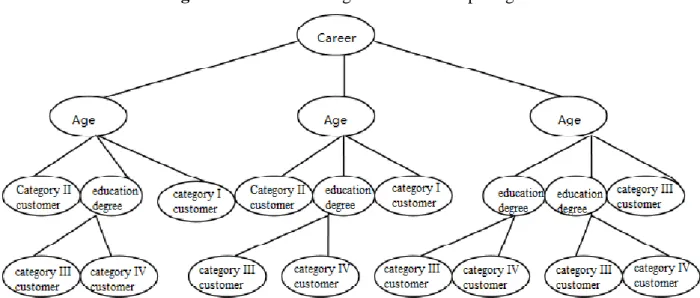
(2)Decision tree
A decision tree is a tree structure that is similar to a flowchart, in which each internal node of the tree represents a test of an attribute's value. Its branch represents the result of the test, and each leaf node of the tree represents a category. The highest node of the tree is the root node. A path from the root node to the leaf node of the decision tree forms the category prediction for the corresponding object. Decision trees can be easily converted to classification rules.
Data classification operations of the decision tree usually are made of two steps:
1) Find a suitable representation model of the mapping function H: f (X) → C representation model based on the given training set. This step is often referred to as the model training phase.
2) Use the category of the function model completed in the previous step to predict the type of data, or use this function model to describe each type of data in the data set to form a classification rule. The following figure shows the application of the decision tree algorithm in data mining: (Yishay Mansour, 2011)
Figure 3-decision tree algorithm for example figure
Source: Decision Tree: Building, 2011
(3) Factor analysis
① The creation of Factor analysis
In 1904, Charles put forward the theory of factor analysis as he studied the theory of factor analysis all his life and achieved great results. The development of factor analysis theory is based on
principal component analysis theory, the principle of which is to conclude different variables into several factors, and then to study the influence of these factors on indicators that can be measured, so that factors can be regarded as the basis of the variables classification. (Dimitris Panaretos, George Tzavelas, Malvina Vamvakari, Demosthenes Panagiotakos, 2017)
② The mathematical model of factor analysis
First we have to measure the correlation coefficient matrix between different variables, and the correlation between them. Then we have to select the factors and the requirement is that they can represent all the variables and the number is limited. Then we group the variables and the variables of the same group have high correlation. Any variable can be shown using a linear combination of common factors. In this way, the number of variables is reduced, and all variables can be analyzed using several factors.
③ Notes for factor analysis
The larger the amount of sample of the factor analysis, the better, as the conclusion obtained is more reliable. The number of samples is at least five times the number of variables. If it's more than ten times, better analysis results can be gained.
The Bartlett sphere test can be used to detect the correlation between factors. (Anna B. Costello, Jason W. Osborne, 2005)
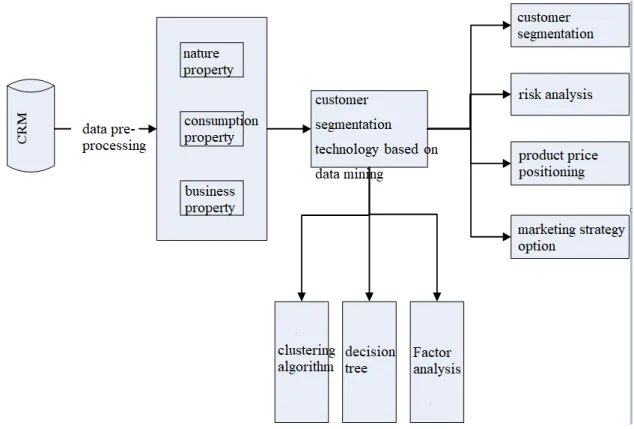
3.5.4 The implementation model of Customer Segmentation
Figure 4 is a model diagram of a customer segmentation function based on data mining. (Yun Chen, Guozheng Zhang, Dengfeng Hu, Shanshan Wang, 2006)
Figure 4-the figure of customer segmentation function model based on data mining
Source: Customer segmentation in customer relationship management based on data mining, 2006
3.5.5 Customer segmentation in telecom marketing
(1) Group characteristics of telecom customers.The market of the telecommunications industry is
customer-centric, and the behavioral attributes of users are very characteristic. Only by first understanding the characteristics of telecom customers can they be subdivided into group.
①Telecommunications companies need to maintain users with sustainable spending power because of their sustainability, which is a particularly important feature of the telecommunications industry. ②The difference in customer consumption of telecom companies is obvious, covering two broad categories, the first is based on customer groups and the second is distributed users. These two types of users differ in nature and effectiveness, and service strategies are different.
telecom companies need to analyze, such as customer spending behavior, customer value, and
customer loyalty.(Salman Ahmad Awan & Muzafar Said, 2011)
(2) Telecommunications customer segmentation design goal based on data mining.In the design
process of telecommunications customer segmentation based on data mining, the objectives can be summarized as follows:
①Customer classification: There are differences in customer groups. Different customers bring great difference to the company's revenue. Identifying various customer groups can complete group classification according to their consumption behaviors and habits, and can understand the overall composition of customers. And characteristics.
②Feature Analysis: Collect customer behavior data to help companies conduct business analysis, such as the ratio of new customers to old customers, brand recognition of different levels of customers to the company, and contribution to the company's revenue.
③Market Forecast: Establishing a forecasting model to predict the future consumption behavior of customers will help guide marketers to develop more accurate market strategies. The statistical tools in the model are usually used to analyze the customer's consumption behavior attributes, predict the next market actions that consumers may carry out, and carry out targeted marketing activities. ④ Auxiliary marketing: deepen the real needs of customers, meet customer expectations of sales services, mobilize sales channels to develop marketing strategies to maximize customer value. ⑤Targeted Services: Understand customer preferences for products and provide products and services to customers.
⑥ Price Positioning: Many customers are sensitive to price. Companies need to understand the customer's ideas and use price strategies to respond to customer needs. (S.M.H. Jansen, 2007)
Chapter 4 Data Analysis by Applying SPSS Software
This graduation project adopted SPSS software to analyze the usage in telecom customers. Data sources mainly included 5 Excel spreadsheets: Basic information, call information, short messages (SMS) information, cost information and other business information in the targeted telecom customers.4.1 Design analysis and research hypotheses
Descriptive statistics, factor analysis, cluster analysis, discriminant analysis and other methods were adopted to analyze relevant data of telecom customers in this paper, so as to obtain the demographic characteristics of current telecom customers in our country and service features of SMS, customized ring back tone (CRBT), etc. Furthermore, it is expected to provide operators with reasonable
suggestions for business improvement and potential customer discovery. In addition, the customer loss model was established to determine the possibility of customer loss. Besides, several
characteristics of the lost telecom customers and related reasons for the loss were understood through this model.
On this section will be made the sum of all the research hypotheses. Later on, at the results analysis section, these hypotheses will be set for evaluation and discussion.
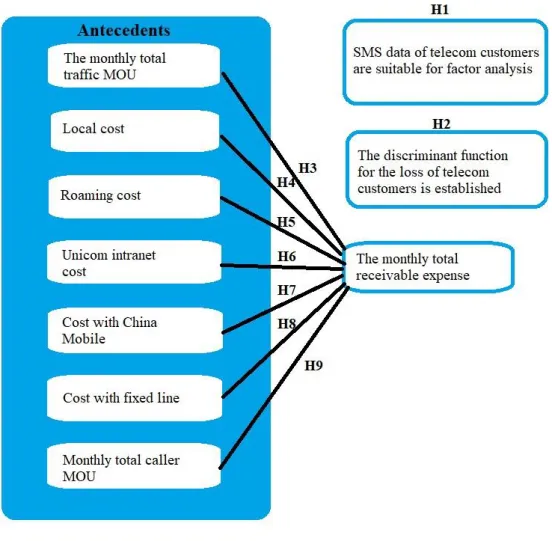
Table 1-Summary of the Research Hypotheses
Hypotheses Description
H1 SMS data of telecom customers are suitable for factor analysis.
(The data of telecom customers’ SMS can be used for factor analysis and can achieve good results )
H2 The discriminant function for the loss of telecom customers is established.
(The discriminant equation for the loss of telecom customers is valid and can effectively explain the reasons for telecom customers loss)
H3 The monthly total traffic MOU has a positive impact on the monthly total
receivable expense.
(The longer customers call monthly, the higher their total expense will be).
(The more customers use local call service, the higher their total expense will be).
H5 Roaming cost has a positive impact on the monthly total receivable
expense.
(The more customers use the mobile phone roaming service, the higher their total expense will be).
H6 Unicom intranet cost has a positive impact on the monthly total receivable
expense.
(The more customers use China Unicom intranet service, the higher their total expense will be).
H7 Cost with China Mobile has a positive impact on the monthly total
receivable expense.
(The more customers use China Mobile service, the higher their total expense will be).
H8 Cost with fixed line has a positive impact on the monthly total receivable
expense.
(The more customers use fixed line, the higher their total expense will be).
H9 Monthly total caller MOU has a positive impact on the monthly total
receivable expense.
(The longer customers call someone else, the higher their total expense will be).
Figure 5-Conceptual Model and Research Hypotheses
Source: The Author, 2018
4.2 Steps of the Investigation
The methodological options used at each step of the investigation were as follows:
(1)the descriptive statistics was adopted to analyze the customers’ demographic and business information characteristics; (2)the factor analysis was used to analyze the customers’ SMS information; (3)Pearson correlation regression analysis was adopted to test the impact of various business characteristics of customers on the customers’ expense; (4)chi-square analysis was used to study the impact of customers' age, gender and other attributes on the selection of package of the customers; (5)at last, discriminant analysis was adopted to build the customers loss model to predict if customers will be lost or retained.
The investigation began with the literature review to learn about the similar research in the field of telecommunications concerning the same issue. The reason for this is to make more effective and scientific suggestions for the development of telecom companies.
Then, it was important to select suitable analysis method according to the characteristics of the data and verify the analysis results to ensure the accuracy of the conclusions. Therefore, defining the field of analyze, the sample, the observation and data collection instruments was necessary. The study aspired to better understand the inherent laws of the telecom market business and obtain a control method for telecom customer management risk.
Building the observation instruments (data collection) was oriented by the data analysis methods such as descriptive statistics and factor analysis, as on one hand the goal was to get a deeper analysis of the topic in case and on the other hand to establish generalizations to other universes.
4.3 Paradigm and Data Collection Methodology
The data samples of the study were mainly from China's two major telecomm companies: China Mobile and China Unicom. From the two companies, 4126 data samples were collected, which consisted of 2942 male samples and 1184 female samples. And the data range mainly covered the basic information, SMS, call, cost and other business information of telecom customers, which provided a good data foundation for studying the demographic characteristics and business characteristics of telecom customers.
For this research descriptive statistics, factor analysis, regression analysis and chi-square analysis were used.
Maike Rahn (2013) stated that variable relationships for complex concepts such as socioeconomic status or psychological scales can be investigated effectively by factor analysis, which allows researchers to investigate concepts that are not easily measured directly.
According to Amy Gallo (2015), regression analysis is an effective way to sort out which of those variables does indeed have an impact. The questions such as “which factors matter most?” and “how do those factors interact with each other?” can be answered.
Therefore, for this investigation, descriptive statistics, factor analysis, regression analysis and chi-square analysis were adopted to study the demographic characteristics and business characteristics of telecom customers.
4.4 The Exploratory study and methodological options
Britt Hallingberg (2018) refers that “Exploratory studies, often termed pilot and feasibility studies, are a key step in assessing the feasibility and value of progressing to an effectiveness study”.
G McLachlan (2004) stated that discriminant analysis was mainly concerned with the relationship between a categorical variable and a set of interrelated variables which would enable the researcher to examine whether significant differences exist among the groups, in terms of the predictor
variables.
The purpose of this study was to analyze the key factors that determine whether customers will be lost or retained by using discriminant analysis, these factors were mainly: (1) Non-fixed monthly
fee; (2)Fixed monthly fee; (3) Monthly total called MOU; (4) Total long-distance and roaming
MOU; (5) Point-to-point SMS; (6) China Unicom MMS.
The exploratory study combined a discriminant analysis and an accuracy test. The discriminant analysis´s intention was to build a customer loss model to predict if customers will be lost or retained. And the purpose of accuracy test was to verify the accuracy of the discriminant model.
4.5 Demographic characteristics of telecom customers 4.5.1 Sex characteristics
The sex ratio characteristics of telecom customers were shown in Table 1 in APPENDIX 1. As shown in Table 2, among the enrolled 4,126 telecom customers, there were 1,184 females and 2,942 males, accounting for 28.7% and 71.3% of the total subjects, respectively. ③From this perspective, the majority of telecom customers were males. The proportion of males was about 2 times that of females.
4.5.2 Age characteristics
The age distribution characteristics of telecom customers were shown in Table 1 and Figure 1 in APPENDIX 2. It could be found that among the 4,126 telecom customers, the age of customers was concentrated in 20-60 years old, with 3,919 customers accounting for 95% of the total subjects; the proportion of customers, aged just 40, accounted for the largest percentage, with 165 cases (4%). The youngest customers were 9 years old, and the oldest was 107 years old, with one case in each group. In view of this, telecom customers were mainly youth and middle-and-old-aged people. The proportion of children and the elderly was relatively small in the included subjects.
4.6 Business information of telecom customers 4.6.1 Information about packages
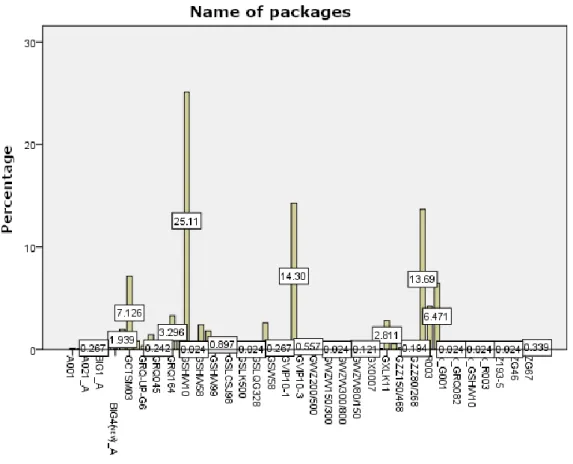
Figure 6-Information about the selected packages of customers
Source: The Author, 2018
The information about packages selected by telecom customers was shown in Figure 6. Among the 4,126 telecom customers, GSHW10 package was the major choice and topped the list, with 1,036 people accounting for 25.11% of the total number, followed by the selection of GVIP10-2 package, with 590 subjects (14.3%). In this regard, telecom customers had a clear preference for the selection of packages, of which GSHW10, GVIP10-2 and other kinds of packages were most popular.
However, there were also corresponding customers groups in favor of the remaining packages with a small proportion.
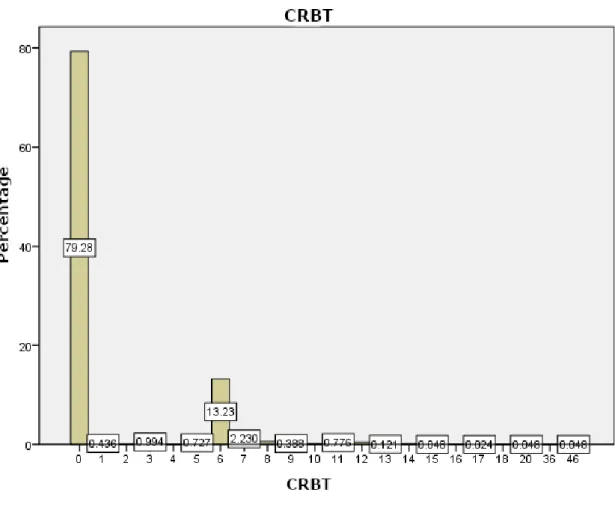
4.6.2 Information about CRBT service
Figure 7-Consumer expenditure information about CRBT service
Source: The Author, 2018
Figure 7 provided the consumer expenditure information about CRBT service of telecom customers per month. Among the 4,126 telecom customers, there were 3,271 people who did not order the CRBT service, with the largest proportion accounting for 79.28%. There were 546 people who spent CNY 6 per month to order the CRBT service, with the second proportion accounting for 13.23%. The remaining 7.49% subscribers spent money, ranging from CNY 1 to CNY 46, to order the CRBT service monthly with relatively uniform distributions. Therefore, most of the telecom customers were not keen on the CRBT service. Only a small number of people were the fans of the CRBT service, suggesting that the potential market of the business is huge and operators can further develop the market of this service.
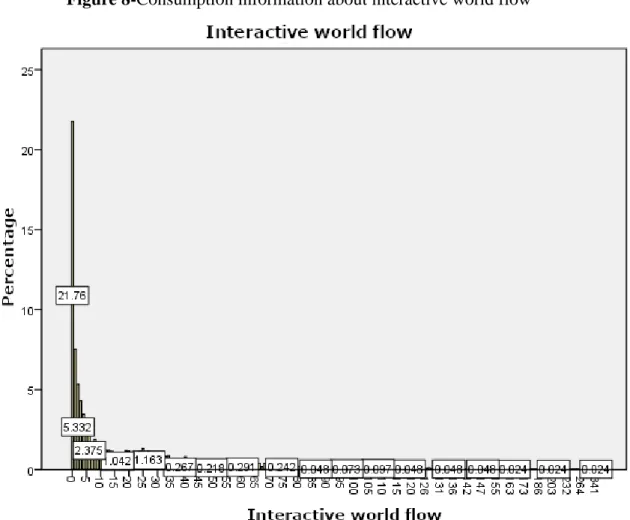
4.6.3 Information about interactive world flow
Figure 8-Consumption information about interactive world flow
Source: The Author, 2018
Figure 8 presented consumer information about interactive world flow of telecom customers per month. Among the 4,126 telecom customers, the majority did not use interactive world flow with 898 people accounting for 21.76%. Coming in second, there were 311 (7.5%) users who spent CYN 1 on interactive world flow. The remaining 70.74% users spent money, ranging from CNY 2 to CNY 99, on interactive world flow per month with relatively uniform distributions. Obviously, most of the telecom customers used the interactive world flow, however, there were significant difference in the consumer habits of different users. It indicates that the consumer habits need to be cultivated. However, it is necessary to add that the consumption habits of telecom customers have changed dramatically due to the stale data. Besides, the above conclusion was obtained based on the data mined from the existing data.
4.7 Factor analysis results of SMS of telecom customers 4.7.1 Variables selection of factor analysis for SMS
In order to further analyze the related characteristics of cost factors, SPSS19 software was adopted for factor analysis. The 5 selected variables were: ①The number of China Unicom's SMS, ②The number of China Mobile’s SMS, ③The number of China Telecom’s SMS, ④The number of China Unicom's MMS, and ⑤CRBT.
4.7.2 KMO and Bartlett’s test of sphericity (Testing the Research Hypotheses)
H1: SMS data of telecom customers are suitable for factor analysis Table 2-KMO and Bartlett’s test
Value of test items Kaiser-Meyer-Olkin measurement of
sampling sufficient degree 0.567
Bartlett’s test of sphericity
Approximate Chi-square value 636.772
df 10
Sig. 0
Source: The Author, 2018
In order to test whether the data were suitable for factor analysis, KMO test and Bartlett’s sphericity test were carried out in SPSS software. When the value of KMO test is more than 0.5 or the P-value of Bartlett’s sphericity test is less than 0.05, it indicates that data are suitable for factor analysis. Table 4 provided the results of KMO and Bartlett’s sphericity test for the SMS data of telecom customers. As shown in Table 2, the KMO test value of the selected data was 0.567>0.5, which belonged to an acceptable range that was suited for factor analysis. It is suitable for factor analysis when Sig=0.000<0.05.Therefore, hypothesis 1 confirms.
4.7.3 Common factor variance
Table 3-Common factor variance
Initial Extraction
The number of China Unicom's SMS 1 0.58
The number of China Mobile’s SMS 1 0.594
The number of China Telecom’s SMS 1 0.545
The number of China Unicom's MMS 1 0.556
CRBT 1 0.629
Extraction method: Principal component analysis
Source: The Author, 2018
One of the major tasks of factor analysis is to concentrate the original variables. Table 3 showed the common factor variance of the common factor for the original variable. As shown in Table 3, the common factor extracted was higher than 50% for the original information. The results revealed that the overall effect was ideal, and the loss rate of information was rarely low in each variable, indicating that the analysis results were scientific and representative.
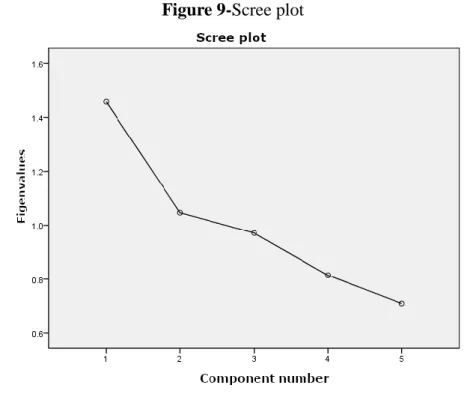
4.7.4 Total variance of interpretation
Table 4-Total variance of interpretation
Ingredi ent
Initial eigenvalues
Extraction sums of squared loadings
Rotation sums of square loadings Total % of variance Cumulativ e % Total % of variance Cumulativ e % Total % of variance Cumulative % 1 1.458 29.151 29.151 1.458 29.151 29.151 1.313 26.265 26.265 2 1.047 20.937 50.087 1.047 20.937 50.087 1.191 23.822 50.087 3 0.971 19.423 69.51 4 0.815 16.291 85.801 5 0.71 14.199 100
Source: The Author, 2018
As illustrated in Table 4, the cumulative variance contribution rate of the first two factors reached 50.087%, suggesting that the represented information had been able to fully display the majority of the original observed variables. Therefore, the first two common factors of F1 and F2 were selected as the common factors to replace most of the original information.
Figure 9-Scree plot
Source: The Author, 2018
root of the first two common factors was greater than 1, showing the feasibility of selecting the first two common factors for analysis.
4.7.5 Component matrix
Table 5-Component score coefficient matrix
Component
1 2
The number of China Unicom's SMS 0.596 -0.106
The number of China Mobile’s SMS 0.57 0.035
The number of China Telecom’s SMS 0.295 -0.034
The number of China Unicom's MMS 0.011 0.614
CRBT -0.12 0.685
Extraction method: Principal component analysis
Rotation method: The orthogonal rotation method with Kaiser standardization.
Source: The Author, 2018
Component score coefficient matrix was shown in Table 5. In the matrix presented in Table 5, the second factor F2 had a larger load in the number of China Unicom's MMS and CRBT. Therefore, the second factor F2 could be summed up as the factor reflecting MMS and CRBT. Furthermore, there was a larger load of the first factor F1 in the number of China Unicom's SMS, the number of China Mobile’s SMS, and the number of China Telecom’s SMS. Therefore, the first factor F1 could be interpreted as the number of SMS.
Therefore, we were able to draw the conclusion with confidence: The SMS attributes of telecom customers could be characterized by F5 (Common factor of SMS) and F6 (Common factor of China Unicom's MMS). The calculation formulas of F5 and F6 were as follows:
F5= 0.596*The number of China Unicom's SMS+0.570*The number of China Mobile’s SMS+0.295*The number of China Telecom’s SMS+0.011*The number of China Unicom's MMS-0.120*CRBT
F6= -0.106*The number of China Unicom's SMS+0.035*The number of China Mobile’s SMS-0.034*The number of China Telecom’s SMS+0.614*The number of China Unicom's MMS-0.685*CRBT
4.8 Pearson correlation regression analysis of telecom customer expense information
In order to analyze the relationship between the variables proposed on the model and test the research hypotheses it was used the Pearson correlation coefficients. Its values measure the
relationship between the variables set for study and vary between 1 (perfect direct relationship) and – 1 (perfect inverse relationship); in cases which they are null (0), it means that there isn´t any association between the components in question.
The intensity of the Pearson correlation coefficient is as following:
Table 6-Pearson correlation coefficient intensity
Intensity Interval
Non - 0.09 to 0.0 0.0 to 0.09
Low - 0.3 to - 0.1 0.1 to 0.3
Medium - 0.5 to - 0.3 0.3 to 0.5
High - 1.0 to - 0.5 0.5 to 1.0
Source: The Author, 2018
Next, the research hypotheses tests will be settled in order to validate the conceptual model in study.
H3: The monthly total traffic MOU has a positive impact on the monthly total receivable expense.
Table 7-Pearson correlation regression analysis result
the monthly total receivable expense
R P
monthly total traffic MOU 0.747 0.000
Source: The Author, 2018
The concept of “monthly total traffic MOU” means that the total time of customer’s call monthly. (MOU is the abbreviation of “minutes of usage”) The high intensity of the Pearson correlation coefficient (0.747 is between 0.5 and 1.0) and sig = 0.000 < 0.05 demonstrates apositive relationship between the monthly total traffic MOU and the monthly total receivable expense.
Therefore, Hypothesis 3 confirms,which means the longer customers call monthly, the higher their
total expense will be.
H4: Local cost has a positive impact on the monthly total receivable expense. Table 8-Pearson correlation regression analysis result
the monthly total receivable expense
R P