Revista Brasileira de Estudos Regionais e Urbanos (RBERU) v. 13, n. 2, p. 183-200, 2019
http://www.revistaaber.org.br
ANALYSIS OF THE EFFECT OF TERRITORIAL FACTORS ON REGIONAL INNOVATION IN THE STATE OF SÃO PAULO, BRAZIL*
Suelene Mascarini
Department of Science and Technology at University of Campinas E-mail: [email protected]
Renato Garcia
Institute of Economics at University of Campinas E-mail: [email protected]
José Eduardo Roselino
Department of Geography, Tourism and Humanities at Federal University of São Carlos E-mail: [email protected]
ABSTRACT: This paper examines the geography of innovation in the São Paulo micro-regions. Using data on innovation inputs and outputs at the regional level, this paper examines how territorial factors affect innovation in the regions of the state of São Paulo, Brazil. Previous studies show that local innovation is linked to the quantity and quality of innovative inputs, and the main characteristics of regions are configured as regional driving forces of innovation. However, most studies on this subject have focused on developed countries; few studies have examined developing countries. In this way, this paper presents new empirical evidence on the role of territorial factors in fostering innovation in Brazilian regions. The main results show that local R&D expenditures and the local externalities generated by diversified industry and social filters are the main drivers of regional innovation.
Keywords: Geography of innovation; Knowledge production function; Territorial factors. JEL Codes: O31; O18; R12.
ANÁLISE DOS EFEITOS DOS FATORES TERRITORIAIS DA INOVAÇÃO REGIONAL NO ESTADO DE SÃO PAULO
RESUMO: Este artigo avalia a geografia da inovação nas microrregiões paulistas. Ao utilizar dados sobre insumos e resultados da inovação em nível regional, este artigo examina como os fatores do território afetam a inovação regional no estado de São Paulo. Estudos anteriores mostram que a inovação local está relacionada à quantidade e qualidade de insumos inovadores, de modo que as características das regiões se configuram como forças impulsionadoras da inovação regional. Entretanto, a maioria desses estudos é desenvolvida para países desenvolvidos, poucos estudos têm tratado dos países em desenvolvimento. Dessa forma, este artigo apresenta novas evidências empíricas sobre o papel dos fatores territoriais na promoção da inovação nas regiões brasileiras. Os principais resultados mostram que os gastos com P&D e as externalidades locais geradas pela indústria diversificada, e a qualificação da mão de obra local são os principais impulsionadores da inovação regional.
Palavras-chave: Geografia da inovação; Função de produção do conhecimento; Fatores do território. Classificação JEL: O31; O18; R12.
1. Introduction
Innovation is unequally distributed among regions in Brazil, as well as in several other countries. This inequality is frequently attributed to differences in the quality and quantity of innovation inputs, such as R&D efforts and human capital. In addition, the literature indicates that fostering innovation is related to location since the agglomeration of innovation inputs, proximity effects, and local knowledge spillover effects affect innovation (AUDRETSCH; FELDMAN, 1996; CRESCENZI; RODRÍGUEZ-POSE; STORPER, 2007, 2012; JAFFE, 1986).
Previous studies have addressed the issue of regional innovation by examining developed countries (AUDRETSCH; FELDMAN, 1996; CRESCENZI; RODRÍGUEZ-POSE; STORPER, 2007; JAFFE et al., 1993). However, the lack of understanding of the spatial development of innovation in developing countries, such as India and China (CRESCENZI; RODRÍGUEZ-POSE; STORPER, 2012), Russia (CRESCENZI; JAAX, 2016), and Mexico (RODRÍGUEZ-POSE; VILLARREAL PERALTA, 2015), has become a subject of concern. Despite the increasing concern over the relationship between innovation and location in developing countries, empirical evidence for the main drivers of the innovation gap among these countries’ regions, based on systematic, large-scale and quantitative data, is still lacking (CRESCENZI; RODRÍGUEZ-POSE; STORPER, 2012).
Hence, the main aim of this paper is to investigate how territorial factors affect regional innovation by applying this subject to the state of São Paulo. Some studies have analysed the innovation gap at the country level (ALBUQUERQUE, 2007) and the spatial distribution of the main indicators of innovation (GARCIA; ARAUJO; MASCARINI, 2013; GONÇALVES; ALMEIDA, 2009). However, a gap remains in our understanding of how the spatial distribution of innovative inputs and the role of territorial factors affect innovation at the regional level.
This paper focuses on the geography of innovation in Brazil by presenting new empirical evidence on how territorial factors can shape the spatial distribution of innovation at the regional level. To do this, we analysed the state of São Paulo by using data at the micro-regional level, which corresponds to the EU NUTS-3. The state of Sao Paulo is located in the south-eastern part of the country and accounts for 35% of the Brazilian GDP and approximately 58% of the Brazilian R&D expenditure (2005 data from the Brazilian Institute of Geography and Statistics – IBGE). This work is innovative in the use of regional R&D expenditures because previous studies in Brazil have used proxies for regional R&D efforts. In addition, our analysis considered a new driving factor of innovation at the regional level: the role of university-industry collaboration. The main assumption is that the level of local innovation is linked to the quantity and quality of the level of local innovation inputs and to specific regional characteristics, such as agglomeration, diversification of local productive structures, knowledge spillovers and relationships among players.
This paper is organized in six sections, excluding this introduction. The second section presents the main conceptual debates regarding the geography of innovation. Section three presents a brief description of the distribution of innovation activity in the micro-regions of São Paulo. Section four presents the empirical model, variables and proxies. Section five discusses the effects of territorial factors. Finally, section six presents the final remarks.
2. Main conceptual remarks
2.1. Relation between innovation and territory
The territorial dynamics of innovation are gaining increasing attention in the debate on the geography of innovation. The main concern in this debate is the understanding on how territorial factors affect innovation and how firms benefit from local knowledge spillovers as well as knowledge-generation centre agglomeration. Since Jaffe’s pioneering study, several authors have found positive relations between local knowledge flows and firms’ innovation at the local level. The empirical evidence presented in these studies allowed for the identification of the role of local
knowledge spillovers as well as their importance for fostering innovation (AUDRETSCH; FELDMAN, 1996; JAFFE, 1986, 1989). Some of these studies have used the knowledge production function, which can correlate innovative inputs and outputs. The main assumption is that the clustering of the major inputs for innovation, such as R&D expenditures, the level of human capital accumulation, and the structure of local academic research are the main reasons for the innovation gap among different regions (CRESCENZI; RODRÍGUEZ-POSE; STORPER, 2007; PONDS; VAN OORT; FRENKEN, 2010; SINGH; MARX, 2013; THOMPSON, 2006).
In addition to the usual innovative inputs, territorial factors can also play an important role in fostering innovation at the local level. The spatial organization of main sources of new knowledge is another factor that affects the extent of localised knowledge externalities, which can also affect the level of innovation output. Studies on the geography of innovation have also emphasized the role of innovation input clustering, knowledge spillovers and proximity effects, which includes the agglomeration and specialization patterns of the local productive structure (CRESCENZI; RODRÍGUEZ-POSE; STORPER, 2007). In general, firms located geographically closer to knowledge-generating centres can perceive a significant competitive advantage of innovation because they benefit from local knowledge externalities and from wider possibilities for interactive learning (AUDRETSCH; FELDMAN, 1996; FRANCO; MARZUCCHI; MONTRESOR, 2014; GARCIA; ARAUJO; MASCARINI, 2013; GERTLER, 2003; JAFFE, 1989; LAURSEN; REICHSTEIN; SALTER, 2011; STORPER; VENABLES, 2003).
Three sets of factors are normally noted as the main drivers of regional innovation. First, innovative performance is a result of the returns on firms’ in-house investments in innovative activities, such as R&D expenditures and human capital (AUDRETSCH; FELDMAN, 1996; JAFFE, 1986). The second set of factors is related to main territorial conditions that emerge from agglomeration economies and local knowledge spillovers (ACS; ANSELIN; VARGA, 2002; CARLINO; CHATTERJEE; HUNT, 2007; GLAESER et al., 1992). Externalities that emerge from territorial conditions are attributable to the clustering of firms and skilled workers, which have positive effects on the creation and diffusion of new knowledge (CRESCENZI; RODRÍGUEZ-POSE; STORPER, 2007; GLAESER et al., 1992; STORPER; VENABLES, 2003). Finally, a third set of variables emphasizes local-level capabilities, particularly within science and technology (S&T) institutions, such as universities and public research institutes, which shape the regional innovation system (ACS; ANSELIN; VARGA, 2002; ASHEIM; GERTLER, 2009; COOKE, 2001; DE FUENTES et al., 2015; JAFFE, 1989).
In addition, agglomeration externalities can occur in places with a diversified or specialized local production structure. Following Marshall, concentrating on more specialized production structures that operate mainly in a specific industry will generate externalities that are commonly called Marshallian externalities (BEAUDRY; SCHIFFAUEROVA, 2009; MARSHALL, 1920). In contrast, according to Jacobs’s view, the concentration of diverse industries encourages imitation, knowledge sharing and recombination of ideas and practices among complementary agents (JACOBS, 1969). Therefore, externalities emerge from a diverse local production structure and take the form of so-called Jacobian externalities (BEAUDRY; SCHIFFAUEROVA, 2009; GLAESER et al., 1992).
Empirical studies provide evidence supporting both perspectives. Some studies show that industrial specialization in regions is important for fostering innovation, thus highlighting the role of Marshallian externalities (CRESCENZI; RODRÍGUEZ-POSE; STORPER, 2012; VAN DER PANNE, 2004). Several other studies support Jacobs’s perspective by evidencing the positive effects of diversity on innovation (CARLINO; CHATTERJEE; HUNT, 2007; CO, 2002; FELDMAN, 1999; GLAESER et al., 1992). Other studies offer mixed evidence, because comparing two different institutional contexts shows that, in Europe, externalities spurred by diversity appear to be important drivers of innovation, whereas externalities generated by specialization are unfavourable for the dynamics of innovative regions. In another national context, that of the United States, externalities stemming from both diversity and specialization have been found to play an
important role in fostering regional innovation (CRESCENZI; RODRÍGUEZ-POSE; STORPER, 2007).
2.2. Innovation and territory in developing countries
Recently, growing concerns related to the geography of innovation in developing countries have been observed (CRESCENZI; JAAX, 2016; CRESCENZI; RODRÍGUEZ-POSE; STORPER, 2012; DE FUENTES; DUTRENIT, 2013; GONÇALVES; ALMEIDA, 2009; RODRÍGUEZ-POSE; VILLARREAL PERALTA, 2015). In many countries, empirical evidence shows that agglomeration economies are crucial for promoting innovation. In China, the spatial concentration of innovation is related to agglomeration forces driven by urban population and infrastructure endowment. Evidence also shows that higher innovative performance in Chinese regions results from increased industrial specialization. In India, local innovation is linked to advantageous socioeconomic conditions and S&T investments along with local knowledge spillovers among neighbouring regions (CRESCENZI; RODRÍGUEZ-POSE; STORPER, 2012). In Russia, the main driver of regional innovation is regional R&D expenditure, and external sources of knowledge, such as inter-regional spatially mediated knowledge flows, also provide relevant innovation inputs (CRESCENZI; JAAX, 2016). In Mexico, direct R&D investment in areas with appropriate social filters is an important driver of regional economic growth (RODRÍGUEZ-POSE; VILLARREAL PERALTA, 2015).
In Brazil, the innovation system has been considered immature mainly because of the relatively small amount of industrial R&D expenditure, which results in poor innovation performance at the firm level and a low number of patent applications (ALBUQUERQUE, 2007). At the regional level, as in other developing countries, innovation in Brazil is unequally distributed across the country because a large share of Brazil’s innovation, measured by the number of patent applications, occurs in the southern region, particularly because of that region’s degree of urbanization (GONÇALVES; ALMEIDA, 2009), thus highlighting the importance of territorial factors.
Previous studies have shown that innovation and innovative inputs are not randomly distributed in Brazil, thus indicating the importance of local knowledge spillovers (ARAUJO, 2014; GARCIA; ARAUJO; MASCARINI, 2013; MONTENEGRO; BETARELLI JUNIOR, 2009; MONTENEGRO; GONÇALVES; ALMEIDA, 2011). Regions with higher university research efforts and a higher degree of agglomeration tend to be more innovative (MONTENEGRO; BETARELLI JUNIOR, 2009). Specialized and diversified local production systems and higher educational level of the industrial workforce also play an important role in innovation, supporting the ability of local firms to transform new knowledge into new products and processes (MONTENEGRO; GONÇALVES; ALMEIDA, 2011). Innovation is also affected by local levels of industrial and university R&D, urban agglomeration and local productive structure (ARAUJO, 2014). These studies have been important for understanding how innovation is spatially shaped across Brazilian regions. However, the scarcity and limited availability of regional-level industrial R&D data represent important gaps in the literature. Thus, an important contribution of this paper is the use of data to fill this gap by using direct measures of R&D expenditures to investigate the main drivers of regional innovation in the state of São Paulo, which allows for the identification of major drivers and local factors that contribute to the innovation gap among regions.
3. Regional distribution of innovation in the state of São Paulo
Brazilian innovation is far from being equally distributed in space. As well as in other developed and developing countries, regional distribution of innovation shows a strong concentration in some regions of Brazil (GARCIA; ARAUJO; MASCARINI, 2013; GONÇALVES; ALMEIDA, 2009). There is a strong concentration in the southern part of the country, especially in the state of São Paulo, which accounts for 35% of the Brazilian GDP; 46.2%
of patent deposits in Brazil; 35.3% of innovative firms; and 58.7% of Brazilian R&D expenditures (data from IBGE, 2005).
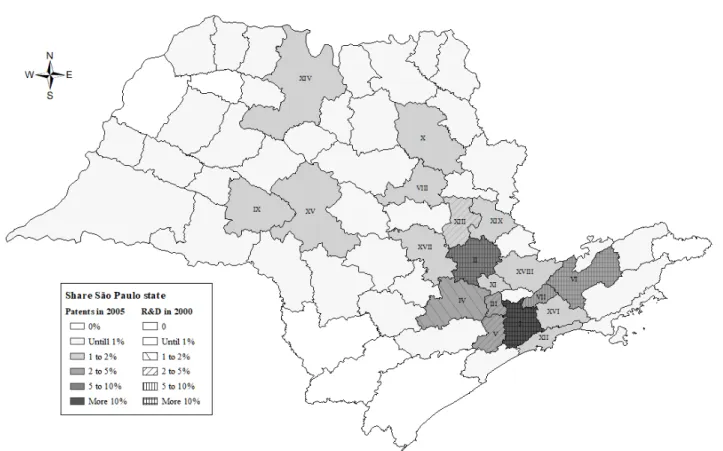
The spatial distribution of patents across micro-regions of the state of São Paulo also shows a strong tendency towards an unequal concentration in a few regions. In 2005, approximately 60% of patent applications from the state of Sao Paulo in the Brazilian Patents Office (INPI – National Institute of Industrial Property) were submitted by inventors who resided in three regions of the state: São Paulo (I), Campinas (II) and Osasco (III) (Figures 1 and 2).
Figure 1 – Distribution of total patents and R&D across micro-regions of São Paulo
Source: Authors.
Considering the spatial distribution of innovative inputs, such as total R&D expenditures, the concentration in a few regions remains the same: more than 50% of the total R&D expenditures in 2000 were made in the region of São Paulo (I), followed by Campinas (II), with a share of 12.4%, São José dos Campos (VI), 12.3%, and Guarulhos (VII), with 8.5%. The accumulated share of the total for these four regions is approximately 85%.
The distribution of R&D expenditures in the regions of the state of São Paulo is more concentrated than the distribution of the innovation output, as measured by patents, probably because part of the industrial R&D effort does not generate patents. In fact, the regional concentration of innovation output is partly due to the agglomeration of existing innovative activities in the state, especially in regions whose firms spend more on R&D than the average. These regions tend to show better innovative performance, as seen in the spatial distribution of total patents and R&D expenditures (Figure 2).
A geographic overlap between the most innovative regions of the state can be ensured in terms of the share of total patent applications and the regional distribution of R&D expenditures. In other words, some regions are more innovative than others, probably due to higher R&D expenditures. However, regions such as Marilia (IX), Ribeirão Preto (X), São Carlos (VIII), Osasco (III), Sorocaba (IV) and Santos (XIII) have higher innovative performance than other regions, even though they exhibit lower R&D expenditures. For example, in 2005, São Carlos (VIII) and Marilia (IX) owned 2% of patents in the state, ranking them 8th and 9th, respectively. However, regarding total R&D expenditures, São Carlos (VIII) and Marilia (IX) ranked 18th and 20th, respectively, representing less than 0.3% of R&D in 2000. This suggests that other factors affect regional innovative performance. For example, proximity effects can be an important driver of regional innovation because certain regions, such as Santos (XIII), Sorocaba (IV) and Osasco (III), can benefit from their proximity to the state capital, the city of São Paulo, whose micro-region spends
0 20 40 60 80 100 C u m u la ti v e p e rce n ta g e
Regions' Raking - 63 micro-regions (less to most) Patents in 2005 R&D in 2000
the largest amount on R&D in the entire state. This indicates the occurrence of regional knowledge spillovers.
Figure 2 – Patents and R&D location
Source: Authors.
Based on this descriptive evidence, it is possible to estimate an empirical model to investigate both the relationship between innovation and space and how territorial factors affect innovation at the regional level.
4. Territorial factors of local innovation
The empirical analysis is based on the knowledge production function formalized by Griliches (1979) and adapted by Jaffe (1989) in the following form:
log = log + log + [log + log ] + (1)
In this equation, P is the patent measure; I is industrial R&D expenditures; U is academic research; C is the measure of the geographic coincidence of university and industrial research; ε is the error determined in the region (states); i, k are the technological areas; and t is time.
Jaffe’s variant of the knowledge production function was extremely important for the development of studies related to the geography of innovation because it transferred the unit of observation from the firm to the geographical level. Therefore, it relates to local knowledge spillovers and the geographical proximity of actors involved in innovation (AUDRETSCH; FELDMAN, 1996; CARLINO; CHATTERJEE; HUNT, 2001; CRESCENZI; RODRÍGUEZ-POSE; STORPER, 2007, 2012).
We set up the database using secondary data collected from several sources (INPI, PINTEC, RAIS and IBGE). We restricted the analysis to the state of São Paulo at the micro-regional level for
two main reasons. First, the state accounts for a high share of the country’s total innovation efforts. Second, due to the scarcity and limited access to innovation data at the regional level, we were able to gather R&D regional-level data only for the state of São Paulo. The analysis is based on 63 micro-regions covering the entire state of São Paulo. The delimitation of the period is also due to the availability of data. Thus, we estimated the model for 2000-2005, since the results of innovation were measured in 2005, and innovative efforts, such as R&D, were measured in 2000.
To measure innovation, several studies highlight patents as a good proxy. However, we must point out some limitations associated with the use of patent data as a proxy for innovation outputs, especially for developing countries, because innovative efforts of domestic firms do not necessarily generate new patents. Other proxies have also been proposed for innovation inputs. Nevertheless, several studies have used patents as a proxy for innovation. Thus, the specification of innovation should assume a highly similar form as the model presented in previous studies (CRESCENZI; RODRÍGUEZ-POSE; STORPER, 2007, 2012; JAFFE, 1989):
log = + ln , + Wln , + !" , + #$%,
+ &'()*+,, + - ) ! , + . ) , + / ) (01 , + (2) where lnPi,T is the natural logarithm of patent applications per capita granted by the Brazilian Patent Office by micro-regions i at T= 2005.
Patents, as previously mentioned, are used by several studies as a proxy for innovation (CARLINO; CHATTERJEE; HUNT, 2001; CRESCENZI; RODRÍGUEZ-POSE; STORPER, 2007; JAFFE, 1989). However, the use of patents as a measure of innovation has several shortcomings and limitations because it is a mechanism for appropriating the economic benefits of knowledge (ACS; AUDRETSCH, 1987). In addition, not all knowledge can be measured by patents, and patents represent only some innovation output. However, the use of patent as an outcome to measure innovation has several advantages: patents enable broad disintegration, both regional and industrial; patents can be a good measure of knowledge spillovers; and patents provide a broad basis for comparison with several studies that use them. Moreover, the reliability of patents as a proxy for innovation was tested, and the results showed that patents may be used as a fairly reliable measure of innovation and noa better alternative is not available (ACS; AUDRETSCH, 1987; CARLINO; CHATTERJEE; HUNT, 2001; CRESCENZI; RODRÍGUEZ-POSE; STORPER, 2007, 2012; FELDMAN, 1999).
Regarding the explanatory variables represented in equation 1, RDi,T-t is R&D expenditures; WRDi,T-t is the knowledge spillovers of R&D expenditures in the neighbouring regions; Agglomi,T-t is agglomeration; and SFi,T-t represents structural characteristics that would make a micro-region more innovative. Kindexi,T-t is the specialization index of the region, which shows whether it is diversified or specialized, and Colli,T-t is the density of collaboration between universities and firms. All measurements were calculated for micro-regions i of the state of São Paulo at time T-t=2000. The control variables, represented by Pi,T-t, are previous innovations, and the distance of a micro-region to the state capital (the São Paulo micro-micro-region, where the most innovative efforts are concentrated) is represented by DistCi,T-t.
The use of a temporal lag between the dependent variable (T=2005) and the explanatory variables (T-t=2000) is justified by the fact that innovation does not occur immediately, as it depends on firms’ capacity to generate innovations at a given time. Therefore, innovation inputs take time to generate an innovative result. In addition, the use of a temporal lag helps to minimize potential bias of reverse causality.
The R&D expenditure in a region, lnRD, was measured by the natural logarithm of the total R&D expenditure divided by the total number of innovative firms. The source of data was the Brazilian Innovation Survey (PINTEC)1. This variable represents the most important input of
1 PINTEC is an Innovation Survey conducted by the Brazilian Institute of Geography and Statistics (IBGE), which is the main provider of data and information about the country. However, due to the low number of firms found in some
innovation. R&D expenditure improves firms’ capacity to generate new knowledge and can give them the capacity to internalize knowledge from other sources, such as university R&D and/or other firms.
Thus, knowledge spillovers may represent an important input of regions’ innovative activity. The potential of R&D expenditure to extend beyond regional borders is represented by WlnRD in equation 1 and is calculated by spatially weighting (Wij) the natural logarithm of the R&D expenditures of neighbouring micro-regions. For spatial weighting, a row of a standardized inverse distance matrix is used in which distance, dij, the Euclidian distance between two micro-regions is, and each element is standardized by dividing it by the number of neighbours, in this case, 62, so the value of each off-diagonal element is Wij= dij-1/62. To calculate the Euclidian distance between two micro-regions, their geographical coordinates are used.
Agglomeration, Agglom, is also included in the model and is measured by urban population density, with data from the IBGE. This explanatory variable was inserted to measure the benefits of regional agglomeration as an important driver of a region’s innovative performance.
Another independent variable included in the model is Social Filter, SF, which aims to capture regional structural characteristics that shape the behaviour of the population and the ability to obtain and absorb knowledge, which would make it more prone to innovation. As underlined by the innovation systems approach, the capacity of any given region to generate and use knowledge depends on a complex set of local factors. The social filter variable used in this article is therefore made up of a set of variables available for Brazil that focuses on three main aspects: education capacity, structure of productive resources in S&T and demographic structure of the micro-region.
The educational capacity of the population, or the qualification of the workforce in the region, is measured by the share of people with higher education, Educ, using data from the Brazilian Ministry of Education. This aspect seeks to measure the accumulation of skills at the regional level.
The structure of productive resources in Science and Technology, Tecn, is measured by the share of local employees in technological occupations, according to Brazilian Ministry of Labour data2.The demographic structure of the micro-region, Age, is measured by the number of people aged between 15 and 24 years in the micro-region, using IBGE data. This variable seeks to identify trends in population dynamics, under the assumption that young people contribute to the renewal of local society that will influence the attitudes toward innovation and social change in general.
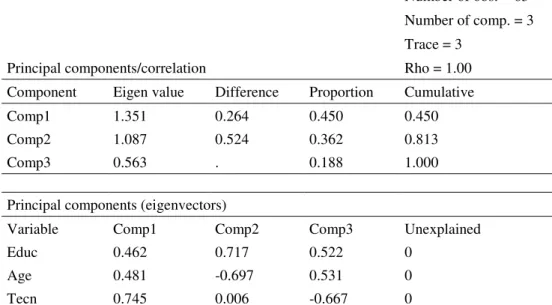
Social filter is calculated by principal component analysis, which combines the three measures in a non-correlated order of importance and describes the data variation. It should be noted that it may be necessary to incorporate more than one component, which will depend on the analysis of the component as a combination. The combination of proxies for all these different dimensions into one single composite indicator, social filter, develops a quantitative ‘profile’ of an innovation-prone regional environment, enabling a comparison of the social filter conditions of different regions across countries (CRESCENZI; RODRÍGUEZ-POSE; STORPER, 2007, 2012). Principal component analysis (PCA) shows that the first principal component alone accounts for 45% of the total variance of the original variables, and the second represents 36.6% (Table 1). From the standardized value of the original variables (Educ, Age and Tecn), using the previously listed coefficients, the score that generates the social filter index is estimated. FS1 is the first principal component, putting similar weight on the Educ and Age variables and greater weight on the Tecn variable. FS1 is the first principal component that combines the three variables, providing a similar weight on the Educ and Age variables and greater weight on the Tecn variable ($%2 = 0.4618*9: + 0.481 + + 0.745>+:, Table 1). FS2 is the second principal component and is the
of the 63 micro-regions of the state of Sao Paulo, there are problems of confidentiality of information. The availability of data provided by PINTEC was limited to 10 micro-regions and 12 groups of micro-regions. To obtain an analysis of the micro-regions as a unit, a procedure was adopted for weighting groups of micro-regional data (12) from the share of employment in the region. Thus, all variables provided by PINTEC follow this pattern.
2 Data were selected from the Brazilian classification of 94 group-level technology-related occupations: 011; 012; 019; 020; 021; 022; 023; 024; 025; 026; 027; 028; 029; 081; 082; 083. Brazilian classification follows the Standard Occupational Classification (SOC) system.
combination of the Educ and Age variables with similar but opposite weights ($%2 = 0.7178*9: − 0.697 + + 0.006>+:, Table 1).
Table 1 – Results of the principal component analysis
Principal components/correlation
Number of obs. = 63 Number of comp. = 3 Trace = 3
Rho = 1.00 Component Eigen value Difference Proportion Cumulative
Comp1 1.351 0.264 0.450 0.450
Comp2 1.087 0.524 0.362 0.813
Comp3 0.563 . 0.188 1.000
Principal components (eigenvectors)
Variable Comp1 Comp2 Comp3 Unexplained
Educ 0.462 0.717 0.522 0
Age 0.481 -0.697 0.531 0
Tecn 0.745 0.006 -0.667 0
Source: Authors.
Specialization or diversification of the micro-region is measured by the Krugman index. Represented in equation 1 by Kindex, it is calculated using Brazilian Ministry of Labour data on employment in manufacturing in the regions. The Krugman index was calculated as follows:
A()*+,, = B CD0 E, − E, , F(1ℎ E, =∑ ∑ ,∑ ,JK , ,
JK (3)
where νi,T-tk is part of sector k in region i for all businesses in this region, and νi,T-t-k is part of the same enterprise sector from all other regions different from i divided by all firms of other regions different from i. The index has a value close to zero if the micro-region is more diversified and a maximum value of 2 if more specialized.
Finally, in equation 1, lnColl represents university-industry collaborations, measured by the natural logarithm of the number of collaborations divided by the number of firms that collaborate in micro-regions. These numbers are based on data obtained from the Brazilian Ministry of Science and Technology. This variable aims at capturing the importance of collaborations between firms and universities because the basis for innovation is to increase the collaboration and flow of knowledge amongst stakeholders and the absorptive capacity of firms (FREEMAN, 1989; GERTLER, 2007; TEECE; PISANO, 1994). Moreover, university-industry collaboration encourages firms to develop the capacity to build different new linkages with more and diverse kinds of partners with whom they could not connect before, thereby continually increasing the flow of essential knowledge for innovation. University-industry collaboration is widely recognized as a factor that promotes innovation; however, few studies on the geography of innovation consider this variable in their empirical applications. Therefore, this variable can contribute decisively for understanding the geography of innovation, especially in Brazil, because firms’ R&D expenditure is relatively low in the country.
In addition to the variables presented above, two controls were added to the analysis. The first control variable, the time lag of innovative results, is designated with Pi,T-t and measured by the natural logarithm of the initial number of patents per capita when T-t=2000 in micro-region i. The main goal of incorporating this variable is to control different initial patterns of technological
capability in the region, which may also reflect differences in a region’s propensity for innovative capability.
The second control variable is the natural logarithm of the road distance between micro-region i and the state capital (the São Paulo micro-region) and is designated lnDistC in equation 1. This variable attempts to control regional differences, given the proximity of the city of São Paulo, where a significant portion of the assets of the state are concentrated.3
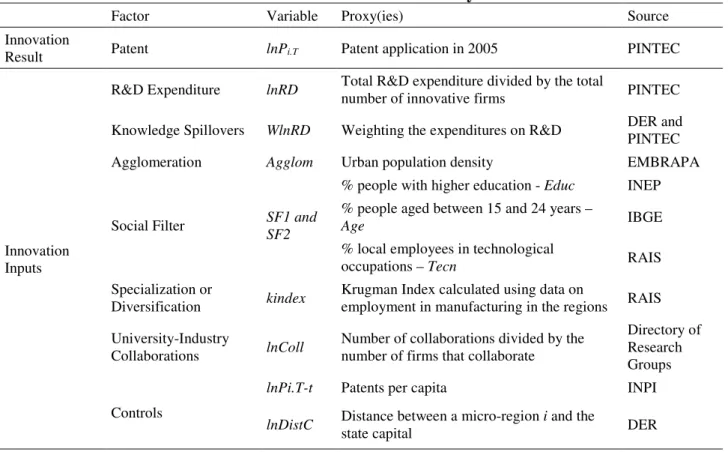
Table 2 – Variables Summary
Factor Variable Proxy(ies) Source
Innovation
Result Patent lnPi.T Patent application in 2005 PINTEC
Innovation Inputs
R&D Expenditure lnRD Total R&D expenditure divided by the total
number of innovative firms PINTEC Knowledge Spillovers WlnRD Weighting the expenditures on R&D DER and PINTEC
Agglomeration Agglom Urban population density EMBRAPA
Social Filter SF1 and
SF2
% people with higher education - Educ INEP % people aged between 15 and 24 years –
Age IBGE
% local employees in technological
occupations – Tecn RAIS
Specialization or
Diversification kindex Krugman Index calculated using data on employment in manufacturing in the regions RAIS University-Industry
Collaborations lnColl Number of collaborations divided by the number of firms that collaborate
Directory of Research Groups Controls
lnPi.T-t Patents per capita INPI
lnDistC Distance between a micro-region i and the
state capital DER
Source: Authors.
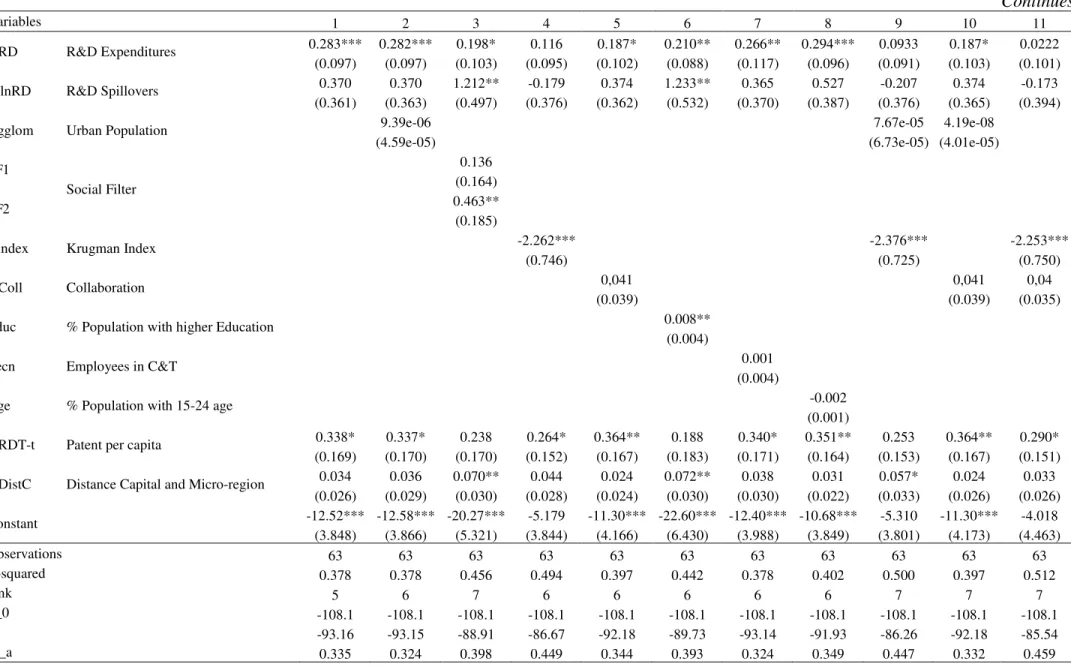
5. Results
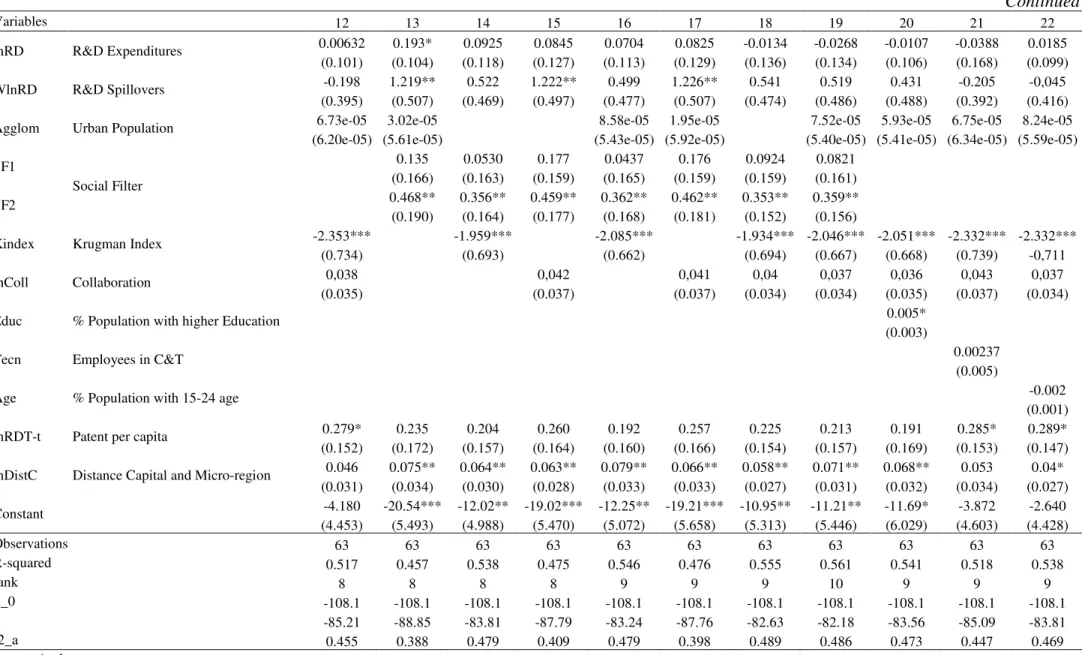
Table 3 provides the results of analysis based on 22 regressions. Local innovative efforts (i.e., R&D expenditure, lnRD), knowledge spillovers (WlnRD), the initial level of patents (lnP) and the distance from the city of Sao Paulo (lnDistC) are present in all regressions. Territorial factors, such as agglomeration (Agglom), social filters (SF1 and SF2), the Krugman index (kindex) and university-industry collaborations (lnColl), were inserted successively or sequentially until the full model was estimated (regression 19). In regressions 6-8 and 20-22, the individual components of the social filters were included separately.4
The results show that R&D expenditures have a positive and significant coefficient (regressions 1-3, 5-8, 10 and 13), indicating that regional innovation increases as industrial R&D expenditures increase. This is an expected result because industrial R&D expenditures represent the most important innovation input, although other activities also foster innovation, and this finding converges with results from previous studies in both developed and developing countries where higher levels of innovation result from greater R&D expenditures (CHARLOT; CRESCENZI;
3 To keep the observations equal to zero, before using the logarithmic transformation, we added 10-6 to the value of a variable. This procedure is used for all variables with a logarithmic transformation containing zero: ) , + 10 − 6 ; ) , + 10 − 6 ; ) (01 + 10 − 6 ; ) ! + 10 − 6 .
4 We have carried out a Lagrange multiplier (LM) test and a robust Lagrange multiplier (RLM) test for the spatial error model and the spatial autoregressive model. All test results are not significant, which suggests that the OLS robust regression used in this paper is appropriate.
MUSOLESI, 2012; CRESCENZI; RODRÍGUEZ-POSE; STORPER, 2007; JAFFE, 1989; MORENO; PACI; USAI, 2005; STERLACCHINI; VENTURINI, 2014). Nevertheless, previous studies at the regional level did not have this result, which is primarily because we are using industrial R&D expenditures at the regional level to measure innovative inputs, and such a process allows us to show the importance of industrial R&D for innovation at the regional level (MONTENEGRO; GONÇALVES; ALMEIDA, 2011). Thus, we can find a relation between regional R&D expenditures and patents, even considering that we are measuring only a share of both the efforts and the results of innovation.
The introduction of the industrial structure indicator measured by the Krugman Index or the university-industry collaboration indicator removes the significance of industrial R&D expenditures and thus may indicate the importance of territorial factors in fostering regional innovation (regressions 4, 9 11-12, 14-22). This finding confirms that, for developing countries, industrial R&D at the regional level represents only a share of the innovative efforts of local firms. Territorial factors, such as the characteristics of the local industrial structure and collaboration with universities, are also important drivers of local innovation.
Moreover, industrial R&D expenditures tend to extend beyond their own region because they are important for fostering innovation in neighbouring regions. This phenomenon is evidenced by the positive and significant coefficient of the spatial knowledge spillovers variable WRD (regressions 3, 6, 13, 15 and 17). The importance of regional knowledge spillovers is high because high R&D expenditure in a certain region affects innovation in neighbouring regions. This result is similar to findings in developed countries, i.e., in the United States and in European regions, because innovation at the local level is affected by local industrial R&D expenditures and by regional knowledge spillovers related to R&D expenditures in neighbouring regions (CRESCENZI; RODRÍGUEZ-POSE; STORPER, 2007). Therefore, regions may innovate even with low levels of R&D expenditures because the spatial concentration of R&D expenditures is higher than the geographical concentration of innovation.
The results also show that the coefficient of the agglomeration variable Agglom is not significant, which means that nothing can be inferred about the importance of agglomeration for innovation in the regions of the state of Sao Paulo. This result was also found in similar and previous studies for EU regions (CRESCENZI; RODRÍGUEZ-POSE; STORPER, 2007), in which the population density did not seem to stimulate regional innovation. This finding can be attributed to two reasons: first, there is a broader set of territorial forces that offset the positive effect of population density; second, the agglomeration in a context of low workforce mobility may encourage the pooling and stratification of inadequate skills (CRESCENZI; RODRÍGUEZ-POSE; STORPER, 2007, p. 698). Both arguments can be applied to our findings. In addition, we are using patents as a proxy for regional innovation, and the positive effects of agglomeration could be translated into forms of innovations that do not involve patents.
The coefficient of one of two components of the social filter variable SF2 is positive and significant, whereas that of SF1 is not significant. This result indicates that the presence of a set of specific local-level structural characteristics of a region is an important driver of the regional system of innovation. Therefore, structural characteristics play an important role in explaining differential innovative performance in the regions of the state of Sao Paulo. More specifically, this result suggests that the combination of a greater availability of highly qualified individuals and a lower amount of young people in the population represents an important innovation input at the regional level because SF2=0.717Educ-0.697Age+0.006Tec (see Table 1). Therefore, our result reveals that the educational level and demographic structure in São Paulo micro-regions are important factors for promoting regional innovation, while the regional share of technological occupations does not seem to stimulate innovation. The first component of the social filter, which assigns a large weight to the labour force employed in technological occupations ($% = 0.4618*9: + 0.481 + + 0.745>+:, Table 1), is not significant.
Table 3 – Robust regression - Patents per capita in micro-regions of São Paulo in 2005 Continues Variables 1 2 3 4 5 6 7 8 9 10 11 lnRD R&D Expenditures 0.283*** 0.282*** 0.198* 0.116 0.187* 0.210** 0.266** 0.294*** 0.0933 0.187* 0.0222 (0.097) (0.097) (0.103) (0.095) (0.102) (0.088) (0.117) (0.096) (0.091) (0.103) (0.101) WlnRD R&D Spillovers 0.370 0.370 1.212** -0.179 0.374 1.233** 0.365 0.527 -0.207 0.374 -0.173 (0.361) (0.363) (0.497) (0.376) (0.362) (0.532) (0.370) (0.387) (0.376) (0.365) (0.394)
Agglom Urban Population 9.39e-06 7.67e-05 4.19e-08
(4.59e-05) (6.73e-05) (4.01e-05)
SF1 Social Filter 0.136 (0.164) SF2 0.463** (0.185)
Kindex Krugman Index -2.262*** -2.376*** -2.253***
(0.746) (0.725) (0.750)
lnColl Collaboration 0,041 0,041 0,04
(0.039) (0.039) (0.035)
Educ % Population with higher Education 0.008**
(0.004)
Tecn Employees in C&T 0.001
(0.004)
Age % Population with 15-24 age -0.002
(0.001)
lnRDT-t Patent per capita 0.338* 0.337* 0.238 0.264* 0.364** 0.188 0.340* 0.351** 0.253 0.364** 0.290*
(0.169) (0.170) (0.170) (0.152) (0.167) (0.183) (0.171) (0.164) (0.153) (0.167) (0.151)
lnDistC Distance Capital and Micro-region 0.034 0.036 0.070** 0.044 0.024 0.072** 0.038 0.031 0.057* 0.024 0.033
(0.026) (0.029) (0.030) (0.028) (0.024) (0.030) (0.030) (0.022) (0.033) (0.026) (0.026) Constant -12.52*** -12.58*** -20.27*** -5.179 -11.30*** -22.60*** -12.40*** -10.68*** -5.310 -11.30*** -4.018 (3.848) (3.866) (5.321) (3.844) (4.166) (6.430) (3.988) (3.849) (3.801) (4.173) (4.463) Observations 63 63 63 63 63 63 63 63 63 63 63 R-squared 0.378 0.378 0.456 0.494 0.397 0.442 0.378 0.402 0.500 0.397 0.512 rank 5 6 7 6 6 6 6 6 7 7 7 ll_0 -108.1 -108.1 -108.1 -108.1 -108.1 -108.1 -108.1 -108.1 -108.1 -108.1 -108.1 ll -93.16 -93.15 -88.91 -86.67 -92.18 -89.73 -93.14 -91.93 -86.26 -92.18 -85.54 r2_a 0.335 0.324 0.398 0.449 0.344 0.393 0.324 0.349 0.447 0.332 0.459
Table 3 – Robust regression - Patents per capita in micro-regions of São Paulo in 2005 Continued Variables 12 13 14 15 16 17 18 19 20 21 22 lnRD R&D Expenditures 0.00632 0.193* 0.0925 0.0845 0.0704 0.0825 -0.0134 -0.0268 -0.0107 -0.0388 0.0185 (0.101) (0.104) (0.118) (0.127) (0.113) (0.129) (0.136) (0.134) (0.106) (0.168) (0.099) WlnRD R&D Spillovers -0.198 1.219** 0.522 1.222** 0.499 1.226** 0.541 0.519 0.431 -0.205 -0,045 (0.395) (0.507) (0.469) (0.497) (0.477) (0.507) (0.474) (0.486) (0.488) (0.392) (0.416)
Agglom Urban Population 6.73e-05 3.02e-05 8.58e-05 1.95e-05 7.52e-05 5.93e-05 6.75e-05 8.24e-05
(6.20e-05) (5.61e-05) (5.43e-05) (5.92e-05) (5.40e-05) (5.41e-05) (6.34e-05) (5.59e-05)
SF1 Social Filter 0.135 0.0530 0.177 0.0437 0.176 0.0924 0.0821 (0.166) (0.163) (0.159) (0.165) (0.159) (0.159) (0.161) SF2 0.468** 0.356** 0.459** 0.362** 0.462** 0.353** 0.359** (0.190) (0.164) (0.177) (0.168) (0.181) (0.152) (0.156)
Kindex Krugman Index -2.353*** -1.959*** -2.085*** -1.934*** -2.046*** -2.051*** -2.332*** -2.332***
(0.734) (0.693) (0.662) (0.694) (0.667) (0.668) (0.739) -0,711
lnColl Collaboration 0,038 0,042 0,041 0,04 0,037 0,036 0,043 0,037
(0.035) (0.037) (0.037) (0.034) (0.034) (0.035) (0.037) (0.034)
Educ % Population with higher Education 0.005*
(0.003)
Tecn Employees in C&T 0.00237
(0.005)
Age % Population with 15-24 age -0.002
(0.001)
lnRDT-t Patent per capita 0.279* 0.235 0.204 0.260 0.192 0.257 0.225 0.213 0.191 0.285* 0.289*
(0.152) (0.172) (0.157) (0.164) (0.160) (0.166) (0.154) (0.157) (0.169) (0.153) (0.147)
lnDistC Distance Capital and Micro-region 0.046 0.075** 0.064** 0.063** 0.079** 0.066** 0.058** 0.071** 0.068** 0.053 0.04*
(0.031) (0.034) (0.030) (0.028) (0.033) (0.033) (0.027) (0.031) (0.032) (0.034) (0.027) Constant -4.180 -20.54*** -12.02** -19.02*** -12.25** -19.21*** -10.95** -11.21** -11.69* -3.872 -2.640 (4.453) (5.493) (4.988) (5.470) (5.072) (5.658) (5.313) (5.446) (6.029) (4.603) (4.428) Observations 63 63 63 63 63 63 63 63 63 63 63 R-squared 0.517 0.457 0.538 0.475 0.546 0.476 0.555 0.561 0.541 0.518 0.538 rank 8 8 8 8 9 9 9 10 9 9 9 ll_0 -108.1 -108.1 -108.1 -108.1 -108.1 -108.1 -108.1 -108.1 -108.1 -108.1 -108.1 ll -85.21 -88.85 -83.81 -87.79 -83.24 -87.76 -82.63 -82.18 -83.56 -85.09 -83.81 r2_a 0.455 0.388 0.479 0.409 0.479 0.398 0.489 0.486 0.473 0.447 0.469 Source: Authors.
This result seems to be reinforced when the individual components of a social filter are assessed separately, because only a positive effect of the variable for the educational level of local population (Educ) is found, implying that high educational levels affect local innovation when considered individually. However, the age of the population (Age) and employees in technological occupations (Tecn) are not important drivers, although their combination functions as a genuine filter, which suggests a relevant synergy that affects innovation at the local level. This result differs from previous studies in developed countries, such as the United States and European regions, in which the combination and individual components were found to contribute to local innovation (CRESCENZI; RODRÍGUEZ-POSE; STORPER, 2007). In other developing countries, such as India, similar results were found because the joint effect of the social filter index is important, while the individual components do not matter as a driver of innovation at the local level (CRESCENZI; RODRÍGUEZ-POSE; STORPER, 2012).
Concerning the local industrial structure, the coefficient of the Krugman index (kindex) is negative and significant; therefore, more diversified regions whose indexes are closer to zero have better innovative performance. Innovation results in diversified regions, such as São Paulo (I), Campinas (II), and São José dos Campos (VI, Figure 2), are concentrated in both the state of São Paulo and Brazil. In addition, the introduction of this variable (kindex) removes the significance of the R&D expenditure coefficient. This result may indicate that low R&D expenditures at the local level can be compensated for by the characteristics of a diverse local industry, thereby allowing for the maintenance of high levels of local innovation. Thus, the result supports Jacobs’s perspective on the benefits of diversified industrial structures and their positive effects on innovation at the regional level and aligns with findings of other previous studies that indicated that the benefits of Jacobian externalities are important generators of innovation (FELDMAN; AUDRETSCH, 1999; FRITSCH; SLAVTCHEV, 2007). In addition, these findings in Brazil are similar to those in Europe, where regions that are more specialized seem to be persistently disadvantaged in their ability to produce innovation (CRESCENZI; RODRÍGUEZ-POSE; STORPER, 2007). However, a similar study in China found different results and showed that a greater degree of industrial specialization increases innovative performance at the local level (CRESCENZI; RODRÍGUEZ-POSE; STORPER, 2012). Thus, it is possible to ensure that the local industrial structure has a different effect on regional innovation in both developed and developing countries (BEAUDRY; SCHIFFAUEROVA, 2009). The coefficient of university-industry collaborations between lnColl is not significant, indicating that no inference was observed in the importance of collaborative projects with universities in fostering innovation as measured by the number of patent applications at the local level in the state of Sao Paulo. As noted, patents represent only a share of the total innovative outputs and many firms do not patent their innovations. Thus, this finding can be related to the use of patents as a proxy for innovation since many collaboration projects with university can generate other types of innovation, such as new products and improvements to manufacturing processes.
Moreover, the introduction of the university-industry collaboration variable (lnColl) removes the significance of the R&D expenditure coefficient. This result may indicate that low industrial R&D expenditures at a local level can be somehow compensated by an interaction with academic research, which is an agent of the regional innovation system. Fostering certain types of relationships among innovation actors across sectors can help increase innovation at the regional level (DE FUENTES et al., 2015). Academic research can act as a substitute for industrial R&D because a higher density of collaborations between universities and firms can result in similar levels of innovative performance (AROCENA; SUTZ, 2010). Nevertheless, the industrial diversity of regions and university-industry collaborations are important drivers of innovation at the local level, and both factors help in the understanding of how regions with low industrial R&D expenditures can generate innovations. This represents an important characteristic of the geography of innovation in Brazil, in which extramural aspects related to territorial factors and the regional innovation system appear to be important drivers in shaping innovation in space.
The coefficient of the initial level of patenting (lnPi,T-t) is positive and significant when the SF variables are excluded (regressions 1-2, 4-5,7-8,10-12, and 21-22). Thus, the innovation process is
related to local previous innovations, indicating the importance of the temporal inertia of innovation and knowledge accumulation for innovation. This finding shows that regional innovation is linked to existing innovative activities because its most important input is cumulative knowledge. Accordingly, the influence of past events, the learning process and thus innovation generated in previous periods all positively affect the future of innovation. This result converges with the findings of previous studies in both developed and developing countries (CRESCENZI; RODRÍGUEZ-POSE; STORPER, 2007, 2012).
Finally, the coefficient of the variable that measures the geographical distance from the city of São Paulo DistC is positive and significant whenever the SF variables are included. This result indicates that regions which are geographically distant from the capital may have a higher level of patent per capita than regions located closer to the capital. Although the innovation activities in the latter may be shaped to a greater extent by exposure to interregional knowledge spillovers, proximity to the city of São Paulo appears to hamper innovation. This result is contrary to the expected outcome because Sao Paulo is a micro-region that fosters many innovations. Nonetheless, this result may be explained by the fact that São Paulo has a group of facilities for patent applicants that does not exist in closer regions, which causes applicants to choose Sao Paulo instead of them, whereas this choice does not arise in more distant regions. Ultimately, compared with proximity to the city of Sao Paulo, the greater importance of other regional factors such as industrial structure and density of collaborations may explain this pattern of innovation distribution.
6. Final remarks and policy implications
The existing debate about innovation in Brazil has paid little attention to the role of territorial factors. However, previous studies in both developed and developing countries have found empirical evidence of the importance of territorial determinants for shaping innovation in space. Most studies have applied this subject to developed countries, although there is increasing concern in developing countries regarding the role of territorial factors in fostering innovation at the regional level. Nevertheless, the main drivers of the innovation gap among developing countries’ regions are poorly understood based on systematic and large-scale data.
With this gap in mind, further research on this topic is warranted. Using systematic, large-scale and quantitative data, we present new evidence on how territorial factors affect innovation in Brazilian regions by applying this subject to the state of São Paulo at the regional level. The main results demonstrate the links between industrial R&D at the regional level and local innovation as measured by patenting. In addition, industrial R&D has positive effects on innovation in neighbouring regions, which makes it possible to recognize the presence of regional knowledge spillovers. Alongside these, other territorial factors, such as the diversification of the local productive structure and human capital, are also important drivers of innovation at the regional level, showing the role of the Jacobian externalities in regional innovation.
These results can be associated with policy implications, especially related to technology policy for developing countries. First, our results show that industrial R&D is an important driver for regional innovation, both for the region itself and for neighbouring regions. In this way, regional R&D can play an important role in local innovation, even for developing countries, when a significant share of innovation comes from other sources and industrial R&D expenditures tend to be less important for innovation. Policies designed to foster the rise of industrial R&D expenditures can strengthen their main positive effects on innovation.
Another important result is the role of territorial factors, which include not only the industrial R&D expenditures in the neighbouring regions but also local territorial drivers, such as diversification of the local productive structure and local human capital. Linked to this finding, policies should promote measures that can strengthen the role of local factors, thereby stimulating the geographical concentration of innovative inputs, especially those of highly qualified individuals. This implication is very important for technology policies in developing countries, where private innovative efforts are weaker and scarcer than in developed countries. The geographical
concentration of innovative inputs can be an important tool for fostering innovation at the regional level. For example, deficiencies in the qualification of human capital could be an important barrier to fostering innovation in regions of developing countries, not only in terms of industrial researchers and engineers but also in terms of the overall skills of the population as a way to enhance the capacity of local agents to absorb new knowledge and to benefit from local spillovers that have been generated by the system as a whole.
Finally, it is important to mention that this analysis has limitations. We used patents as a proxy for innovation outputs. However, patents are a measure for only a share of the results of innovation. In addition, this shortcoming is especially important for developing countries, where local firms are more distant from state-of-the-art technological developments and tend to use other methods to protect their innovations. Accordingly, it is necessary to analyse the main drivers of local innovation and the role of territorial factors using other proxies for innovation output, such as innovative firms at the regional level.
References
ACS, Z. J.; ANSELIN, L.; VARGA, A. Patents and innovation counts as measures of regional production of new knowledge. Research Policy, v. 31, n. 7, p. 1069-1085, 2002.
ACS, Z. J.; AUDRETSCH, D. B. Innovation, market structure, and firm size. The Review of Economics and Statistics, v. 69, n. 4, p. 567-574, 1987.
ALBUQUERQUE, E. DA M. Inadequacy of technology and innovation systems at the periphery. Cambridge Journal of Economics, v. 31, n. 5, p. 669-690, 2007.
ARAUJO, V. Dimensão local da inovação no Brasil: determinantes e efeitos de proximidade. Tese (Doutorado em Engenharia). Escola Politécnica da Universidade de São Paulo. São Paulo, 2014. AROCENA, R.; SUTZ, J. Weak knowledge demand in the South: learning divides and innovation
policies. Science and Public Policy, v. 37, n. 8, p. 571-582, 2010.
ASHEIM, B. T.; GERTLER, M. S. The geography of innovation: regional innovation systems. In: FAGERBERG, J.; MOWERY, D. C.; NELSON, R. R. (Eds.). The Oxford Handbook of Innovation. 2009. p. 291-317.
AUDRETSCH, D. B.; FELDMAN, M. P. R&D spillovers and the geography of innovation and production. The American Economic, v. 86, n. 3, p. 630-640, 1996.
BEAUDRY, C.; SCHIFFAUEROVA, A. Who’s right, Marshall or Jacobs? The localization versus urbanization debate. Research Policy, v. 38, n. 2, p. 318-337, 2009.
CARLINO, G.; CHATTERJEE, S.; HUNT, R. Knowledge Spillovers and the new economy of cities. Federal Reserve Bank of Philabelphia. 2001.
CARLINO, G.; CHATTERJEE, S.; HUNT, R. M. Urban density and the rate of invention. Journal of Urban Economics, v. 61, n. 3, p. 389-419, 2007.
CHARLOT, S.; CRESCENZI, R.; MUSOLESI, A. An ‘extended’ Knowledge Production Function approach to the genesis of innovation in the European regions. Grenoble Applied Economics Laboratory (GAEL), 2012. (Working Papers 2012-06).
CO, C. Evolution of the geography of innovation: evidence from patent data. Growth and Change, v. 33, n. 4, p. 393-423, 2002.
COOKE, P. Regional innovation systems, clusters, and the knowledge economy. Industrial and Corporate Change, v. 10, n. 4, p. 945-974, 2001.
CRESCENZI, R.; JAAX, A. Innovation in Russia: the territorial dimension. Economic Geography, v. 93, n. 1, p. 66-88, 2016.
CRESCENZI, R.; RODRÍGUEZ-POSE, A.; STORPER, M. The territorial dynamics of innovation: A Europe-United States comparative analysis. Journal of Economic Geography, v. 7, n. 6, p. 673-709, 2007.
CRESCENZI, R.; RODRÍGUEZ-POSE, A.; STORPER, M. The territorial dynamics of innovation in China and India. Journal of Economic Geography, v. 12, n. 5, p. 1055-1085, 2012.
DE FUENTES, C. et al. Determinants of Innovation and Productivity in the Service Sector in Mexico. Emerging Markets Finance & Trade, v. 51, n. 3, p. 578-592, 2015.
DE FUENTES, C.; DUTRÉNIT, G. SMEs’ absorptive capacities and large firms’ knowledge spillovers: Micro evidence from the machining industry in Mexico. Institutions and Economies, v. 5, n. 1, p. 1-30, 2013.
FELDMAN, M. P. The new economics of innovation, spillovers and agglomeration: a review of empirical studies. Economics of Innovation and New Technology, v. 8, n. 1-2, p. 5–25, 1999.
FELDMAN, M. P.; AUDRETSCH, D. B. Innovation in cities: Science-based diversity, specialization and localized competition. European Economic Review, v. 43, n. 2, p. 409-429, 1999.
FRANCO, C.; MARZUCCHI, A.; MONTRESOR, S. Absorptive Capacity, Proximity in Cooperation and Integration Mechanisms. Empirical Evidence from CIS Data. Industry and Innovation, v. 21, n. 4, p. 332-357, 2014.
FREEMAN, C. Technology policy and economic performance. Pinter Publishers Great Britain, 1989. FRITSCH, M.; SLAVTCHEV, V. Universities and innovation in space. Industry and Innovation, v. 14, n.
2, p. 201-218, 2007.
GARCIA, R.; ARAUJO, V.; MASCARINI, S. The Role of Geographic Proximity for University-Industry Linkages in Brazil: An Empirical Analysis. Australasian Journal of Regional Studies, v. 19, n. 3, p. 433-456, 2013.
GERTLER, M. S. Tacit knowledge and the economic geography of context, or the undefinable tacitness of being (there). Journal of Economic Geography, v. 3, n. 1, p. 75-99, 2003.
GERTLER, M. S. Tacit knowledge in production systems: how important is geography? the economic geography of innovation. In: POLENSKE, K. (Ed.). The economic geography of innovation. Cambridge, Cambridge University Press, 2007. p. 87-111.
GLAESER, E. L.; KALLAL, H. D.; SCHEINKMAN, J. A.; SHLEIFER, A. Growth in cities. In: GLAESER, E.; KALLAL, H. D.; SCHEINKMAN, J. A.; SHLEIFER, A. (Orgs.) The Journal of Political Economy, v. 100, n. 6, p. 1126-1152, 1992.
GONÇALVES, E.; ALMEIDA, E. Innovation and spatial knowledge spillovers: evidence from Brazilian patent data. Regional Studies, v. 43, n. 4, p. 513-528, 2009.
GRILICHES, Z. Issues in assessing the contribution and development of research to productivity growth. The Bell Journal of Economics, v. 10, n. 1, p. 92-116, 1979.
IBGE – Instituto Brasileiro de Geografia e Estatística. Pesquisa de Inovação Tecnológica 2005. Rio de Janeiro: IBGE, 2005.
JACOBS, J. The economy of cities. London: Jonathan Cape, 1969.
JAFFE, A. B. Real effects of academic research. The American Economic Review, v. 79, n. 5, p. 957-970, 1989.
JAFFE, A. B. Technological opportunity and spillovers of R & D: evidence from firms’ patents, profits, and market value. The American Economic Review, v. 76, n. 5, p. 984-1001, 1986.
JAFFE, A. B.; TRAJTENBERG, M.; HENDERSON, R.; NARIN, F. Geographic localization of knowledge spillovers as evidenced by patent citations. Quarterly Journal of Economics, v. 108, n. August, 1993. p. 577-598.
LAURSEN, K.; REICHSTEIN, T.; SALTER, A. Exploring the Effect of Geographical Proximity and University Quality on University–Industry Collaboration in the United Kingdom. Regional Studies, v. 45, n. 4, p. 507-523, 2011.
MARSHALL, A. Industry and Trade. Journal of the Royal Statistical Society, v. 83, n. 3, p. 292-301, 1920.
MONTENEGRO, R. L.; BETARELLI JUNIOR, A. Análise e investigação dos fatores determinantes da inovação nos municípios de São Paulo. Revista Brasileira de Estudos Regionais e Urbanos, v. 9, n. 1, p. 7-31, 2009.
MONTENEGRO, R. L.; GONÇALVES, E.; ALMEIDA, E. Dinâmica espacial e temporal da inovação no estado de São Paulo: uma análise das externalidades de diversificação e especialização. Estudos Econômicos, v. 41, n. 4, p. 743-776, 2011.
MORENO, R.; PACI, R.; USAI, S. Spatial spillovers and innovation activity in European regions. Environment and Planning A, v. 37, n. 10, p. 1793-1812, 2005.
PONDS, R.; VAN OORT, F. G.; FRENKEN, K. Innovation, spillovers and university--industry collaboration: an extended knowledge production function approach. Journal of Economic Geography, v. 10, n. 2, p. 231-255, 2010.
RODRÍGUEZ-POSE, A.; VILLARREAL PERALTA, E. M. Innovation and regional growth in Mexico: 2000-2010. Growth and Change, v. 46, n. 2, p. 172-195, 2015.
SINGH, J.; MARX, M. Geographic constraints on knowledge spillovers: political borders vs. spatial proximity. Management Science, v. 59, n. 9, p. 2056-2078, 2013.
STERLACCHINI, A.; VENTURINI, F. R&D and Productivity in High-tech manufacturing: a comparison between Italy and Spain. Industry and Innovation, v. 21, n. 5, p. 359-379, 2014.
STORPER, M.; VENABLES, A. J. Buzz: Face-to-face contact and the urban economy. Journal of Economic Geography, v. 4, n. 4, p. 351-370, 2004.
TEECE, D.; PISANO, G. The Dynamic Capabilities of Firms: an Introduction. Industrial and Corporate Change, v. 3, n. 2, p. 537-556, 1994.
THOMPSON, P. Patent Citations and the Geography of Knowledge Spillovers: Evidence from Inventor- and Examiner-Added Citations. Review of Economics and Statistics, v. 88, n. 2, p. 383-388, 2006. VAN DER PANNE, G. Agglomeration externalities: Marshall versus Jacobs. Journal of Evolutionary
Economics, v. 14, n. 5, p. 593-604, 2004. Acknowledgments
Suelene Mascarini acknowledges financial support by master scholarship from FAPESP (process number 2010/13734-4) and CAPES (7 months).
ORCID
Suelene Mascarini https://orcid.org/0000-0002-9926-7877 Renato Garcia https://orcid.org/0000-0001-9739-1658
José Eduardo Roselino https://orcid.org/0000-0001-8066-8024