Revista
de
Administração
http://rausp.usp.br/ RevistadeAdministração52(2017)134–147
Strategy
and
Business
Economics
Innovation
and
productivity:
empirical
evidence
for
Brazilian
industrial
enterprises
Inova¸cão
e
produtividade:
evidências
empíricas
para
empresas
industriais
brasileiras
Innovación
y
productividad:
evidencias
empíricas
en
empresas
industriales
en
Brasil
Luciana
Carvalho
∗,
Ana
Paula
Macedo
de
Avellar
UniversidadeFederaldeUberlândia,Uberlândia,MG,Brazil
Received10July2015;accepted13June2016 Availableonline30December2016 ScientificEditor:PaulaSaritaBigioSchnaider
Abstract
TheaimofthispaperistocarryoutanempiricalinvestigationintotherelationshipbetweeninnovationandtheproductiveperformanceofBrazilian businessesmeasuredbyWorkProductivityandTotalFactorProductivity.DatatakenfromtheResearchofInnovationandestimatedcrosssection modelsandpaneldatawasused.Theresultssuggestthatinnovationproducesanincipientimpactoncompetitioninthenationalindustry,reflected inthesmallmagnitudeofcoefficientsassociatedwiththediverseindicatorsofinnovation.
©2016DepartamentodeAdministrac¸˜ao,FaculdadedeEconomia,Administrac¸˜aoeContabilidadedaUniversidadedeS˜aoPaulo–FEA/USP. PublishedbyElsevierEditoraLtda.ThisisanopenaccessarticleundertheCCBYlicense(http://creativecommons.org/licenses/by/4.0/).
Keywords: Innovation;Productivity;Paneldataanalysis
Resumo
Nesteartigo,tem-secomoobjetivorealizarumainvestigac¸ãoempíricaacercadarelac¸ãoentreinovac¸ãoedesempenhoprodutivodasempresas industriaisbrasileirasmedidoporProdutividadedoTrabalhoeProdutividadeTotaldosFatores.ForamutilizadosdadosprovenientesdaPesquisade Inovac¸ãoeestimadosmodeloscrosssectionededadosempainel.Dadaapequenamagnitudedoscoeficientesassociadosaosdiversosindicadores deinovac¸ão,osresultadossugeremqueainovac¸ãoproduzimpactoincipientenaprodutividadedaindústrianacional.
©2016DepartamentodeAdministrac¸˜ao,FaculdadedeEconomia,Administrac¸˜aoeContabilidadedaUniversidadedeS˜aoPaulo–FEA/USP. PublicadoporElsevierEditoraLtda.Este ´eumartigoOpenAccesssobumalicenc¸aCCBY(http://creativecommons.org/licenses/by/4.0/).
Palavras-chave: Inovac¸ão;Produtividade;Painel
Resumen
Elobjetivoenestetrabajoesrealizarunainvestigaciónempíricasobrelarelaciónentrelainnovaciónyeldesempe˜noproductivodelasempresas industrialesenBrasilmedidoporProductividadLaboralyProductividadTotaldeFactores.SehanutilizadodatosdelaEncuestadeInnovación ysehanestimadomodelosdecortetransversalydatosdepanel.Dadalapeque˜namagnituddeloscoeficientesrelacionadosconlosdiversos indicadoresdeinnovación,losresultadossugierenquelainnovaciónproduceimpactoincipienteenlaproductividaddelaindustrianacional. ©2016DepartamentodeAdministrac¸˜ao,FaculdadedeEconomia,Administrac¸˜aoeContabilidadedaUniversidadedeS˜aoPaulo–FEA/USP. PublicadoporElsevierEditoraLtda.Esteesunart´ıculoOpenAccessbajolalicenciaCCBY(http://creativecommons.org/licenses/by/4.0/).
Palabrasclave: Innovación;Productividad;Datosdepanel
∗Correspondingauthorat:Av.JoãoNavesdeÁvila,2121,CEP38408-208,Uberlândia,MG,Brazil. E-mail:lucarvalho@hotmail.com(L.Carvalho).
PeerReviewundertheresponsibilityofDepartamentodeAdministrac¸ão,FaculdadedeEconomia,Administrac¸ãoeContabilidadedaUniversidadede SãoPaulo–FEA/USP.
http://dx.doi.org/10.1016/j.rausp.2016.12.009
Introduction
Severalstudieshaveshowntheexistenceofapositive rela-tionshipbetween innovationand productivity. Internationally, manycountries are moving toincorporate R&D measures in theirnationalaccountingsystemsandthusdirectlyattributeits impactongrowthaswellasaddingtheimportanceofknowledge foreconomicdevelopment.Furthermore,thetheoreticaldebate has converged to understand that the growth of productivity permeatesbytheinnovativeactivityofenterprises.
Pioneeringstudiesonproductivitygrowthsourcesrevealthat thecapitalandlaborinputsexplainlessthanhalf ofthe vari-ationin productivity. The unexplained part,called “residual” isoften consideredthe effectof the technologicalchange on theproductivity.Inthissense,thesestudiesseektofind meas-uresfortechnologicalchange(improvementincapital,quality ofworkandR&Dactivities)inordertoexplaintheresidual pro-ductivitygrowth(Cassiman&Golovko,2011;Griliches,1979, 2000;Huergo&Jaumandreu,2004;Ortega-Argilés,Potters,& Vivarelli,2005;Tsai&Wang,2004;Wakelin,2001).
However,thereisnoconsensusregardingthemost appropri-atewayofmeasuringproductivity.Intheinternationalliterature, moststudiesusetwoproductivitymeasures:WorkProductivity (WP)andTotalFactorProductivity(TFP).
Thepurposeofthisarticleistoinvestigatetherelationship betweeninnovation and productionperformanceof Brazilian companies,asmeasuredbyWorkProductivity(WP)andTotal FactorProductivity(TFP).Theexplanatoryvariablesaredivided intofourgroups:businesscharacteristics,technological exper-tise,industryclassificationandinnovationindicators,measured bynewproductsandprocesses,organizationalchangeand tech-nologyindex.
The proposed methodology for this study is based on the estimation of econometric models: Cross-section anal-ysis for the year 2008; and panel data analysis for the years 2003,2005 and 2008.The data were provided by the BrazilianInstitute of EconomicGeography (IBGE) from the crossingof AnnualIndustrial Research (PIA)andInnovation Research(PINTEC)informationwithforeigntraderecordsfrom SECEX/MDIC.
Becauseoftheshortageofstudiesundertakenontherelation ofinnovationandproductivityatfirmlevelinBrazil,thisstudy contributestotheempiricaldebateonthesubjectinBrazilintwo directions:testingtherelationshipbetweeninnovationand pro-ductionperformanceusingtwoproductivitymeasuresenshrined innationalandinternationalliterature(WorkProductivityand TotalFactorProductivity);andtestingvariousinnovation indi-cators(productinnovation, processinnovation,organizational innovationandtechnologyindex)alsowidelyusedinthe liter-ature.
To meet thisgoal, the paper is organizedinfive sections, including thisbrief introduction.The second sectionpresents thetheoreticalandempirical debateontheinfluenceof inno-vationonbusinessproductivity.Thethirdsectiondescribesthe methodologicalproceduresandthedataused.Thefourth sec-tionreportstheresultsoftheempiricalstudy.Finally,thefifth sectionsummarizesthefinalconsiderations.
Innovationandproductivity
Theoreticaldebate
Severalpapersdealwiththeimpactofinnovationonbusiness productivity.Recently,theincreaseofdataavailableatthefirm levelandtheadvancementofeconometrictechniqueshave con-tributedtothegrowthinempiricalstudies(Cassiman,Golovko, &Martínez-Ros,2010;Griliches,2000;Huergo&Jaumandreu, 2004;Ortega-Argilésetal.,2005;Tsai&Wang,2004;Wakelin, 2001).
Althoughthereisconsiderabledebateabouttheproductivity measures,thereisnoconsensusonthemostappropriateform ofmeasurement.Intheinternationalliterature,moststudiesuse twomeasuresofproductivity:WorkProductivity(WP)andTotal FactorProductivity(TFP).
WPiscommonlycalculatedastheratiobetweentheindustrial transformationvalue(ITV)measuredbythedifferencebetween sales revenue and production costs, and the number of per-sonsemployed(PE)inthecompany(Britto,2009;Chudnovsky, López,&Pupato,2006;Mairesse&Mohnen,2010;Santana, Cavalcanti,&Bezerra,2011;VanBeveren&Vandenbussche, 2009).
WorkProductivity=ITV/PE (1) Themainadvantageoftheworkproductivitymeasureisthe ease of availability of data andthe simplicity of calculation. However,somecriticismsareraisedaboutthismeasureof pro-ductivity.First,itcreatesinstabilityindetermininghowamore efficientmaterialutilizationcanresultinatotalproductivitygain fortheenterprise.Second,thismeasureshowsmuchmorethe productivityimprovementsresultingfromefficienciesin mate-rialandcomponentprocurementthangainsfromamoreefficient useofmanpowerandenergy.Inthisregardwenotethatthisgain inaddedvalueproductivity,duetothepurchaseoflower-cost materials,resultsinanapparent gain,ifconsideredthe possi-bleproblemsthat canleadtomakingthatdecision.Third,the laborproductivityissensitivetoproductionadjustmentsmade bycompaniesinfunctionofthenumberofemployeesengaged, becauseifthecompanyreducethenumberofemployedpersons andmaintainthevalueof industrialtransformation,the result willbeincreasedproductivity.
Other studies use the TFP as a form of incorporating the productivitiesofeachresourceintooneexpression(Cassiman etal.,2010;Griliches,2000;Ortega-Argilésetal.,2005;Tsai& Wang,2004;Wakelin,2001).
productionprocess.Thedifficultyinaccuratelymeasuringand aggregating capitalinputis oneof themain criticismsof the TFP.
ItisnoteworthythattheTFPisquiteoftenusedinempirical studiesofinternationaleconomics.Krugman(1994)pointsout that sustained growth of per capita income of a nation only occurs ifthere is anincrease inoutput per unit of input. An increaseinproductionwithoutanincreaseintheefficiencywith whichinputsareusedisquitelimited.Technologicaladvances havetotakeintoaccountacontinuousincreaseintotalfactor productivityand, therefore, acontinuousincrease innational income.
Thestandardformofthesestudiesusingtotalfactor produc-tivity has beenbuilding avariable of capitalstock relatedto knowledgefromdataon R&Dexpenditure andintroducingit asanadditionalinputintheproductionfunctionofcompanies. Specifically,moststudiesperformaregressiontoestimatethe effectsofchangesinR&Dexpenditurevariableonproduction costs,productionandproductivity,usingdatafromindividual companies,industriesorcountries.
Griliches(2000)dividestheeconometricstudiesintotwo cat-egories:i)theonesestimatingtheeffectofR&Donproduction or productivity(productionfunctionstudies);andii) theones estimating theeffectof R&Don productioncosts(cost func-tionstudies). Bothapproachesare related,sinceitis possible toderiveacostfunctionfromaproductionfunction,andvice versa.However,theyusedifferentstatisticalmethodsandhave differentdata needs.Thisarticleuses thefirst proposition,in whichaproductionfunctionisestimated.
Inpioneeringstudies,Griliches(1979,2000)pointsoutthat studiesusingtheapproachoftheproductionfunctionaremore relevantintheempiricalliterature.Griliches(1979)showedthat the relationshipbetween productivity andthe weighted aver-ageR&Dexpenditureresultsintwodifferentprocesses:i)the production of innovations; and ii) the incorporationof these innovationsintheproductionprocess.
CalculatingTFPisbasedonthemethodologydevelopedby
Griliches(2000)andHall(2011).ItisaCobb–Douglas produc-tionfunction,wherein,
Q=ACϕLδ (2)
andQistheoutput,Cisthecapitalstock,Listhework,Aisthe productivity.
Theoutput(Q)isdefinedasthedifferencebetweennetsales revenueandrawmaterials,auxiliarymaterialsandcomponents (includingpackagingmaterials,fuelsusedasrawmaterialsand lubricants),whichallowsforabetterproxyofthefirm’sadded value(Hulten,2000).
The capitalstock(C) is measuredby the perpetual inven-torymethodbasedontheflowofannualbusinessinvestment. Theperpetualinventorymethodisanindirectmethodof calcu-lationthroughthesumoftheaccumulatedinvestmentswhich, appropriatelydepreciated,convergeovertimetothefixed cap-ital stock of the companies. Thus, the existing capital stock overthepreviousyearisdepreciated,andaddedtothisarethe
current year‘s investments (Griliches, 2000; Hulten, 2000; Parisi,Schiantarelli,&Sembenelli,2006).Thus:
Ct=(1−γ)Ct−1+It (3)
Thevalueofwork(L)ismeasuredbythewagespaid exclud-ing the wages paid to employees in R&D. To measure the equationthefollowinglogarithmisapplied:
lnqit=lnAit+ϕlnCit+δlnLit (4)
Hence,thetotalproductivityoffactorsérepresentedby:
PTF =lnAit=lnqit−ϕ lnCit+δ lnLit (5)
Fortheabove,accordingtoliterature,thereisnoconsensus ontheproductivitymeasures.Thus,thisstudyaimsto investi-gateempiricallywhetherinnovationpromotestheproductivity ofBraziliancompanies,andinordertodothisweusethetwo productivitymeasurespresentedearlier:WorkProductivityand TotalFactorProductivity.
Empiricalevidences
Awiderangeofinternationalstudieshaveinvestigatedthe relationshipbetweentheinnovativebehaviorofthefirmandits productionperformance,measuredbyproductivity.Ina pioneer-ing study for theUnitedKingdom, Wakelin (2001)examines the relationshipbetween spending on R&D andproductivity growth(TFP)atenterpriselevel,usingthepaneldatamethod. TheCobb–Douglasfunctionisestimatedfor170companiesin the periodfrom1988to1992.Amongthe findingsitappears thatthecoefficientassociatedwithspendingonR&Dispositive andstatisticallysignificantindicatingitsinfluenceonthe pro-ductivityoffirms.However,therelationshiplosessignificance whenthefixedeffectsatindustrylevelareincluded.Tocapture the effectby sector on the relationship betweenproductivity growthandspendingonR&D,twovariableswereincluded:the R&D ofothercompaniesinthesamesectorandspendingon R&Dweightedbythecostsofinnovationofsupplierindustries. Asaresultthestudyshowsthatthevariationof technological opportunityineachsectorseemstoplayanimportantroleinthe effectivenessofexpenditureonR&D.
HuergoandJaumandreu(2004)developedastudyof com-panies inSpain,testingtheinfluenceofthevariablesageand innovationinTFPgrowth.Theimplementedmethodologyisthe paneldataanalysisforasampleof2300companiesintheperiod between1990and1998.Theresultsshowthat,whenentering themarket,companieshaveahigherproductivitythanthe oth-ers;however,theproductivitytendstoconvergetotheindustry average.Furthermore,thestudyshowsthattheprocess innova-tionsforthesecompaniesproduceanincreasedproductivitythat persistsforyears.
significant, indicating that there is a positive relationship betweenstockofknowledgeandproductivity.Theyemphasize eventhat the impactis moresignificant in medium-highand high-techsectorsthaninlow-techsectors.
Inacomparativestudy,Griffith,Huergo,Mairesse,andPeters (2006)estimatedtheeffectofinnovationonthetotalproductivity offactorsforfourEuropeancountries:France,Germany,Spain and the United Kingdom. The authors describe the relation-shipbetweenspendingonR&D,innovation andproductivity, using the CDM1 (Crépon-Duguet and Mairesse) model. The econometricresultssuggestthattheimpactofinnovationon pro-ductivityisremarkablysimilarinthefourcountries,althoughthe authorsfoundinterestingdifferences,particularlythevariation inproductivityassociated with higheror lower technological intensityoftheindustrialsector.
Alongthesesamelines,Rogers(2006),alsofortheUnited Kingdom, examines the relationship between spending on R&Dandproductivity(TFP)overtheperiod1989–2000.The calculation of productivity is based on the estimation of a Cobb–Douglasfunctionforasampleof719companiesand esti-mationoftheOLSmodelandpaneldata.Theresultsindicated thatintheUnitedKingdom,the impactof R&Dspendingon productivityislowerthaninotheradvancedeconomies. More-over,thereturns ofexpenditure onR&Dhavebeenrelatively stableoverthedecadeofthe1990s.Inanaggregateanalysisthe resultssuggestthat spendingonR&D islowrelativetoGDP, whichseemstoreflectthelimitedopportunitiesforcompanies andtheirinabilitytoaddvalueintheproductionprocess.
ForItaliancompanies,Parisietal.(2006)developedastudy investigatingtherelationshipbetweenproductandprocess inno-vationandproductivity(TFP).Inaddition,theyinvestigatedthe roleofR&Dandinvestmentinfixedcapitalintheincreasein likelihood ofintroducing innovations.The methodologyused wasthe panel data analysis for 5000companies betweenthe years1992and1998.Theresultsshowthatprocessinnovation hasagreatimpactonproductivity.Furthermore,theexpenditure onR&Dispositivelyassociatedwiththeprobabilityof introduc-inga newproduct, while spendingon fixedcapital increases the likelihood of introducing a processinnovation. However, the effectof fixed investmenton the probabilityof introduc-ingaprocessinnovationisenhancedbythepresenceofR&D departmentswithin the company. Thisresult implies that the expenditureonR&D canaffectproductivitygrowth,favoring theabsorptionofnewtechnologies.
Inasimilarstudy MairesseandRobin(2009)investigated theeffectofinnovationonlaborproductivityforFrench com-paniesintheperiods1998–2000and2002–2004.Tocontrolthe effects of selection biasand endogeneity,non-linear simulta-neousequationswereused,formingasystemoffiveequations basedon theCDM model.The resultsfound suggestthat, in bothperiods,productinnovationseemstobethemaindriverof
1 Recently,Crépon,Duguet,andMairessec(1998)empiricallyintegratedthe relationsbetweenproductsoftheknowledgeproductionfunctionand productiv-ity,andbuiltasystemofequationsinordertocorrecttheselectionendogeneity andbiasinthestructureofthesystem.
laborproductivity,whiletheinfluenceofprocessinnovationis ratherinsignificant.
Cassiman et al. (2010) associate innovation, productivity andexportformanufacturingfirmsinSpain.Amongthe find-ings isthe conclusion that theproduct innovationspositively affect laborproductivity of the enterprisesand lead tosmall non-exportingbusinessesbecomingexporters.Theauthorsused unbalancedpaneldataofsmallandmedium-sizeenterprisesfor theperiod1990–1998.Thesampleconsistsof1256companies from20industrialsectors.Thestudyshowedthatthecoefficient associatedwithprocessinnovationispositiveandstatistically significantforproductivity;however,itshowsnoevidenceofa stimulusofexportcapacity.
Although fewer in number some studies have also been conductedfordevelopingcountries.MiguelBenavente(2002), using data from Chilean companies, analyzed the impact of spending on R&D and innovation on the labor productivity of these companies. The methodology used was a model of ordinaryleastsquares,andthestudyconcludesthatR&Dand innovation activitiesare relatedto company size andmarket power.However,inthecaseofChile,fortheshortterm, produc-tivityisnotaffectedbyinnovationorbyspendingonR&D.
TsaiandWang(2004)developedaCobb–Douglas produc-tionfunctionfor156majorcompanieslistedontheTaiwanStock Exchange.Theeconometricresultsobtainedwiththepaneldata method,suggest that between1994 and2000,the coefficient associatedwiththeexpenditureonR&Dhasapositivesignand isstatisticallysignificant,indicatingtheexistenceofapositive relationshipbetweenR&Dandacompany’sproductivity (elas-ticityequalto0.18).Anotherresult pointedoutbythe author isthatthisimpactwasmuchhigherforcompaniesinhigh-tech sectors(0.3)thanforcompaniesinlow-techsectors(0.07).
Zhang, Sun, Delgado, and Kumbhakar (2011) investigate therelationshipbetweenspendingonR&Dandproductivityof Chinesehigh-techcompanies.Tocomparetheperformanceof companies,theauthorsdividedChinaintothreeregionsandbuilt aCobb–Douglasproductionfunction.Subsequentlytheyused asemi-parametricapproachtomodeltheheterogeneityamong theprovincesintheperiod2000–2007.Theresultssuggestthat therelationshipbetweenspendingonR&Dandproductivityin thedifferentregionsisveryheterogeneousasproductivityinthe easternandcentralregionssignificantlyincreases;however,the relationshipisnottrueforthewesternregion.
In ordertofindevidenceof therelationshipbetween inno-vation andproductivity indevelopingcountries, Chudnovsky etal.(2006)studiedasampleof 718Argentineancompanies. TheeconometricresultsshowthatspendingonR&D,spending onmachineryandequipmentandthesizeofthecompanyhavea positiveimpactonthepropensitytoinnovate.Thestudyreveals further that innovative companies have a higher productivity thannon-innovativeones.
theordinaryleastsquaresmethodanditrevealsthatthe activi-tieswithgreaterimpactonproductivitylevelsareorganizational change,cooperationanddevelopmentofhumancapital.While innovationhasapositiveandstatisticallysignificantcoefficient associatedwiththecompany’sgrowth,wefoundnoevidenceof theimpactofproductandprocessinnovationinTFP.
Silva(2009)soughttoidentifythecharacteristicsofthe tech-nologicalinnovationofBrazilianindustrythroughacquisitions ofmachineryandequipmentandexpendituresonR&Dandits relationshipwiththeTFP.Asaresulttheauthorpointsoutthat theinvestmentdecisionissubject tofinancingandto innova-tionsdevelopedbysuppliersorothergroupcompanies,aswell asalimitedinfluenceofcompetitiveconditions.Inturn, invest-mentsinR&Daremorelinkedtocompaniestargetingmainly thedomesticmarket,however,withforeigncapitalparticipation. Still,therewasahighermarginalproductivityoftheexpenditure onR&D-inrelationtotheacquisitionofmachineryand equip-ment-intheprocessofinnovationintheBrazilianindustry.In fact,theresultssupporttheviewoftheexistenceof technolog-icaldependenceofaportionofBrazilianindustrialcompanies ontheirsuppliersorothergroupcompanies.
Inordertomeasuretherelationshipbetweencapitalstock, expenditureonR&D,andproductivityoflabor,Britto(2009)
shows in apanel of 2047 Brazilian companies for the years 2000,2003and2005,thatthecapitalstockhasapositiveimpact on work productivity. Estimates found show an elasticity of theintensityofphysicalcapitalinvestment(0.21%)ofgreater magnitudeinrelationtoinvestmentinR&D(0.16%).Thus,the resultssuggestthattheadoptionofastrategyofincreasing pro-ductivitythrough theacquisitionofmachineryandequipment ismoreeffective for Braziliancompanies.Anotherimportant resultindicatesthatthequalificationoftheworkforceshowsa productivity-elasticitybiggerthan1.
Santanaetal.(2011),inordertoanalyzetheeffectsof techno-logicalinnovationonworkproductivityintheBrazilianindustry between1996and2009,appliedapaneldatastudy usingthe GMMestimatorintwostages.Theresultssuggestthat innova-tionincreasesproductivityandevenmoreintensivelyinsectors withgreaterinternationalinsertion.
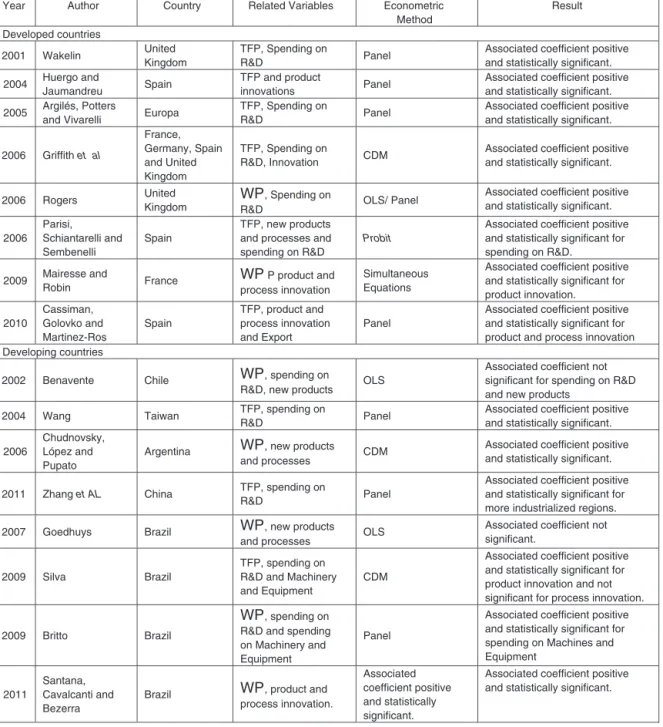
Basedonthetheoreticaldebateandthetotaloftheevidence presented,thispapercontributestotheempiricaldebateon test-inghowdifferentindicatorsofinnovationinfluencethebehavior oftwoproductivitymeasures(WPandTFP)inBrazilian compa-nies.Fig.1summarizesthemaincontributionsoftheempirical, national andinternationaldebateon the relationshipbetween innovationandproductivity.
Methodologicalnotes
Presentationofthedatabase
Thedatabaseusedfortherealizationofthisempiricalstudy referstodatacrossingofthePIA–AnnualIndustrialResearch –andPINTEC–Innovation Research,bothfromIBGE,with foreigntraderecordsfromSECEX/MDIC.Itisnoteworthythat thisresearchisthefirstatanationallevel,inordertoexclusively raiseinformationabouttheinnovativeactivitiesoftheBrazilian
industry,i.e.,priortoittherewasnojointnationaleffortinthis direction,leavingthetasktolocal,regionalorsectorstudies.
ThemethodologyofPINTECfollowsthepatternofresearch conductedbytheEuropeanCommunity(CommunityInnovation Surveys – CIS), which also follow the Oslo Manual, devel-opedbytheOECD(OrganizationforEconomicCooperationand Development),ensuringinternationalcomparability.However, someissues,whilefocusingonimportantaspectsofinnovation, havelimitations.BeingbasedontheOsloManualas methodol-ogy,PINTECtendstofocusonthemostcharacteristicaspectsof companieslocatedatthetechnologicalfrontierorclosetoit.In thecaseofcompaniesindevelopingcountrieslikeBrazil,which arecharacterizedbystilldevelopingtheirskills,especiallythose intermediate;onlytheminorityofbusinessesdominatethemost advancedcapabilities.Therefore,sincemanyoftheindicators useddonotseektocapturesuchintermediatelevelsof capac-ity,characteristicofmostcompanies,somecriticismaimedat the traditional indicatorstomeasureinnovationwhen usedin thecontextoflate-industrializingeconomiesapplytoPINTEC (Lourdes&Figueiredo,2009).
The surveyconsistsof formalcompanieswithtenormore employeesbelongingtothe segmentsof mining, manufactur-ingandsomeselectedservices.Inthecaseofthemanufacturing industry,PINTECiscensitaryforthegroupofindustrial compa-nieswithfiveormoreemployeesandrandomforother.Forthe compositionoftherandomlayer,inadditiontoadopting strati-fiedsamplingtechniquesproportionaltothesize,itassumesthe premise thatinnovationisararephenomenon,whichjustifies assigning ahigherprobabilityofselectiontothosecompanies thathavegreaterpotentialforinnovation;thisitisexpressedby meansofsomeofthefirm’sobservedcharacteristicsashaving filedpatent,receivedfunding/grantforinnovation,was innova-tive,performsR&D,amongothers.Thismostlikelydoesnot causebiasintheresultssincetheweightofeachcompanyinthe sampleisinverselyproportionaltoitsprobabilityofselection.
Related Variables Country
Author
Year Econometric
Method
Result
Developed countries
Wakelin
2001 United
Kingdom
TFP, Spending on
R&D Panel
Associated coefficient positive and statistically significant.
2004 Huergo and
Jaumandreu Spain
TFP and product
innovations Panel
Associated coefficient positive and statistically significant.
2005 Argilés, Potters
and Vivarelli Europa
TFP, Spending on
R&D Panel
Associated coefficient positive and statistically significant.
Griffith et al 2006
France, Germany, Spain and United Kingdom
TFP, Spending on
R&D, Innovation CDM
Associated coefficient positive and statistically significant.
Rogers
2006 United
Kingdom
WP, Spending on
R&D OLS/ Panel
Associated coefficient positive and statistically significant.
2006 Parisi, Schiantarelli and Sembenelli
Spain
TFP, new products and processes and spending on R&D
Probit
Associated coefficient positive and statistically significant for spending on R&D.
2009 Mairesse and
Robin France
WP P product and process innovation
Simultaneous Equations
Associated coefficient positive and statistically significant for product innovation. 2010 Cassiman, Golovko and Martinez-Ros Spain
TFP, product and process innovation and Export
Panel
Associated coefficient positive and statistically significant for product and process innovation Developing countries
Chile Benavente
2002 WP, spending on
R&D, new products OLS
Associated coefficient not significant for spending on R&D and new products
Taiwan Wang
2004 TFP, spending on
R&D Panel
Associated coefficient positive and statistically significant.
2006
Chudnovsky, López and Pupato
Argentina WP, new products
and processes CDM
Associated coefficient positive and statistically significant.
Zhang et AL
2011 China TFP, spending on
R&D Panel
Associated coefficient positive and statistically significant for more industrialized regions.
Brazil Goedhuys
2007 WP, new products
and processes OLS
Associated coefficient not significant.
Brazil Silva
2009
TFP, spending on R&D and Machinery and Equipment
CDM
Associated coefficient positive and statistically significant for product innovation and not significant for process innovation.
Brazil Britto
2009
WP, spending on R&D and spending on Machinery and Equipment
Panel
Associated coefficient positive and statistically significant for spending on Machines and Equipment
2011
Santana, Cavalcanti and Bezerra
Brazil WP, product and process innovation.
Associated coefficient positive and statistically significant.
Associated coefficient positive and statistically significant.
Fig.1.Summaryofempiricalworkoninnovationandproductivity.
Source:Authors.
thecompanyontheacquisitionofassets(machinery,realestate, equipmentandotherfixedassetslessthedecreaseinthevalueof thesameassetsaccordingtotheperpetualinventorymethod.The datausedforthecapitalstockwereobtainedfromastudy con-ductedbytheInstituteofAppliedEconomicResearch(IPEA) forcompaniesthatmakeupthemicro-datafromPIAandmade availablebyIBGE.
As regards the first category of explanatory variables, it appearsthatthecharacteristicsofthecompaniesaredescribed bythevariablespersonsemployed,ageandoriginof capital. Thereisevidencethatcompaniesofbiggersize,know-howand withmore interaction withforeign markets present a greater productivity(Griffithetal.,2006;Huergo&Jaumandreu,2004; Parisietal.,2006;Rogers,2006).
Thevariablesthatrepresentthetechnologicalcapacityare: employed persons with college education, external financing percentage,cooperationforinnovationandtrainingand,finally, intensity of R&D and investments in machinery (Goedhuys, 2007; Griffith et al., 2006; Huergo & Jaumandreu, 2004; Mairesse&Robin, 2009;Rogers,2006).Severalstudieshave demonstratedapositiverelationshipbetweenqualificationand productivity.Accordingtotheseauthors,thisratioisexplained byqualitygains,reducedcostsandlearning(Fig.2).
Expected sign Description
Variable name Cross
section
Panel
A) Company characteristics
X X
+ persons
Employed PO
PO2 Squareof employed persons + X X
X X
+ company
the of start formal the since Years AGE
Binary variable: ORIGIN OF CAPITAL
0 – company does not possess foreign capital participation 1 – company possesses foreign capital participation.
+
X X
B) Technological capacity
Percentage of employed persons with more than 12 years schooling.
SKILL + X X
X X
+ financing
external of Percentage FINANCING
Binary variable: COOPERATION
0 – company does not participate in cooperative arrangements 1 – company participates in cooperative arrangements.
+
X X
Binary variable: TRAINING
0 – company does not conduct training 1 - company conducts training.
+
X X
Company obtained patent. Binary variable: PATENT
0 – industry with low and medium-low technological intensity 1 – industry with high technological intensity.
+
X X
R&D in relation to net revenue on
Spending of R&D:
Intensity
R&D + X
Intensity of Investment in machinery: Spending on M&E in relation to net M&E
revenue +
X
C) Characteristics of the industrial sector in which the company operates
Company that belongs to high technological intensity sectors according to HIGH TECH
Lall (2000). Binary variable:
0 – industry with low and medium-low technological intensity. 1 – industry with high technological intensity.
+
X
Company that belongs to medium technological intensity sectors according to MEDIUM TECH
Lall (2000). Binary variable:
0 – industry with low and high technological intensity. 1 – industry with medium technological intensity.
+
X
Company that belongs to low technological intensity sectors according to Lall LOW TECH
(2000). Binary variable:
1 – industry with high and medium technological intensity. 0 – industry with low technological intensity.
-X
D) Innovation indicators
Binary variable: INOVA
0 – company did not introduce new or significantly improved product or process.
1 – company introduced new or significantly improved product or process.
+
X X
Binary variable: INOVA_PROD
0 – company did not introduce new or significantly improved product. 1 – company introduced new or significantly improved product.
+
X X
Binary variable: INOVA_PROC
0 – company did not introduce new or significantly improved process. 1 – company introduced new or significantly improved process.
+
X X
Binary variable: INOVA_ORG
0 – company did not introduce new management techniques to improve routines and work practices within the company
1 – company introduced new management techniques to improve routines and work practices within the company.
+
X X
oftechnological capabilities (lall, 1987, 1992; indicator
Standardized TI
wignaraja, 2011, avellar and carvalho, 2013). Selected technological Capabilities:
1. Improvement of equipment; 2. License for technology use; 3. Quality improvement;
4. Improvement or adaptation of products; 5. Introduction of new products; 6. R&d activity;
7. Subcontracting; 8. Technology networks.
+
X X
Fig.2.Descriptionofvariables.
proposingfourgroupsoftechnologicalintensity:goods inten-siveinnaturalresources;lowtechnologicalintensity;medium technologicalintensity;hightechnological.Goodsintensivein naturalresourcesdependontheavailabilityoflocalresources andaretherefore relatedtothecountry’scomparative advan-tages. Thesectors of “low intensity”haveprice as themajor determinantofcompetitiveness.Thesesectorsbelongto tradi-tionalindustriessuchastextiles,footwear,andindustriesoflow technologyaggregationsuchashouseholdappliance manufac-turers.Companiesbelongingtothesector“mediumintensity” usecomplextechnologiesandhavemoderatespendingonR&D, comprisingthe sectorsof capitalgoodsandcertainconsumer durables.Finally,thosebelongingtothe“high-intensitysectors” arecharacterizedbyadvancedtechnologiesandhighspending onR&D,whichprovidesastrongtendencytoproduct innova-tion.Thesesectors comprisethepharmaceutical,aeronautical industry, anddata processing. For simplicity,this article has joined the sectors of natural resources andlow technological intensitytogether.
Thefourthcategoryofvariablespresentstheinnovation indi-cators:productinnovationand/orprocess;innovationinproduct; processinnovation;organizationalinnovationandthe technol-ogy index (TI).The TI used inthis study is basedon Lall’s studies(1987,1992)whereinsaidauthorconstructsanindicator tomeasurethe technologicalcapabilitiesof companiesbased ondifferentkindsofinnovative.Lall(1987,1992),Wignaraja (2011), and Avellar and Carvalho (2013) organize the tech-nological capabilities of the companies into three groups of technicalfunctions:investment,productionandnetworks.For samplingcompanies,thesefunctionsare identifiedinthe fol-lowingvariables:(i)improvementof equipment;(ii)licensing oftechnology;(iii)improvementinquality;(iv)adaptationand improvementofproducts;(v)theintroductionofnewproducts; (vi)researchanddevelopmentactivities(R&D);(vii) subcon-tracting; and(viii) participation in technology networks. For eachcompanyascoreof1isassignedwhenthistechnological capacityispresent.Theinvestmentcategoryisrepresentedby theactivities(i)and(ii);theproductioncategoryisrepresented byfouractivities(itemsiii–vi);andthenetworkscategory
com-prisesitems(vii)and(viii).Finally,theresultisnormalizedto avaluebetween0and1.Thisnumbercanbeinterpretedasthe totalscoreoftechnologicalcapabilitiesofeachcompany.Itis importanttonote that thisindicatorhas been usedin several empiricalstudiesforemergingcountries.
Econometricspecifications
The methodologyproposed for thisarticle uses two mod-els:across-sectionanalysisfor2008,andapaneldataanalysis
(balanced)fortheyears2003,2005and2008.Thisresearchaims toexamine howinnovation (measuredfor newproducts, pro-cesses,organizationalchangesandTechnologyIndex)influence theproductivityofBraziliancompanies.
Thepaneldatamodelsdifferfrommodelswithtemporaldata and cross-section, giventhe dual character that assigns each variable:
Yit=a+bX1it+bX2it+uit (6)
withi=1,....,Ntheindividuals(Nindividuals,countries,regions, companies,sectors).t=1,....,Ttheperiodsoftime(Tperiods).
Ifforeachindividualithesamenumberoftemporaldatais available,thepaneliscalledbalanced.Ifthenumberof tempo-raldataisnotthesameforallindividuals,thepaneliscalled unbalanced.
In models that use “fixed effects”, the estimation ismade assumingthattheheterogeneityofindividualsiscapturedinthe constantpart,whichisdifferentfromindividualtoindividual: the constantpartai isdifferent foreach individual,capturing
invariantdifferencesintime(forexample,countrysize,natural resourcesandothercharacteristicsthatdonotvaryintheshort term).Inmodelswith“randomeffects”,theestimationismade introducingtheheterogeneityofindividualsintheerrorterm.
TheHausmantestwasusedtodecidewhichmodelwasthe mostappropriate:themodelofrandomeffects(H0)orthemodel
offixedeffects(HA).Thetestispresentedinthefollowingform:
H0=Cov(ai,Xit)=0(randomeffect)
HA=Cov(ai,Xit)=/ 0(fixedeffect)
Underthenull hypothesis,theestimatesofthemodelwith randomeffectsareconsistentandefficient.Underthe alterna-tivehypothesis,the estimators GLSwithrandomeffects (and
OLS)arenotconsistent,buttheestimatorswithfixedeffectsare consistent.Thisisoneoftheadvantagesofmodelswithfixed effects,sinceitallowsendogeneityoftheregressors.
Thus,thegeneralequationofthemodeltobeestimatedcan bedescribedby:
Productivity=α+λ1EmployedPersons+λ2Employed Persons2+λ3age+λ3ForeignCapital
+β1Skiill+β2Financing+β4Cooperation+β5Training+β6Patent+β7R&D+β8Spending
Machinery+π1hightech+π2mediumtech+3InnovationIndicator
(7)
Empiricalresults
Descriptiveanalysis
Table1
Descriptivestatistics–continuousvariables–mean,standarddeviationandcoefficientofvariation.
Variables 2003 2005 2008
Companies Companies Companies
Mean Var.Coeff. Mean Var.Coeff. Mean Var.Coeff.
PO 765.75(1719.05) 2.2 861.66(2008.18) 2.3 948.92(2418.94) 2.5
AGE 23.63(12.03) 0.5 25.63(12.03) 0.5 28.72(12.12) 0.4
R&D 0.007(0.031) 4.4 0.014(0.037) 2.6 0.006(0.032) 5.3
INOV 0.033(0.094) 2.8 0.040(0.41) 10.3 0.038(0.363) 9.6
M&E 0.02(0.07) 3.5 0.18(0.08) 0.4 0.026(0.35) 0.1
SKILL 0.006(0.032) 5.3 0.007(0.034) 4.9 0.009(0.195) 21.7
TI 0.33(0.22) 0.7 0.38(0.25) 0.7 0.43(0.21) 0.5
WP 79.05(185.45) 2.3 87.00(143.39) 1.6 106.91(225.17) 2.1
TFP 15.26(3.26) 0.2 15.51(3.01) 0.2 16.33(2.94) 0.2
Total 2846 2846 2846
Source:IBGE,InnovationSurvey(2003,2005,2008). Thevaluesinparenthesesrepresentthestandarddeviation.
Table2
Descriptivestatistics–binaryvariables–numberofcompaniesand%.
Variables 2003 2005 2008
Company Company Company
Freq. % Freq. % Freq %
ORIGINOFCAPITAL 565 19.85 559 19.64 610 21.43
TRAINING 814 28.60 807 28.36 909 31.94
COOPERATION 402 14.13 557 19.57 484 17.01
PATENTS 1295 45.50 1047 36.79 1596 56.08
EXPORT 1909 67.08 1966 69.08 1966 69.08
Source:IBGE,InnovationSurvey(2003,2005,2008).
Table1showsthemean,standarddeviationandcoefficient of variationofcontinuousvariablesanalyzedinthe studyfor thethreeyearsunderreview.Table2examinesthediscrete vari-ablesoftheproposedempiricalstudyandshowsthenumberof companiesandtheirfrequencyinthesample.
Regarding the behavior of the productivity indicators a growthcanbeseenintheirmeansovertheyearsanalyzed.A positive trendis shownover the period, particularly the WP, whichincreased35%forthesamplecompaniesbetween2003 and2008.TheTFPshowedanincreaseof7%between2003and 2008.
Thefirstcategoryofexplanatoryvariablesrelatetobusiness characteristics.Itappearsthat,onaverage,theyarecompanies withmorethan500employees,agedbetween23and28years, asshowninTable1,andabout20%ofthemhaveforeigncapital (Table2).
As for the technological capacity indicators (second cat-egory) it may be noted that employed persons with college education(SKILL),trainingandcooperationgrewbetween2003 and2008,indicatinganimprovementintechnological capabil-itiesofBraziliancompaniesintheanalyzedperiod.
TheintensityofR&D,innovativespendingandspendingon machineryandequipmenthaveevolvedbetween2003and2005, howevertheyshowedadeclinein2008.Thisresultimpliesless effortwhenitcomestoinnovativeexpendituresbyenterprisesin 2008.WehighlightthevariableR&Dintensitywhichdecreased 14.3%comparedto2003.
The fourthcategory of variables organizes the innovation indicators:innovationofproductand/orprocess,product inno-vation, process innovation, organizational innovation and the technology index (TI). The indicators innovation of product and/orprocess,productinnovation,processinnovationand orga-nizational innovation are shown in Table 3 and indicate a non-uniformbehaviorovertheperiod.Between2003and2005, thepercentageofcompaniesthatinnovatedinproductand pro-cess increased.In the followingperiod,however,therewasa decrease inthe percentageof innovative companies,withthe exceptionoforganizationalinnovation.
Regarding the indicator of innovation called technology index(TI),presentedinTable2,wefindapositivechangefor the three periods,highlighting agrowthof about 30% of the samplecompanies.Representinganindexthatcombinesseveral technologicalcapabilitiesthisresultpointstoagrowthof tech-nologicaleffortsbyfirms.InastudyonChinaWignajara(2011) revealedthattheaverageTIis0.52.Thisresultsuggeststhatthe technologicalcapabilitiesarelowerforBraziliancompanies.
Econometricestimates
Table3
Behaviorofinnovationindicators–numberofcompanies.
Variables 2003 2005 2008
Company Company Company
Freq. % Freq. % Freq %
INOVATIONOFPRODUCT 1243 43.68 1494 52.49 1237 43.46
INOVATIONOFPROCESS 1497 52.60 1794 63.04 1428 50.18
INOVATIONOFPRODUCTORPROCESS 1798 63.18 2187 76.84 1697 59.63
ORGANIZATIONALINOVATION 1900 66.76 1882 66.13 2090 73.44
Source:IBGE,ResearchBoard,IndustryCoordination,TechnologicalInnovationSurvey(2003,2005,2008).
InTable4,thecolumns1–5presentresultsoftheOLSmodel for thesample of Brazilian companies.The purpose of these estimatesistotesttheeffectofinnovationonworkproductivity. Themodelresultscorroboratewithseveralinternational stud-ies(Cassiman etal., 2010; Mairesse& Robin,2009; Miguel Benavente,2002).
Concerningthe variablecooperation, there isa coefficient associatedpositivelyandsignificantlywithrespecttowork pro-ductivity. Such positive and significant relationship between cooperationandworkproductivityisevidencedinsome inter-nationalstudies(Crespi&Zuniga,2010;Griffithetal.,2006). Thisresultsuggeststhatcompaniesthatparticipatein coopera-tivearrangementsbecomemoreproductivethancompaniesthat donot.
Whenanalyzingtheinfluenceoftechnologicalintensityinthe sectoronproductivity,wenotethattheresultsaresignificantly positive only for the companies with medium technological intensity.Ortega-Argilésetal.(2005),inastudyonSpain,point outthatcompaniesinhighlytechnologicalintensivesectorsgain moreefficiencywithinnovativeeffortsandthereforehave bet-terproductivityperformance.Theauthorsreportthatthegrowth ofproductivity incompaniesof lowandmedium technologi-calintensityisdependentonphysicalcapitalinvestment.Thus, theseresultssuggestthatinthecaseofBraziltherelationship betweentechnologicalintensityandworkproductivityismore relatedtoeffortsintheacquisitionofmachineryandequipment forinnovation.
Regarding innovation indicators, a pattern of behavior is identifiedwheretheassociatedcoefficientsarepositiveand sta-tisticallysignificantinrelationtoworkproductivity.Asregards thefirstindicatorofinnovation,INOVA(column1),the asso-ciatedcoefficientispositiveandstatisticallysignificantat5% fortheyear2005,indicatingthatdevelopingnewproducts or processespositivelyaffectsworkproductivity.
With regard to the product innovation indicator (INOVAPROD), we perceive a positive and significant effect for the years 2005 and 2008 in work productivity. In studieson FranceandSpain,MairesseandRobin(2009)and
Cassiman and Golovko (2011) respectively found similar results. Crespi and Zuniga (2010) in a comparative study for countries in Latin America, found evidence of the posi-tive impact of product innovation on work productivity for Argentina,Chile,ColombiaandUruguay.
Observing the innovation of process indicator, the results arelessrobust.Fortheyear2005the associatedcoefficientis
positiveandsignificantat10%.However,for2008theresults arenotsignificant.ThisresultissimilartowhatMairesseand Robin(2009) identified for French companies: product inno-vation affects productivity, while processinnovation was not significant.ThisrelationshipisalsoinvestigatedbyGriffithetal. (2006),andtheresultsshowthatinnovationofprocessisoneof thedeterminantsofproductivitytoFrance,SpainandtheUnited Kingdom,butnotforGermany.
Thecoefficientassociatedwithorganizationalinnovationis positiveandsignificantfortheyears2005and2008.Thus,itis suggestedthatorganizationalchangesstimulatework productiv-ityofBraziliancompanies.Finally,TI,theproxyforinnovative effortsofcompanies,hasaassociatedcoefficientpositiveand significantat1%fortheyear2005.
Thecolumns6–10ofTable4 showtheresultsofthe OLS model, testingthe effectofinnovation intotalfactor produc-tivity.Theresultsofthemodelsdifferfromsomeinternational studies,especiallythosefordevelopedcountries.However,in somestudiesindevelopingcountries,theresultsarecoincident. It is emphasized in both models that the TFP is related positively withage, capitalsourceandmediumtechnological intensivesectors.Theagevariablesuggeststhatcompanieswith moretimeonthemarketaremoreproductive.Inastudywitha sampleofSpanishcompaniesHuergoandJaumandreu(2004)
showedanoppositeresult.Accordingtothisstudy,agehasa neg-ativeandstatisticallysignificantcoefficientassociated tototal factorproductivity.Thereasonwouldbethattheyounger Span-ishcompaniesarebetterabletomeetthechangesinproductivity standards.Thisdivergencecanbeexplainedbythecomposition ofthesamplesinbothstudies.Theaverageageofthe compa-niessurveyed byHuergoandJaumandreu (2004)is35 years, whileBraziliancompanieshaveonaverage28years.Another importantaspectisthatthecoefficientassociatedwiththe vari-ablecooperationispositiveandsignificantformodels8and9.
Goedhuys(2007)foundevidenceforasimilarsampleof Brazil-iancompanies.ThepositiveresultsofcooperationintheTFP wereevenmoresignificantwhenassociatedwithorganizational changes.
L.
Carvalho,
A.P
.
A
vellar
/
Re
vista
de
Administr
ação
52
(2017)
134–147
Table4
OLSmodelwithlaggedvariablesfor2008.
Variables Workproductivity Totalfactorproductivity
(1) (2) (3) (4) (5) (6) (7) (8) (9) (10)
PO −0.005(0.004) −0.006(0.004) −0.005(0.004) −0.005(0.004) −0.007(0.004) 1.686(183.6) 3.367(182.4) 2.283(184.0) 3.526(184.2) 2.091(182.2) PO2 0.000(0.000) 0.000(0.000) 0.000(0.000) 0.000(0.000) 0.000(0.000) 0.013(0.013) 0.013(0.134) 0.013(0.013) 0.013(0.013) 0.013(0.013) AGE 0.339(0.345) 0.320(0.343) 0.392(0.360) 0.362(0.350) 0.316(0.341) 2265.2(1750.5)*** 4375.4(1780.5)*** 4419.0(1785.9)*** 4402.7(1788.3)*** 4636.2(1903.4)*** ORIGINOFCAPITAL 118.81(18.861)* 116.83(18.206)* 119.78(18.721)* 118.21(18.508)* 114.25(17.843)* 14028.2(51604)** 14355.4(52755)** 144000(55241)** 145268.9(40730)** 142165.5(49977)** SKILL 22.055(34.770) 21.177(33.978) 22.939(34.772) 22.596(34.543) 22.009(33.654) 2710.5(4630.1) 28704.9(4630.1) 30525.3(45788.2) 29188.2(44798.0) 46932(50633.4) FINANCING −0.0504(0.224) −0.1038(0.230) −0.0068(0.238) −0.05054(0.231) −0.1698(0.226) −591.95(841.94) −489.24(880.46) −476.80(879.55) −445.32(929.84) 182.23(961.78) COOPERATION 32.923(15.749)*** 29.674(14.864)* 36.129(14.657)** 32.587(14.461)** 217350.2(114795) 225494.2(115718) 225494.2(115718) 227139.3(113187.2) 341262.5(190846.6) TRAINING 46282.7(27730) 55850**(33007) 48663.4(29253) 44972.04(29253) 147257.9(71303.5) 36282.7(27730) 95850**(33007) 49663.4(29253) 56972.04(29253) 157257.9(71303.5) PATENT 8.1454(10.716) 5.3506(7.622) −0.1247(12.215) 2.1889(8.571) 2.300(7.764) 129163.3(63127.6) 129163.3(63127.6) 10355***(47374.4) 94121.77**(30046.8) 20868.7(44249.1) HIGHTECH 15.380(13.351) 9.4119(14.206) 19.594(12.749) 17.6029(13.073) 8.2613(14.256) −36965.6(41980.9) −31947.3(40492.1) −25070.5(33688.1) −25690.1(33276.8) −20188.9(44667.3) MEDIUMTECH 47.746(12.053)* 45.951(11.957)* 49.486(11.509)* 48.044(11.691)* 43.457(11.953)* 78058(32004)*** 81096(30697)*** 81237(31456.8)*** 82643(30236.8)*** 71468.2(33909.8)*** INOVA2005 15.113(6.614)** 69038.4(84109.2)
INOVA2008 12.992(12.971) 26598.6(18196.8)
INOVAPROD2005 25.472(7.755)** 14645.5(41928.5)
INOVAPROD2008 14.76(8.752)*** 14527.0 (17697.0)
INOVA PROC2005 12.86(7.0644)*** 32416.2(22445.7)
INOVAPROC2008 5.4762(11.421) 25462.7(66104)
INOVAORG2005 21.694(6.200)* 4160.3(20331.4)
INOVA ORG2008 20.489(6.778)** 30676.0(31958.0)
TI2005 81.240(19.373)* 362322(158317)***
TI2008 9.465(36.310) −859474(576607)
Observations 2846 2846 2846 2846 2846 2846 2846 2846 2846 2846 R-square 0.2333 0.2343 0.2102 0.2131 0.2400 0.4190 0.4191 0.4191 0.4191 0.4233
Notes:(a)StandardErrorsbetweenbrackets;(b)***p<0.1,**p<0.05,*p<0.001,absenceofasteriskrepresentsnon-significantcoefficient.(c)Formodels5and10thevariablecooperationwasexcludedtoavoid multi-colinearietywiththeTIvariable.
L.
Carvalho,
A.P
.
A
vellar
/
Re
vista
de
Administr
ação
52
(2017)
134–147
145
Paneldatamodelfortheyears2003,2005and2008.
Variables Workproductivity Totalfactorproductivity(residual)
(1) (2) (3) (4) (5) (6) (7) (8) (9) (10)
PO −0.021(0.003)* −0.021(0.003)* −0.021(0.003)* −0.021(0.003)* −0.020(0.003)* −74.892(11.90)* −74.319(11.90)* −74.653(11.90)* −74.234(11.89)* −72.527(11.89)*
PO2 3.240(6.300)* 3.250(6.300)* 3.260(6.300)* 3.250(6.300)* 3.200(6.300)* 0.010(0.000)* 0.010(0.000)* 0.010(0.000)* 0.010(0.000)* 0.010(0.000)*
AGE 5.443(0.536)* 5.435(0.536)* 5.427(0.536)* 5.440(0.538)* 5.692(0.566)* 11.583(2095)* 11.646(2095)* 11.608(2095)* 11.645(2101.4)* 14461(2209.4)*
ORIGINOFCAPITAL 25.308(9.767)*** 25.235(9.767)*** 25.120(9.767)*** 25.230(9.767)*** 25.385(9.767)*** 7885.1(38139) 8461.1(38142) 7815.3(38142) 8502.8(38143) 10401(38091)
SKILL −5.572(12.40) −5.731(12.40) −5.952(12.40) −5824(12.40) −5223(12.40) −5223(48447) −83425(48451) −85457(48431) −79572(48439) −22047(48377)
FINANCING −0.028(0.130) −0.028(0.130) −0.030(0.130) −0.030(0.130) −0.010(0.131) −21769(51106) −21192(51131) −21474(51131) −20714(51110) −51079(51114)
COOPERATION 5418(4.580) 5.319(4.602) 4.929(4.573) 5.145(4.568) 454261(17883) 606622(17974) 558176(17857) 67333(17841)
TRAINING 0.807(3.753) 0.477(3.724) 0.001(3.729) 0.316(3.689) 2.386(3.886) −18246(14655) −15187(14546) −16510(14562) −14580(14406) 5844.7(15157)
PATENT −2.003(4.808) 0.096(3.516) 1.472(3.962) 0.447(3.339) −1.010(3.447) 19514.2(18773) 3374.36(13730) 9118.9(15473) 21334(13039) −12667(13445)
R&D −9.927(6.388) −9.954(6.388) −9.925(6.388) −9.966(6.388) −9.891(6.388) 147777(24942) 171653(24945) 20740(24946) 17592(24946) 24859(24910)
M&E −3.911(5.479) −4.089(6.736) −4.201(6.740) −4.096(6.736) −4.076(6.735) −24991(26332) −12392(26307) −90.16(26373) −1224(26207) −17739(26269)
INOVA 3.943(5.479) 27507.19(21395.8)
INOVAPROD 1.390(3.984) 4514.24(15560.0)
INOVAPROC 1.818(4.017) 13424.39(15605.7)
INOVAORG 0.0513(3.268) 590.34(12764.8)
TI2005 −12.155(9.511) 143607.3(37093)*
Observations 8538 8538 8538 8538 8538 8538 8538 8538 8538 8538 Enterprises 2846 2846 2846 2846 2846 2846 2846 2846 2846 2846
R2adjusted 0.262 0.261 0.249 0.259 0.260 0.362 0.362 0.362 0.362 0.362
Hausmantest 193.67(0.000) 196.4(0.000) 191.31(0.000) 197.32(0.000) 189.3(0.000) 101.76(0.000) 102.77(0.000) 102.42(0.000) 102.79(0.000) 104.3(0.000)
Table5showstheresultsofthepaneldatamodelsforwork productivityandtotalfactorproductivityinordertoidentifythe dynamicrelationbetweenvariables,andalsotoenablecontrol onpossiblenot-observedheterogeneitybetweenunitsof anal-ysis.Wooldridge(2010)showsthatthepanel datamodelsare moreeffectiveinanalyzingfeaturesthatmayormaynotbe con-stantovertime,sothattimeorsectionalstudieswhichdonot takeintoaccountsuchheterogeneityincuromittedvariablebias andproducealmostalwaysinconsistentresults.
Columns1–5showtheresultsofthepaneldatamodelforWP. Thepurposeofthemodelsrepresentedbythesecolumnsistotest theeffectoffiveinnovationindicatorsonworkproductivity.The dependentvariableiscontinuousandidentifiestherelationship betweentheIndustrialTransformationValue(ITV)andthe num-berofemployedpersonnel.Theindependentvariablesrelated tothe characteristics of thecompany, the company’straining andinnovationindicatorsarethesameasdescribedbefore.Two variablesof innovativeeffortwere added:Spending onR&D andExpendituresonMachineryandEquipment.
Itisfoundasstandardthatinbothmodelsthevariablessquare ofpersonsemployed,age,andoriginofcapitalhaveapositive andstatisticallysignificantassociated coefficient.Itshouldbe noted that the persons employed variablehas anegative and statisticallysignificantassociatedcoefficient,indicatingthatthe company’ssizehasanegativeimpactonproductivity.
Theoriginof capitalvariableisaproxythat measuresthe company’srelationshipwiththeexternalsector.Thesignificant and positiveassociated coefficient corroboratessome studies thatshowthatcompanieswithgreaterinternationalintegration havehigherproductivity(Goedhuys,2007;Santanaetal.,2011). Regardinginnovationindicators,onlythetechnologyindex showed significantresults.Thus,itappearsthat product, pro-cess,andorganizationinnovationwerenotsignificantforwork productivity for the sample of Brazilian companies in these estimated models.It isbelieved that the resultsfound inthis study indicatingthatthereis norelationshipbetween innova-tion(expenditure onR&D,for example) andproductivityare tosomeextent influenced by the sensitivity of the indicators built.The workbyCavalcante, Jacinto, andDeNegri (2015)
performsasimilarempiricalstudyforBraziliancompaniesand use as an innovation indicator spending on R&D in relation toemployedpersons.Itestimatescrosssectionandpaneldata modelsandfindspositiveandstatisticallysignificantassociated coefficients,showingapositiverelationshipbetweeninnovation andproductivityforBrazil.
Models6–10analyzetherelationshipofinnovationwithTFP. Theresultsaresimilartomodelsrelatingtoworkproductivity. Theassociatedcoefficientsoftheinnovationindicatorsarenot significant,exceptfortheTechnologyIndex.
However,somestudiesindevelopingcountriesshowsimilar results.Goedhuys,Janz,andMohnen(2006),inastudyfor Tan-zaniaindicate thattechnologicalvariables, R&D andproduct andprocessinnovationsdidnotshowpositiveandstatistically significantassociated coefficientsinrelationtoWork Produc-tivity. Nevertheless, variables like origin of capital and ISO certificationindicatedtopositivelyaffectproductivity.Miguel Benavente(2002),analyzingasampleof Chilean companies,
foundthatcompanysizeandmarketpowerhaveanassociated coefficientpositiveandsignificantforworkproductivity.Onthe otherside,norinnovativeeffort,measuredbyspendingonR&D norinnovationachievedsignificantestimatedcoefficients.The authorsuggeststhatthelackofdataassociatedwiththeChilean marketstructuremayexplainthisresult.
Finalconsiderations
In light of the foregoing, it is clear that the relationship betweenthevariablesthatexplaintheproductiveperformance ofBraziliancompanies,asmeasuredbyWPandTFPand inno-vation do not have robust results for a sample of Brazilian companies.
Both models showthe pattern that variablesrelatedtothe characteristicsofcompanies,squareofemployedpersons,age, andoriginofcapital,presentpositiveandsignificantassociated coefficients.Theseresultssuggestthatsizeandparticipationof foreigncapitalhaveapositiveinfluenceontheproductivityof companies.
The results for the cross section model with lagged vari-ables pointto apositive andsignificant relationshipbetween innovation indicatorsandworkproductivity.Theseresultsare more evidentwhen observingthe laggedvariables. However, thisrelationshipisnotsignificantfortheTFP.
Another important aspect is related to the technological intensity. Companies of the medium intensity sectors present positiveandstatisticallysignificantassociatedcoefficients.As pointed out by several studies in international literature, the growth of productivityinlow andmedium-technology inten-sitysectorsisdependentonphysicalcapitalinvestment.These results thussuggestthat, inthe caseof Brazil,productivityis morerelatedtoeffortstoacquiremachineryandequipmentfor innovation.
Regarding the panel data models we have not found sig-nificant results of the relationship between innovation and productivity.Itisbelievedthatthelackofrelationshipbetween innovation(expenditureonR&D,forexample)andproductivity foundinthisstudyistosomeextentrelatedtotheinnovation variablesobtainedbyPINTEC andconstructedforthisstudy, as the workby Cavalcanteetal. (2015)found evidenceof a positive relationshipbetween innovation andproductivity for Brazil.
Itfollows,therefore,thatinnovationproducesstillincipient impactsontheproductivityofthedomesticindustry.Itis impor-tanttostressthatBrazil’sindustrialstructureisveryconcentrated inlaborintensivesectors oflowandmedium-lowtechnology. Thispartoftheindustrialstructuremayalsohaveweakenedthe relationshipbetweeninnovationandproductivity,since innova-tion inthesesectors cannotbeconsideredakey factorinthe competitiveprocess.
Moreover,theneedtoimprovethelinkbetweentechnology policiesandforeigntradeisevident.In Brazilthe most inno-vativecompaniesarethosethataremorescaleefficient,export andimportmore, andexporthighervalue-addedgoods. How-ever,thegreater thetechnologicalintensity ofgoodsworseis theperformanceinthetradebalance.Hence,itisnecessaryto createoptionsfortechnologyintensivecompanies,combining horizontalpolicyinstrumentswithstrategicsectoractionswhich identifyrelevantopportunitiesforBrazilintheworldmarket.
Conflictsofinterest
Theauthorsdeclarenoconflictsofinterest.
References
Avellar,A.P.,&Carvalho,L.(2013).Esforc¸oInovativoeDesempenho Exporta-dor:EvidênciasparaBrasil,ÍndiaeChina.EstudosEconômicos(SãoPaulo),
43(3).
Britto,J.(Coord.).(2008/2009).Produtividade,CompetitividadeeInovac¸ãona Indústria.RiodeJaneiro:UFRJ,InstitutodeEconomia.201pp.Relatório integrantedapesquisa“PerspectivasdoInvestimentonoBrasil”,em parce-riacomoInstitutodeEconomiadaUNICAMP,financiadapeloBNDES. 2009.Availablefrom:http://www.projetopib.org/?p=documentos(accessed 11.04.12).
Cassiman,B.,Golovko,E.,&Martínez-Ros,E.(2010).Innovation,exports andproductivity.InternationalJournalofIndustrialOrganization,28(4), 372–376.
Cassiman,B.,&Golovko,E.(2011).Innovationandinternationalizationthrough exports.JournalofInternationalBusinessStudies,42(1),56–75. Chudnovsky,D.,López,A.,&Pupato,G.(2006).Innovationandproductivityin
developingcountries:AstudyofArgentinemanufacturingfirms’behavior (1992–2001).ResearchPolicy,35(2),266–288.
Crépon,B.,Duguet,E.,&Mairessec,J.(1998).Research,innovationand pro-ductivity[aneconometricanalysisatthefirmlevel].EconomicsofInnovation andnewTechnology,7(2),115–158.
Crespi,G.,&Zuniga,P.(2010).Innovationandproductivity:Evidenceformsix LatinAmericancountries.Inter-AmericanDevelopmentBank.IDB Work-ingPaperseriesno.IDB-WP-218
Cavalcante,L.R.,Jacinto,P.,&DeNegri,F.(2015).P&D,Inovac¸ãoe Produ-tividadenaIndústriaBrasileira.InF.DeNegri,&L.R.Cavalcante(Eds.),
ProdutividadedoBrasil:desempenhoedeterminantes(Vol.2).Brasília: IPEA.
Goedhuys,M.(2007).Theimpactofinnovationactivitiesonproductivityand firmgrowth:EvidencefromBrazil.theNetherlands:UNU-MERIT. Goedhuys,M.,Janz, N.,&Mohnen,P.(2006).Whatdrivesproductivityin
Tanzanianmanufacturingfirms:Technologyorinstitutions?
Griffith,R.,Huergo,E.,Mairesse,J.,&Peters,B.(2006).Innovationand pro-ductivityacrossfourEuropeancountries.Oxfordreviewofeconomicpolicy,
22(4),483–498.
Griliches,Z.(1979).Issuesinassessingthecontributionofresearchand devel-opmenttoproductivitygrowth.TheBellJournalofEconomics,92–116. Griliches,Z.(2000)..RandD,education,andproductivity(Vol.214)Harvard
UniversityPress.
Hall,B.H.(2011).Innovationandproductivity(No.w17178).NationalBureau ofEconomicResearch.
Huergo,E.,&Jaumandreu,J.(2004).Firms’age,processinnovationand pro-ductivitygrowth.InternationalJournalofIndustrialOrganization,22(4), 541–559.
Hulten,C.(2000).InMimeo(Ed.),Optimalgrowthwithinfrastructure cap-ital:Theoryandimplicationsforempiricalmodeling.MD:Universityof MarylandBaltimore.
Krugman,P.R.(1994).Peddlingprosperity:Economicsenseandnonsensein theageofdiminishedexpectations.WWNorton&Company.
Lall,S.(1987).Learningtoindustrialize.Springer.
Lall,S.(1992).Technologicalcapabilitiesandindustrialization.World Devel-opment,20(2),165–186.
Lall,S.(2000).Thetechnologicalstructureandperformanceofdeveloping coun-trymanufacturedexports,1985–98.Oxford DevelopmentStudies,28(3), 337–369.
Lourdes,C.S.,&Figueiredo,P.N.(2009).Mensurac¸ãodecapacidades tecnológ-icasinovadorasemempresasdeeconomiasemergentes:méritoslimitac¸ões ecomplementaridadesdeabordagensexistentes.RevistaProdu¸cãoOnline,
9(1).
Mairesse,J.,&Robin,S.(2009).Innovationandproductivity:Afirm-level analysisforFrenchManufacturingandServicesusingCIS3andCIS4data (1998–2000and2002–2004).Paris:CREST-ENSAE.
Mairesse,J.,&Mohnen,P.(2010).Usinginnovationsurveysforeconometric analysis.pp.1129–1155.Handbookoftheeconomicsofinnovation(Vol.2). MiguelBenavente,J.(2002).Theroleofresearchandinnovationin promot-ingproductivityinChile.EconomicsofInnovationandNewTechnology,
15(4–5),301–315.
OrganisationforEconomicCo-operationandDevelopment.(2005).The mea-surementofscientificandtechnologicalactivities:Proposedguidelinesfor collectingandinterpretingtechnologicalinnovationdata:Oslomanual. OECD.
Ortega-Argilés,R.,Potters,L.,&Vivarelli,M.(2005).R&Dandproductivity: Testingsectoralpeculiaritiesusingmicrodata.EmpiricalEconomics,41(3), 817–839.
Parisi,M.L.,Schiantarelli,F.,&Sembenelli,A.(2006).Productivity,innovation andR&D:MicroevidenceforItaly.EuropeanEconomicReview,50(8), 2037–2061.
Pavitt,K.(1984).Sectoralpatternsoftechnicalchange:Towardsataxonomy andatheory.ResearchPolicy,13(6),343–373.
PINTEC.(2008).PesquisaIndustrialdeInova¸cãotecnológica2005.Riode Janeiro:InstitutoBrasileirodeGeografiaeEstatística(IBGE).
PINTEC.(2005).PesquisaIndustrialdeInova¸cãotecnológica2003.Riode Janeiro:InstitutoBrasileirodeGeografiaeEstatística(IBGE).
Rogers,M.(2006).R&DandproductivityintheUK:Evidencefromfirm-level datainthe1990s.DepartmentofEconomics,UniversityofOxford. Santana,S.K.S.,Cavalcanti,S.,&Bezerra,J.(2011).Opapeldainova¸cãona
produtividadedaindústria:umaabordagemsetorial.FozdoIguac¸u:Anais do39◦EncontroNacionaldeEconomia,ANPEC.
Silva,A.M.(2009).ImpactosdaGerac¸ãoeAbsorc¸ãodeConhecimentona ProdutividadedaFirma.RevistaEconomiaContemporânea.RiodeJaneiro,
13(3),467–487.
Tsai,K.H.,&Wang,J.C.(2004).R&Dproductivityandthespillovereffects ofhigh-techindustryonthetraditionalmanufacturingsector:Thecaseof Taiwan.TheWorldEconomy,27(10),1555–1570.
VanBeveren,I.,&Vandenbussche,H.(2009).ProductandProcessInnovation andthedecisiontoExport:Firm-levelevidenceforBelgium.
Wakelin,K.(2001).ProductivitygrowthandR&DexpenditureinUK manufac-turingfirms.ResearchPolicy,30(7),1079–1090.
Wignaraja,G.(2011).Innovation,learning,andexportinginChina:DoesR&D oratechnologyindexmatter?JournalofAsianEconomics,23(3),224–233. WORLDBANK.(2003).WorldBankInvestmentClimateSurvey–Brazil. Wooldridge,J.M.(2010).Econometricanalysisofcrosssectionandpaneldata.
MITPress.
Zhang,R.,Sun,K.,Delgado,M.S.,&Kumbhakar,S.C.(2011). Productiv-ityinChina’shightechnologyindustry:RegionalheterogeneityandR&D.