eISSN: 2237-2083
DOI: 10.17851/2237-2083.27.4.1737-1786
A computational approach for modeling the indexical field
Uma abordagem computacional para a modelagem
de campos indexicais
Livia Oushiro
Universidade Estadual de Campinas (UNICAMP), Campinas, São Paulo / Brazil [email protected]
Abstract: This study investigates how multiple social meanings come to be associated with a linguistic variable. The analyses of listeners’ perceptions of tap and retroflex realizations of coda /r/ in São Paulo Portuguese (as in jornal ‘newspaper’ and bazar ‘bazar’), through an experiment based on the matched-guise technique (LAMBERT et al., 1960; CAMPBELL-KIBLER, 2006, 2009) applied to 185 participants, show that coda /r/ in São Paulo is strongly associated to geographical identities, from which further inferences arise on speakers’ social status regarding their social class, area of residence, level of education, along with personal traits such as being “articulate” and “hardworking.” Interactions between variable /r/ and participants’ social profiles are explored, as well as the fact that certain plausible correlations do not arise, particularly in comparison to previous perception studies. In problematizing the nature of the ideological inter-relations among multiple factual and potential social meanings, an objective and falsifiable computational method for modeling indexical fields is proposed, based on Minimum Spanning Trees (GOWER; ROSS, 1969).
Keywords: indexical fields; social meanings of variation; coda /r/; São Paulo Portuguese; matched-guise technique; computational models of language variation. Resumo: Este trabalho investiga de que modo múltiplos significados sociais vêm a se associar a uma variável sociolinguística. As análises de percepções de ouvintes sobre as realizações de /r/ em coda como tepe ou retroflexo no português paulistano (como em jornal e bazar), por meio de um experimento com base na técnica de estímulos pareados (LAMBERT et al., 1960; CAMPBELL-KIBLER, 2006, 2009) aplicado a 185 participantes, mostram que a variável /r/ se associa fortemente a identidades geográficas, a partir das quais surgem inferências sobre o status social dos falantes com relação a sua classe social, região de residência, nível educacional, juntamente a
traços pessoais como ser uma pessoa “articulada” ou “trabalhadora”. Exploram-se as interações entre a variável /r/ e os perfis sociais dos participantes, assim como o fato de que certas correlações não se manifestam, particularmente em comparação com outros estudos prévios. Ao problematizar a natureza das inter-relações ideológicas entre múltiplos significados factuais e potenciais, propõe-se um método computacional objetivo e falseável para a modelagem de campos indexicais, com base em Árvores de Distâncias Mínimas (GOWER; ROSS, 1969).
Palavras-chave: campos indexicais; significados sociais da variação; /r/ em coda; português paulistano; técnica de estímulos pareados; modelos computacionais da variação linguística.
Submitted on January 10th, 2019 Accepted on July 1st, 2019
1 Introduction
This study analyzes the social meanings of the tap and retroflex variants of coda /r/ (as in jornal ‘newspaper’ and bazar ‘bazar’) in São Paulo Portuguese, and how such meanings may have come to be inter-related in an indexical field. Following Eckert (2008), it is assumed that
the meanings of variables are not precise or fixed but rather constitute a field of potential meanings – an indexical field, or constellation of ideologically related meanings, any one of which can be activated in the situated use of the variable. The field is fluid, and each new activation has the potential to change the field by building on ideological connections. Thus variation constitutes an indexical system that embeds ideology in language and that is in turn part and parcel of the construction of ideology. (ECKERT, 2008, p. 454)
Eckert’s (2008) concept has fostered a more dynamic perspective on the social meanings of language variation and has been fruitfully applied in many different studies to explain ideological inter-relations among the potential meanings of variables (see, e.g., CAMPBELL-KIBLER, 2006, 2009; BECKER, 2013; WALKER et al., 2014; TYLER, 2015; BATTISTI; OLIVEIRA, 2016). The concept has sprung from a criticism to sociolinguistic works that, according to Eckert (2008, 2012), have abandoned the interest in the social meaning of variation
in favor of wider linguistic processes, after Labov’s (1963) initial work in Martha’s Vineyard. In the development of the field, social meaning has come to be confused with demographic correlations between the usage of variants and speakers’ social categories. The present analysis provides further evidence that the relation between variants and social meanings is not direct. Thus, for instance, the fact that men favor the use of a specific variant in a community does not imply that the variant means “masculine.”
To build a model of the social meanings of variables, Eckert (2008) elaborates on Silverstein’s (2013) concept of indexical order. In direct dialogue with Labov’s (1972) concepts of indicators, markers, and stereotypes, Silverstein relates 1st-order indices to indicators, geographical or social variables that are not subject to pressures of stylistic variation. Social evaluation on the speakers who use certain variants may come to be associated to the index and be internalized in speakers’ dialects to index other elements; according to Silverstein, at this point the variant becomes a marker or a 2nd-order index. The difference between Labov’s and Silverstein’s conceptualization is that, for the latter, an index is always available to be reinterpreted and to receive new social meanings, a process that takes place in discourse and in context, in a constant reexamination of linguistic forms.
Capturing such emerging meanings has proved to be a challenge and, to the present, there isn’t yet a method for computing and reliably replicating indexical fields across studies. Although representations of indexical fields have been rooted in empirical evidence as a rule (see, for instance, the indexical fields for (ING) and /t/ release in Eckert, 2008, p. 466 and p. 469), one can question how speakers go from one meaning to the other, and how these meanings come to be associated to a linguistic variable. This is a matter of falsifiability: how to assess the ways in which proposed semantic and ideological relations are established by an individual or group of individuals. A second question is whether an independent researcher would come up with the same representation of the indexical field of a given variable: how can one ensure that the indexical field is not biased by the researchers’ own associations of the different potential meanings of a variable? This is a question of replicability and comparability across studies.
In this study, these questions arise in an analysis of the social meanings of variable /r/ in São Paulo Portuguese. After reviewing results
from production studies that show the variable’s main social correlates in the community (section 2), the methods and data are described in detail in section 3: a matched-guise experiment (LAMBERT et al., 1960; CAMPBELL-KIBLER, 2006, 2009) built to assess subjective and unconscious reactions of São Paulo residents to the tap and retroflex variants. The results (section 4) point to the variable’s strong correlation with geographical identities, as well as meanings related to speakers’ social status. Section 4 also shows that listeners of different social profiles make different associations, and discusses the fact that certain expected correlations do not surface, in comparison to previous perception studies. Finally, a computational method, based on Minimum Spanning Trees (GOWER; ROSS, 1969), is proposed for modeling indexical fields from the same matched-guise data (section 5). It is argued that Minimum Spanning Trees may not only offer a more objective and falsifiable method for plotting visual representations of indexical fields, but also help to predict new potential social meanings of variables (i.e., capturing the “emergent” nature of the social meanings in language variation) and better understand how ideological relations are formed within the field.
2 Coda /r/ in São Paulo
Coda /r/, in words such as jornal ‘newspaper’ and bazar ‘bazar,’ is one of the most salient variables in Brazilian Portuguese (CALLOU et al., 1996; MENDES, 2011; OUSHIRO, 2015) and one of the most studied in Brazilian sociolinguistics (see, e.g., OLIVEIRA, 1983; SKEETE, 1997; CALLOU et al., 1998; GUIOTTI, 2002; BRESCANCINI; MONARETTO, 2008; BRANDÃO, 2009; LEITE, 2010). It can be realized as a trill [r], a tap [ɾ], a retroflex approximant [ɻ], velar fricatives [x ɣ], a uvular fricative [χ], glottal fricatives [h ɦ], and can also be deleted. In the city of São Paulo, home to approximately 11 million people – half of which are internal migrants –, all of these variants can be heard. But in native Paulistanos’ speech, apart from deletion (which occurs almost categorically in infinitival verb morpheme, as in cantar ‘to sing’ [ka͂. ˈta]), the most frequent variants are the tap and the retroflex. The first is normally associated with the state capital city (CRISTÓFARO-SILVA, 2007) whereas the second is a stereotype of the so-called caipira dialect, the variety traditionally spoken by rural inhabitants of São Paulo and surrounding states (AMARAL, 1920; HEAD, 1987; BRANDÃO, 2007).
However, a recent study of the variable realization of coda /r/ in the city of São Paulo (OUSHIRO, 2015) shows that the retroflex variant is not infrequent among native Paulistanos. In a sample of 118 one-hour-long sociolinguistic interviews, with speakers balanced for sex/gender, three age groups (20-34 y.o.; 35-59 y.o.; 60+ y.o.), two levels of education (up to high school; college), and two areas of residence (central area; peripheral area), retroflex /r/ accounted for 28.3% of pronounced tokens of coda /r/ (N = 9,226).
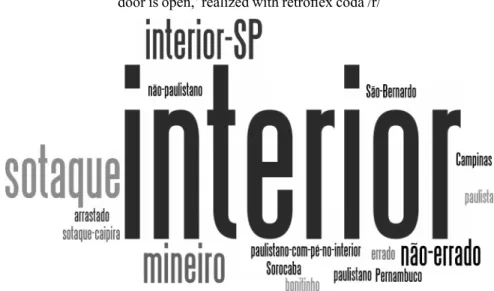
The interview schedule included questions that aimed at collecting speakers’ overt reactions and metapragmatic discourse on both retroflex and tap /r/. Thus, in the last part of the interview, participants were asked: “What do you think of this manner of speaking, a porta tá aberta” (‘the door is open’), for which interviewers were instructed to pronounce the words porta and aberta with clear and exaggerated retroflex /r/ (see MENDES; OUSHIRO, 2012). Participants were also asked who speaks in this manner and whether they themselves speak that way. A content analysis of participants’ answers to these questions was systematized in a word cloud (FIGURE 1), which visually represents the most frequent terms employed by the participants (the larger the font, the more frequently the term occurred).
FIGURE 1 – Word cloud of terms associated with the sentence A porta tá aberta ‘the door is open,’ realized with retroflex coda /r/
Figure 1 makes it clear that the main idea associated with the retroflex variant is interior ‘countryside.’ The notion is also elaborated in more specific definitions such as interior de São Paulo ‘São Paulo’s countryside,’ mineiro (natives from the state of Minas Gerais, north of the state of São Paulo), and certain specific cities in the state (São Bernardo, Campinas, Sorocaba). The great majority of speakers commented overtly on the realization of /r/ to explain their answer. This manner of speaking was often referred to as a sotaque ‘accent,’ and very few participants recognized it as something a Paulistano (and themselves) would say.
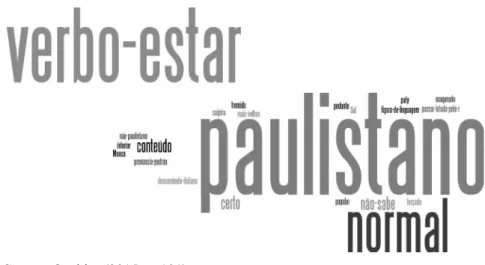
In contrast, Figure 2 shows participants’ metapragmatic comments on the exact same sentence (“What do you think of this manner of speaking: a porta tá aberta”) in which, instead, the two tokens of coda /r/ were realized by the interviewer as taps. This question was made right after the previous questions in order to provoke a direct contrast and, in fact, most participants did characterize it as a “Paulistano” manner of speaking – the most frequent term they used. Notice, however, that the second and third most frequent comments were, respectively: (i) on the verb estar ‘to be’ – i.e., participants did not comment on coda /r/ realization but, instead, commented on the fact that the verb was reduced from está to tá, which implicitly signals that the tap realization of coda /r/ is not worth commenting in this case; and (ii) a characterization of such manner of speaking as normal – which can be similarly interpreted as a statement that there was nothing unusual to comment about, and also that this realization is the community’s norm.
FIGURE 2 – Word cloud of terms associated with the sentence A porta tá aberta ‘the door is open,’ realized with tap coda /r/
Source: Oushiro (2015, p. 101).
Multivariate mixed-effects logistic regressions on the production data, performed in R (R CORE TEAM, 2014, 2018), included social and linguistic predictors1 as fixed effects, and Speaker and Lexical Item as
random effects. In addition to showing that retroflex /r/ is not infrequent in native Paulistanos’ Portuguese – contrary to most Paulistanos’ discourse on the variable –, occurring in nearly a third of all tokens of pronounced coda /r/, the results for social predictors showed that the main effects were speakers’ social class, area of residence, mobility, level of education, and sex/gender. The retroflex variant was favored by working class speakers, living in peripheral areas, of low mobility (those who have always lived in the same neighborhood), lower levels of education and males – all expected correlations for stereotype variables. Although age group was not a significant predictor, an interaction between age group and social class/area of residence showed that there is a change in progress towards the retroflex in working-class peripheral areas and, in the opposite direction, a change in progress towards the tap in more affluent central areas. This raises the question of whether retroflex /r/
1 The linguistic predictors were Preceding and Following Phonological Context, Syllable
Stress, Position of coda /r/ in the word, and Morphological Class. See Oushiro (2015, chapter 5) for a full account of these results.
has different social meanings for different social groups, what these social meanings are, and how they come to be associated with different variants. From speakers’ overt evaluations, tap and retroflex /r/ are mainly – and practically only – associated with geographical identities. Thus, a matched-guise experiment was applied to investigate speakers’ subjective and unconscious judgments on variable /r/.
3 Experimental design
The experiment design follows Campbell-Kibler’s methods for analyzing variable (ING) in English (2006, 2009). First, four native Paulistanos were recorded in sociolinguistic interviews – two men and two women, all of whom were around their early 30s, had a college degree and lived in the West Zone of São Paulo. Their social characteristics were controlled in order to minimize the effect of other variables beyond coda /r/. The option for naturally-occurring conversations instead of readings follows from the observation that this type of recording has the advantage of creating richer and more realistic impressions on the listeners, who perceive the speakers as real people with their own history and personality (CAMPBELL-KIBLER, 2006).
From these recordings, four short excerpts were selected, one from each speaker, and each containing 4-7 tokens of coda /r/. The speakers were contacted again to record controlled productions of coda /r/ as taps and retroflexes. The original recordings were then digitally manipulated in Praat (BOERSMA; WEENINK, 2004) to produce 8 stimuli, one pair for each speaker identical in all respects except for the realization of coda /r/, either as taps or retroflexes, extracted from the controlled recordings. In excerpts (1)-(4), tokens of manipulated coda /r/ are shown in bold.2
(1) Speaker 1 (M): mas aí você tem aqueles outros aspectos meio meio... bizarros né que nem a questão do passaporte interno... ahn... (Inteviewer: ahn) se você é do interior... (vo)cê não pode i(r) pra capital... sem a ordem do governo... (Inteviewer: ahn) se você não tive(r)... eh (vo)cê ainda- é/ o que que o pessoal faz? eles pula(m) a fronteira faz(em) que nem no México
‘but then you have all those other sort of… bizarre aspects right, such as the internal passport matter… uhn… (Interviewer: aham) if you’re from the countryside… you can’t go to the capital city… without a government’s permit… (Interviewer: aham) if you don’t have one… uhn you still can- uh what do people do? they cross the border just like in Mexico’
(2) Speaker 2 (F): e brincava muito assim de Barbie sabe? e brincava muito sozinha também mesmo quando eu não tinha as amiguinhas eu brincava... (Inteviewer: (vo)cê não tem irmãos?) sozinha... tenho uma irmã mais nova cinco anos... então nessa época da infância não dava pra brinca(r) né com ela era muito diferente... porque assim (de/)... na adolescência até quando ela tinha vai quinze eu tinha vinte até dava pra conversa(r) e tal hoje em dia dá pra... sai(r) com ela normalmente... ‘and I used to play a lot with Barbie y’know, and I’d play a lot
by myself too, even when I didn’t have my little friends I played… (Interviewer: don’t you have siblings?) by myself… I have a younger sister, five years younger than me… so at this time in childhood I couldn’t play with her ‘cause it was too different… like when we were teenagers, when she was fifteen and I was twenty, we could talk and such, like nowadays… we can normally hang out…’
(3) Speaker 3 (M): O BG era meio que um... quartel de elite... né... a gente tinha muito acampamento... e a gente tinha horas e horas todo dia de ordem unida... (Inteviewer: ahn) ordem unida é marcha(r)... esquerda volve(r) direita volver... (Inteviewer: uhum) (né) eu odiava... eu odiava... com toda minha força
‘BG was sort of an elite quarter y’know... we had a lot of camping... and we had hours and hours of drill commands every day... (Inteviewer: uhn) drill command is marching... left turn right turn... (Inteviewer: uhum) I hated it... I hated it... from the bottom of my heart’
(4) Speaker (F): ah a gente tinha... diversas atividades né... tipo... coleta de jornal... eh entrega pra reciclagem... eh organização de bazar... e ah e tinha os... os acampamentos né... que era bem legal assim
‘we had... tones of activities right… like… collecting newspapers… ahm delivering them for recycling… ahm organizing bazars… and ahm there was the camping trips right… which were like very cool’
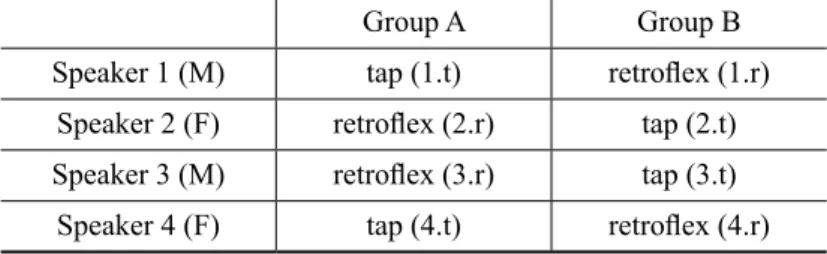
The eight stimuli were separated into two groups, each with one stimulus per speaker, according to the distribution in Table 1. Henceforth, reference to each stimulus will be made by the identification of the speaker and the variant (e.g. “1.t,” “3.r” etc.).
TABLE 1 – Distribution of stimuli in two groups
Group A Group B
Speaker 1 (M) tap (1.t) retroflex (1.r) Speaker 2 (F) retroflex (2.r) tap (2.t) Speaker 3 (M) retroflex (3.r) tap (3.t)
Speaker 4 (F) tap (4.t) retroflex (4.r)
Next the stimuli were played for a number of volunteers, who were asked to listen to the recordings and, as they were doing so, to imagine and to describe what they thought the speaker was like, in terms of social and personal characteristics. Some examples of such listeners’ impressions are given in (5)-(9).
(5) José: ele [1.t] parece que (es)tá dando uma aula... eu imagino assim um um professor universitário tipo- alguém dando uma palestra...
‘he [1.t] sounds like he’s teaching a class… like I imagine a- a professor like- someone giving a lecture…’
(6) Antônio: meu muito ‘paty’ essa mina! [2.t] [risos] a patricinha de Higienópolis! (Interviewer: [risos] ah é? por que você acha...?) ah tipo ela brin-/ brincava de Barbie... não tinha amigos... parece aquelas menininha meio riquinha... fresquinha...
‘bro this chick [2.t] is very paty!3 [laughs] the patricinha from
Higienópolis!4 (Interviewer: [laughs] oh yea? why do you think…?) well
like she pla- played with Barbies… didn’t have any friends… sounds like those rich spoiled girls…’
3 Paty and patricinha roughly refer to a “rich, upper class girl.” See a more detailed
definition ahead.
(7) Joana: [risos] eu acho ela... [2.r] maloqueira... maloqueirona assim... não sei... eu acho que ela é da zona leste... bem... bem suburbana... ‘[laughs] I find her... [2.r] maloqueira… maloqueirona5 like… I
don’t know... I think she lives in the East Zone… (she’s) very… very suburban’
(8) Marcos: ele [3.t] deve se(r) um negão tipo armário!... três por quatro!... [risos] mas não sei onde ele mora... po- poderia se(r) qualquer lugar de São Paulo
‘he [3.t] must be a huge black dude!... huge!... [laughs] but I don’t know where he might live… it- it could be anywhere in São Paulo’ (9) Mariana: ela [4.r] é uma pessoa tímida mais recatada... diferente da
outra... [2.t] deve ter crescido em apartamento... ou... não sei ela pode ser do interior
‘she [4.r] sounds more shy more coy… different from the other one… [2.t] she must have grown up in an apartment… or… I don’t know she may have come from the countryside’
Participants had little difficulty imagining a situation in which each of the speech events could have taken place and attributing social characteristics to the speakers. Although participants avoided making categorical statements about the speakers (which can be seen from the extensive use of expressions such as “I think,” “must,” “may,” “I don’t know”…), these are quite rich descriptions of very short speech excerpts: “professor giving a lecture,” “patricinha,” “resident of Higienópolis,” “rich little girl,” “spoiled,” “maloqueirona,” “East Zone,” “suburban,” “huge black dude,” “shy,” “coy,” “grew up in an apartment,” “countryside.”
After listening to four stimuli, either from group A or B (see TABLE 1), in this phase of the experiment participants also listened to the corresponding alternative guise, to verify what kinds of contrasts would come up. When listening to a pair, most participants explicitly mentioned the different realizations of coda /r/, further confirming that it is a stereotype in the community.
5 Originally, individuals living in malocas, precarious habitations in favelas. The term
now means low class trouble-makers, but it is also associated with supporters of a specific soccer team (and, as such, it is not necessarily negative).
The most frequent terms used to describe the speakers were organized in the following questionnaire, intended for quantifying and systematically analyzing the responses. It includes ten 5-point semantic differential scales (10), three categorical variables (11), and 30 checkboxes of personal traits (12). For the latter, participants could check as many boxes as they considered pertinent to a particular speaker.
(10) Semantic differential scales For you, this person seems... (Choose one option on each line)6
Little/few Very/many Extroverted Educated Masculine6 Intelligent Formal Friendly Paulistano To have an accent To have friends
This person must live in a... (Choose one option)
More peripheral area More central area
(11) Qualitative variables
In which zone of the city does this person probably live? North South East West Downtown I don’t know
In which age group do you think this person is? Teenage years
In his/her 20s In his/her 30s In his/her 40s
Which social class do you think this person is? Low class Low-middle class Middle class Upper-middle class Upper class (12) Checkboxes
From what you heard, you think this person must be... (Check as many boxes as you want)
tall trustworthy sincere
white simple gay/lesbian
shy hardworking spoiled
cool confident conservative
pothead solidary caipira
religious practical depressed
close to Family lazy nerd
articulate impolite sophisticated
annoying funny independente
snobbish laidback patricinha/mauricinho
Two italicized terms, caipira and patricinha/mauricinho, have not been translated from Portuguese, to avoid the risk of cultural mismatches. Roughly, caipira has originally referred to rural inhabitants and to their culture, especially from the state of São Paulo; currently, the term may be extended to all natives of the state, even in urban areas, but it may also carry the meaning of illiterate working-class peasants, or someone not used to the ways of the big city. Patricinha (or paty) generally refers to
upper-middle and upper-class girls who are especially concerned about fashion and looks; their male correlate is a mauricinho. These terms are in principle negative stereotypes, but it is possible to find online websites that will use them positively, in favor of certain lifestyles.
At the end of the questionnaire, participants also had the option to make comments and to describe other impressions they had about the speakers. Lastly, they were asked to provide some sociodemographic data: sex, age, occupation, neighborhood, place of birth, and length of residence in São Paulo (if not a native to the city).
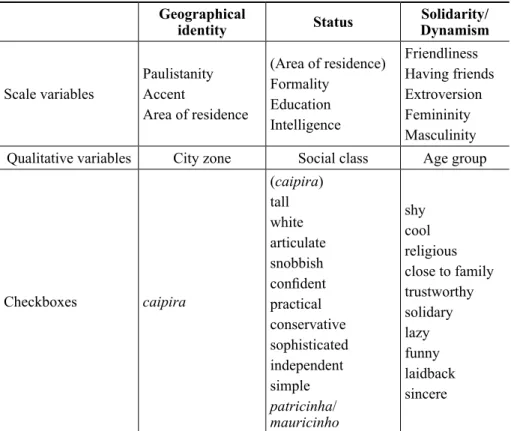
The above list of variables can be classified into three types of social meanings possibly associated with variable /r/ (TABLE 2). Paulistanity, accent, area of residence, and city zone refer to geographical identities. From Oushiro’s (2015) production analyses, the initial expectation was that speakers in retroflex-guise would be perceived as less Paulistano, as having a thicker accent,7 and as residents of more
peripheral areas.
7 The notion of “accentedness” is certainly controversial. Many Paulistanos will not
hesitate to say that their speech variety is the one that is closest to “standard Portuguese,” heard on the national TV and radio news broadcast, or simply that they “don’t have an accent.” Many others, however, regard Paulistano Portuguese as a variety just like any other, and for them Paulistanos “have an accent.” The comment of an online respondent illustrates the matter: “The question about the person having an accent is weird, to say the least. I answered it, but I don’t know if it should count. I have a Paulistano accent. Some speakers sounded like they had a countryside accent. We all have accents.” (participant 37, female, 54 years old, from São Paulo). Unfortunately, it is not possible to know each participant’s opinion on the matter, as this is not something that was actively surveyed. However, this fact does not invalidate the analyses. One of the interests is to contrast the perceptions of different groups of listeners. If the notion of “accentedness” is indeed as fluid and relative, the expected result is that mean ratings for accent will be virtually identical for tap and retroflex /r/ for all groups. If, on the contrary, there are significant differences among groups, the analysis will signal which groups find Paulistanos to have an accent and which groups don’t.
TABLE 2 – Classification of variables according to types of social meanings Geographical
identity Status DynamismSolidarity/
Scale variables Paulistanity Accent Area of residence (Area of residence) Formality Education Intelligence Friendliness Having friends Extroversion Femininity Masculinity Qualitative variables City zone Social class Age group
Checkboxes caipira (caipira) tall white articulate snobbish confident practical conservative sophisticated independent simple patricinha/ mauricinho shy cool religious close to family trustworthy solidary lazy funny laidback sincere
City zone was included because two of the five city zones were frequently mentioned in the open interviews: the East Zone, normally associated with working-class speakers, and the West Zone, reversely associated with middle and upper classes. Area of residence can also be considered a status variable, since living in more central or more peripheral areas in São Paulo is closely related to people’s social class. Other variables regarding status are education, formality, and intelligence. Since the production analyses showed that the retroflex is favored by less educated and working-class speakers, the present analysis aims to verify if these correlations are reproduced in people’s perceptions and whether the symbolic value of education and social class extend to meanings related to formality and speakers’ intelligence.
Previous studies on social perceptions and attitudes (LAMBERT et al., 1960; BOURHIS; GILES, 1976; GILES; BILLINGS, 2004) have generally shown that variants associated with less privileged social groups tend to be more positively evaluated in traits of social solidarity and dynamism;8 hence, for the variables in the third group, it is expected that
speakers will be perceived as having more friends, and as being friendlier, more extroverted and younger when listened to in their retroflex-guise. The dimensions of femininity/masculinity are based on the correlation for the production study: since retroflex /r/ is favored by males, will speakers be perceived as more masculine-sounding (or as less feminine-sounding) when using this variant?
Finally, not all characteristics in the checkbox list fit perfectly into one of the three categories, but one can consider “caipira” a type of geographical identity (and, possibly, also related to status); attributes such as “tall,” “white,” “confident,” “sophisticated,” and “patricinha/ mauricinho” as being related to status; and traits such as “religious,” “close to family,” “trustworthy,” and “cool” as related to solidarity/ dynamism.
The questionnaire was applied to 185 participants who live in the city of São Paulo; 84 of them were recruited in face-to-face interactions and 101 through online social media, which directed participants to a Qualtrics webpage.9 Similarly to the “open interview” phase, participants
8 Although some studies show that certain accents, such as Birmingham English, tend
to be negatively evaluated in all dimensions (see, e.g., GILES, 1970; HIRAGA, 2005).
9 The main researcher was assisted by a colleague in this task. To test for the possible
interference of experimental condition (main researcher, colleague, Qualtrics) in participants’ responses, chi-square tests and anovas were run, followed by Tukey post-hoc tests for multiple comparisons (see NIEDZIELSKI, 1999; HAY; DRAGER, 2010; CAMPBELL-KIBLER, 2010 for detailed discussions on the effect of experimental conditions). There were no significant differences between my colleague and me, but interestingly there were a few significant differences for two semantic differential scales when comparing face-to-face and Internet responses: (i) level of education (Qualtrics vs. researcher: p < 0.001; Qualtrics vs. colleague: p < 0.01); and (ii) friends (Qualtrics vs. researcher: p < 0.01; Qualtrics vs. colleague: p < 0.001). For both variables, differences between ratings for tap and retroflex /r/ were greater in the online condition, signaling that participants were somewhat more “neutral” when in presence of a researcher and more “judgmental” in their absence. This has implications for future studies, but this discussion is beyond the scope of the present article.
were asked to listen to each excerpt and imagine what each speaker was like, but, differently from the previous phase, they only listened to each speaker once (the stimuli in either group A or group B from Table 1); they could listen to each recording as many times as desired, but (as could be observed in the face-to-face data collection) few speakers did listen to each stimulus more than once. On average, it took participants 15 minutes to listen to four excerpts and fill out a questionnaire for each speaker.
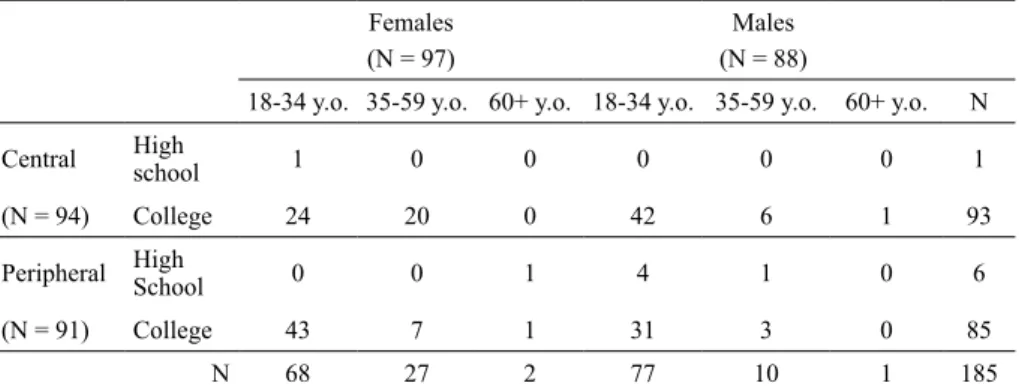
Participants’ demographic characteristics are summarized in Table 3. The sample is balanced for sex (97 women and 88 men), area of residence (94 living in central areas and 91 in peripheral areas), and to a lesser degree for place of origin (129 native Paulistanos and 56 from other places). It is quite unbalanced regarding age (145 between 18-34 years old) and level of education (178 in college or with a college degree), thus these two variables were excluded from further analyses.
TABLE 3 – Distribution of participants according to their social characteristics Females
(N = 97)
Males (N = 88)
18-34 y.o. 35-59 y.o. 60+ y.o. 18-34 y.o. 35-59 y.o. 60+ y.o. N
Central High school 1 0 0 0 0 0 1
(N = 94) College 24 20 0 42 6 1 93
Peripheral High School 0 0 1 4 1 0 6
(N = 91) College 43 7 1 31 3 0 85
N 68 27 2 77 10 1 185
Statistical analyses on the 740 data points (185 participants x 4 speakers) were performed in R (R CORE TEAM, 2018). Quantitative variables (semantic differential scales) were analyzed in Wilcoxon tests (a non-parametric version of the t-test) and in mixed-effects linear models that tested for interactions between predictor variables; qualitative variables were analyzed in square tests; and the checkboxes in chi-square and mixed-effects logistic regression models. The computational models for building indexical fields will be described in detail in section 5.
4 Social meanings of coda /r/
4.1 Scalar variables
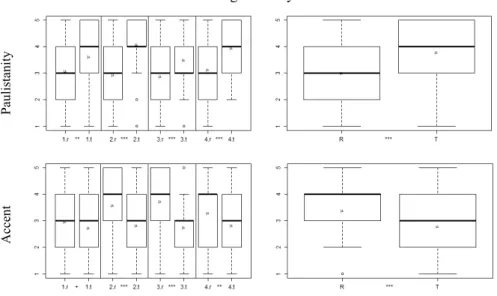
This section analyzes listeners’ responses to the semantic differential scales (how extroverted, educated, intelligent etc. the speakers sounded) according to guise and speaker. From the 10 scales, only Paulistanity, accent, area of residence, formality, and education exhibited significant correlations with variable /r/. Figure 3 summarizes participants’ responses in boxplots, showing their distribution and dispersion in the five-point scales. Between each pair of variants (by speaker, on the left, and for the general sample, on the right), significance levels for one-tailed Wilcoxon tests corrected by the Bonferroni method are indicated according to the convention: +p > 0.05; *p < 0.05; **p < 0.01; ***p < 0.001. The mean value for each distribution is signaled by “μ.” The scales are shown according to the difference in mean value for tap and retroflex /r/, i.e., the biggest difference is found for the Paulistanity scale, followed by accent, area of residence etc.
FIGURE 3 – Scalar variables significantly correlated with variable /r/
Paulistanity
Area of residence
Formality
Education
The three main scales showing significant differences in participants’ perception relate to geographical identities, indicating that the main social meaning of the variants is the opposition Paulistano vs. non-Paulistano, or prototypical vs. non-prototypical Paulistano. It is worth noting that in the Paulistanity and area of residence scales, judgments concentrate in the middle point 3 (the median represented by the bold horizontal line) for retroflex /r/, which shows a certain tendency for neutral responses (seen globally); in the accent scales, this occurs for the tap-guises. The dispersion of responses shows that there is less consensus on how Paulistano the retroflex sounds, how accented is the tap and the area of residence of retroflex users. For instance, in the accent scale, note that tap stimuli were judged both with low (1 and 2) and with high (4 and 5) degrees of markedness, in equal proportions, which reflects the divergence in opinions as to whether Paulistanos have an accent. On the other hand, the community is more consensual on the
Paulistanity of the tap, on how accented the retroflex sounds, and that the tap is associated with more central areas, as seen by the concentration of responses above the middle point on these scales.
In addition to a geographical identity, the correlation with area of residence can also be interpreted as a status differentiation between the variants. Since the upper class in São Paulo is concentrated in more central areas in the city, the association between the tap and these speakers also reflect an association with social class. The correlations with formality and education also support this interpretation. Relatively to the tap-guise, speakers were perceived as less formal and as less educated when listened to in their retroflex-guise.
However, correlations with these five scales are not uniformly reproduced for all speakers (figures on the left). The Paulistanity scale is the only one for which there are significant differences for all speakers: all are perceived as significantly more Paulistano-sounding in their tap-guises. In the other cases, the global correlations have greater contribution from specific speakers, whereas perceptions on others are not affected by the variants. Speaker 1, in particular, seems to be especially immune to the impact of the tap or the retroflex. Two facts may account for this result: (i) since stimuli order was not randomized, his recording was always the first to be listened, which possibly turned him into a baseline against which other stimuli were judged; (ii) speaker 1’s excerpt is the only one in the third person, describing the use of an “internal passport,” whereas the other three speakers are presented narrating personal past experiences (see excerpts in (1)-(4) above); the third-person narrative may have contributed to the impression of a more distanced and impersonal speech event. In that regard, recall a participant’s comment in (5), in which this speaker is perceived as a professor; this frame has the potential to keep him from receiving attributions of personal characteristics such as thickness of accent and area of residence.10
10 It is also curious that speaker 1 is the only one who employs a stigmatized variant
at the end of the excerpt, namely absence of subject-verb agreement: o que que o pessoal faz? eles pula(m) a fronteira faz(em) que nem no México (lit. ‘they crosses the border, does like in Mexico’). This doesn’t affect listeners’ judgments on his level of education, in average higher than for all the other speakers. It is possible that speaker 1, being initially perceived as a more educated, resident of a central neighborhood etc., becomes “immune” to the effects of nonstandard subject-verb agreement (see also CAMPBELL-KIBLER, 2006, 2009 on the “bullet-proof effect”).
Even though not all scales exhibit significant correlations for all speakers, for each pair of stimuli, the relation between retroflex and tap /r/ has a definite directionality: for example, in the accent scale, no speaker is judged as having “less accent” when listened to in the retroflex-guise. On the other hand, differently from the initial hypotheses, speakers were not perceived as having more friends, as being friendlier, more extroverted, less intelligent and less feminine (in the case of female speakers) or more masculine (in the case of male speakers) when listened to in their retroflex-guise.11 Mendes (2016), in a study about
perceptions on nominal number agreement, did not observe differences in the friendliness scale either but, differently from this study, observed significant correlations for effeminacy and intelligence according to the use of the standard or nonstandard variant. The sexuality dimension can probably be accounted for due to the fact that, in Mendes’s study, all speakers were males and the scale measured how “effeminate” they sounded. The intelligence scale, however, can be more directly compared; differently from nominal agreement, although the realizations of coda /r/ also correlate with percepts of education, these don’t extend to judgments of the speakers’ degree of intelligence. This is evidence that two variables that have similar social stratification in terms of speakers’ production (both the retroflex and nonstandard nominal agreement are favored by males, less educated and working-class speakers) do not necessarily have the same set of correlations in terms of perceptions. The relation between language uses and sociolinguistic perceptions is an indirect one. This point will be further explored ahead, in section 4.3.
Analyses so far have reported the perceptions of the community, not considering participants’ social profile. To analyze whether female and male listeners, residents of central and peripheral areas, and from different places of origins differently perceive tap and retroflex, multivariate linear regression models including the interaction between guise and listeners’ sex, area of residence and place of origin were performed in the data.12
In particular, in knowing the strong correlation between variable /r/ and
11 The statistical analyses for these two scales were performed separately for male and
female speakers, since the hypotheses predicted opposite directions for speakers 1 and 3, on the one hand, and 2 and 4 on the other.
12 R lmer formula: scale ~ variant * sex + variant * region + variant * origin + (1|speaker)
speakers’ area of residence in the production study, the interest here is too check whether residents of more peripheral areas, who favor retroflex /r/, have different perceptions of its social meanings than residents of more central areas.
For most scales, interactions were not significant, which means that perceptions were not substantially different according to the participants’ social characteristics. However, two scales showed significant interactions: (i) Paulistanity, for which variant interacts with listener’s area of residence and place of origin, and (ii) accent, for which variant interacts with area of residence. These interactions are shown in Figures 4 and 5.
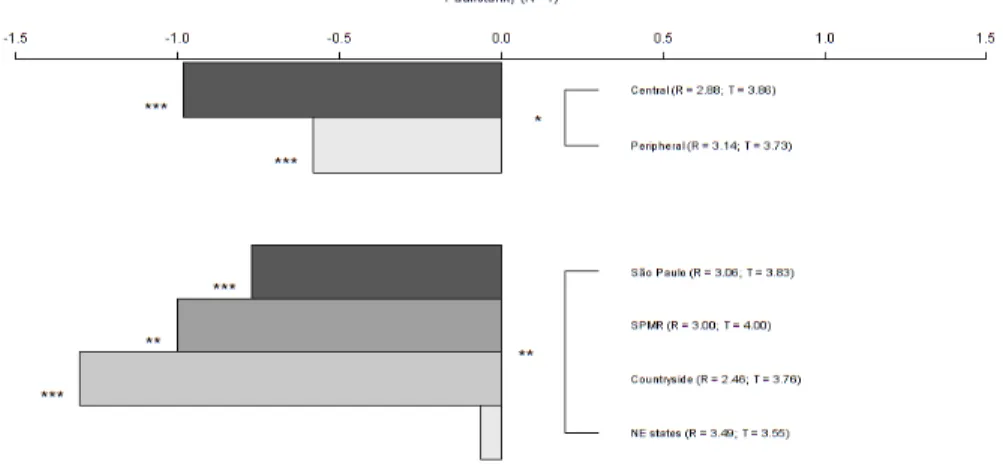
FIGURE 4 – Difference in mean ratings for Paulistanity (R – T) according to participants’ area of residence (above) and Place of origin (below)
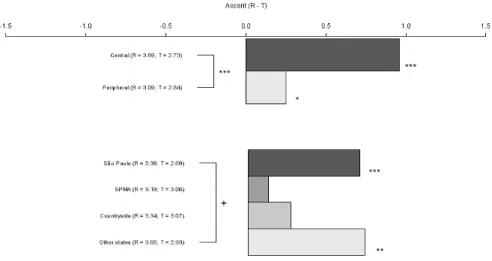
FIGURE 5 – Difference in mean ratings for Accent (R – T) according to participants’ area of residence (above) and Place of origin (below)
The interactions indicate that individuals residing in different areas of the city (more central or more peripheral areas) and from different places of origin (São Paulo, SP Metropolitan Region,13 state interior or
other states) differently perceive retroflexes and taps regarding their degree of Paulistanity and accent.
Figure 4 shows the interactions in the Paulistanity scale. The horizontal bars represent the difference in mean ratings for retroflex- and tap-guises (μR – μT), for speakers living in different areas (top) and from different origins (bottom). The figure also shows the mean ratings for each variant. In all cases, the subtraction results in a negative value, indicating that retroflex /r/ was perceived as sounding less Paulistano than the tap for all groups (R < T), similarly to the global analyses. The interactions consist of the fact that such differences are greater for residents of central areas and participants who are native Paulistanos, native metropolitans or from the state of São Paulo. For residents of more peripheral areas, the difference is also significant, but it was smaller than
13 The SPMR comprises 39 cities in a large conurbation of 20 million inhabitants. In
this category were classified participants who were born in those cities, except for the state capital São Paulo.
for central dwellers; for participants from other states, tap and retroflex /r/ sound equally “Paulistano.”
The production analysis in Oushiro (2015) had shown that variable /r/ strongly correlates with speakers’ area of residence, especially among the youth (and recall that most of the present sample is composed of younger participants). Figure 4 shows that the distinction Paulistano vs. non-Paulistano is more properly made by residents of central areas, who perceive retroflex /r/ as non-native; residents of peripheral areas, although also showing the same trend direction, are somewhat more “tolerant” to the Paulistanity of retroflex /r/. Difference between these two groups is significant to a 5% α-level (p = 0.02). As for place of origin, Figure 4 shows that those born in the capital city São Paulo, in the SP Metropolitan area or the interior significantly differentiate tap and retroflex /r/ in their degree of Paulistanity, especially the latter group. These participants are the ones who are frequently recognized in São Paulo as non-natives because of their realization of coda /r/, and thus are the ones who differentiate the variants’ geographical meaning more markedly – even more than native Paulistanos. On the other hand, listeners who have migrated from other states don’t differentiate taps and retroflexes in their degree of Paulistanity. The great majority of these out-of-state migrants have come from Brazil’s Northeast, an area of predominant fricative /r/ ([x ɣ χ h ɦ]) and, more importantly, no taps or retroflexes. The mean ratings for them were 3.49 for the retroflex and 3.55 for the tap, both above the middle “neutral” point, signaling that for these listeners, retroflex /r/ sounds just as Paulistano as the tap.
Listeners’ area of residence also interacts with variants of /r/ in relation to percepts of accent (FIGURE 5). In this case, the subtraction μR – μT results in positive values, which means that retroflex /r/ is judged by all groups as a thicker accent than the tap (R > T). Nevertheless, residents of central areas consider the retroflex variant as a much more marked accent than the tap, and significantly more than residents of more peripheral areas (p < 0.001). Thus, although the direction of correlations is not different between central and peripheral residents, the degree to which they consider retroflex /r/ less Paulistano and more accented provides evidence of how tap and retroflex are perceived and may explain the opposite directions of language change in speakers’ production, as seen in section 2.
4.2 Qualitative variables
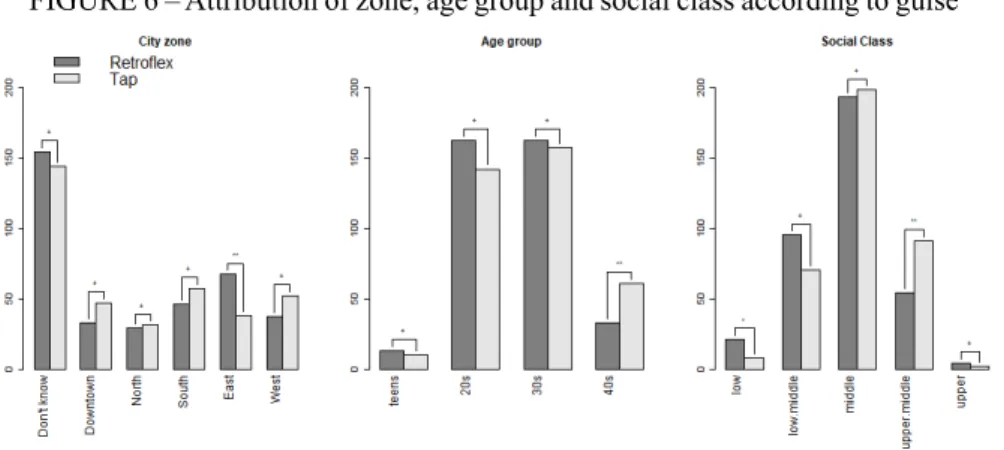
The qualitative variables refer to the attribution of a city zone, age group, and social class to the speakers. These variables were analyzed in chi-square tests. The response distribution can be seen in Figure 6.
FIGURE 6 – Attribution of zone, age group and social class according to guise
For city zone, one can notice that most listeners were not able to attribute a specific zone of residence to the speakers, as most of them selected “I don’t know” both for tap and retroflex-guises.14 Although
listeners associated /r/ variants with central or peripheral areas, the same can’t be said about the five zones. The only significant difference is found for the East Zone: speakers listened to in their retroflex-guise were more frequently attributed this zone of residence than when they were in tap-guise (p = 0.005). The general response distribution for this variable has a low probability of being observed in case the null hypothesis is true (χ2 = 14.55(5), p = 0.01).15
For age group, there is a high concentration of responses in factors “in their 20s” and “in their 30s,” which is likely a result from speakers’ true age (they all are around their 30s, and do sound like that group).
14 This option was included only for city zone because, just as a number of participants
of the open interview phase mentioned the East and the West Zones, many others stated that it’s impossible to know in which zone a person lives in São Paulo.
15 Since the analyses of qualitative variables and checkboxes in this and in the following
section refer to 33 different chi-square tests, one might prefer to adopt an α-level of 0.05 / 33 = 0.0015 in reading and interpreting these data.
Here too there are no significant differences according to which variant was listened to, except for “in their 40s” (p = 0.004): there was a slight tendency for speakers to be attributed this trait in their tap- rather than in their retroflex-guise. Similarly to city zone, overall distribution of responses is not random (χ2 = 10.13(3), p = 0.02).
The perception of social class also showed significant correlations (χ2 = 19.78(4), p < 0.001). Although it was rare for speakers in this sample
to be perceived as “low class,” this occurred more frequently when they were listened to in their retroflex- rather than in their tap-guises (p = 0.02); conversely, the attribution of “upper middle class” happened significantly more frequently in tap than in retroflex stimuli (p = 0.002). Differences in “lower middle class” and “middle class,” although not significant, seem to follow the overall association between retroflex-lower classes and tap-upper classes.
Thus, the nominal variables also point to the importance of the geographical and status dimensions for variable /r/, although in somewhat weaker correlations. A new dimension, relative to speakers’ dynamism, is suggested by the correlation with speakers’ age, as the tap is associated with older speakers. However, the fact that the converse relation “retroflex-younger speakers” is not observed and that most responses concentrate on the intermediary levels, whose differences are not significant, indicate that perceptions of age is more dependent on the speakers’ individual voice traits than any effective intervention of variable /r/.
4.3 Checkboxes
Let us now turn to the analysis of the personal characteristics’ list (being tall, white, articulate, snobbish, shy etc.). The aim here is to determine whether the attribution of a specific personal trait is due to impressions on an individual speaker or whether it is possible to infer an effect of variable coda /r/. Just as in the previous analyses, the expectation is that impressions evoked by specific speakers or by the speech content be neutralized when selected for tap and retroflex /r/ in similar proportions; if, differently, there is an effect of the variant itself, these should be reflected in significantly different rates of selection.
Each characteristic was initially analyzed in chi-square tests to determine the frequency it was selected for each variant. Out of the 30 checkboxes, only 5 are significantly correlated with coda /r/: caipira,
simple, hardworking, articulate, and sophisticated.16 The first three are
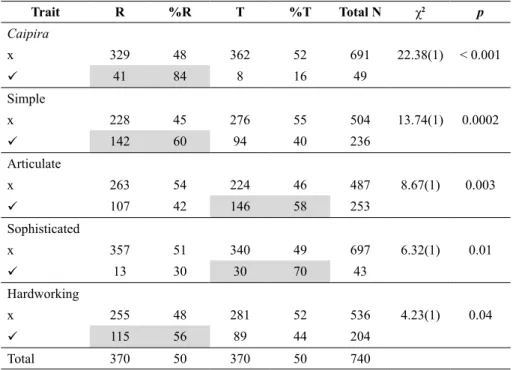
favored by retroflex /r/ and the last two by the tap. Table 4 shows the frequency and the proportions these characteristics were selected () when speakers were listened to in each guise, as well as the result for the chi-square tests. The shaded cells highlight the variant favoring the box selection.
TABLE 4 – Traits correlated with variable /r/
Trait R %R T %T Total N χ2 p Caipira x 329 48 362 52 691 22.38(1) < 0.001 41 84 8 16 49 Simple x 228 45 276 55 504 13.74(1) 0.0002 142 60 94 40 236 Articulate x 263 54 224 46 487 8.67(1) 0.003 107 42 146 58 253 Sophisticated x 357 51 340 49 697 6.32(1) 0.01 13 30 30 70 43 Hardworking x 255 48 281 52 536 4.23(1) 0.04 115 56 89 44 204 Total 370 50 370 50 740
R = retroflex; T = tap; x = unselected checkbox; = selected checkbox.
The first characteristic associated with retroflex /r/, caipira (p < 0.001), relates to a geographical identity (often used to refer to people living in the countryside), but also relates to the speaker status for evoking the image of rural dwellers, who also tend to have lower levels of education and socioeconomic class. The simple trait (p = 0.0002) also relates to the status dimension, and hardworking (p = 0.04) relates to the solidarity dimension. The characteristics significantly favored by the tap, articulate (p = 0.003) and sophisticated (p = 0.01), also concerns speakers’ status.
An analysis by listeners’ social profiles also shows similar trends to the community as a whole: in each subgroup, many of the relevant characteristics refer to a subselection of the above, always associated with the same variants. However, new correlations also arise: female listeners associate the traits patricinha/mauricinho and spoiled to the tap, and non-native Paulistanos associate solidary and sincere to the retroflex variant.
TABLE 5 – Traits correlated with variable /r/ by listener social profile
Listener group Retroflex Tap
Sex: Females simplecaipira hardworking
articulate sophisticated spoiled
patricinha/mauricinho
Sex: Males caipira
--Area of residence: Central caipirasimple articulate
Area of residence: Peripheral --
--Origin: São Paulo caipirasimple articulatesophisticated Origin: SP Metropolitan area solidary
--Origin: SP interior caipirasimple
solidary
--Origin: other states sincere
--It is also worth noting that certain traits did not correlate with variable /r/, such as tall, religious, close to family, differently from Lambert et al. (1960). In the pioneering matched-guise study in Montreal, it was found that speakers in English-guise were more positively evaluated in 7 out of 14 traits, including height, good looks, and ambition – mostly related to the status dimension –, whereas speakers in their French-guise were more positively evaluated in traits such as sense of humor, religiousness, and kindness – related to the solidarity dimension. More generally, these analyses show that few characteristics from the checkbox list are strongly correlated with variants of coda /r/ and, even when correlations do show up, it does not necessarily entail that the characteristic was frequently selected. Figure 7 visually summarizes
these results: the frequency with which the traits were selected with retroflex- or tap-guises are represented in the x- and y-axis respectively: traits showing on the bottom right were relatively more selected in retroflex-guises and those showing on the top left, in the tap-guises. The diagonal middle line represents a “neutral” point, of equal frequency of selection. For instance, the trait close to family was frequently selected, but practically in identical number of times between the variants (R = 103; T = 107). The significant correlations occurred for terms relatively more distant from the neutral line. Also note that all characteristics are more frequently not selected than selected. For instance, the trait white (top right corner), the most frequent selection (R = 146; T = 156), represents 41% (=302/740) of the total of responses. The concentration of terms on the bottom left corner shows that the selection of checkboxes was overall infrequent. In general, participants also avoided selecting negative traits such as annoying, snobbish, lazy, depressed, impolite for either variant, both in face-to-face and in the online data collection.
This means that the described correlations between /r/ variants and certain traits don’t imply that the variants themselves clearly motivated listeners in their selections, but rather that these correlations obtain only on relative grounds. Take the term articulate: it was more frequently selected when speakers were listened to in the tap-guise (R = 107; T = 146), which resulted in a significant correlation as seen in Table 4. But the number of times the term was selected from retroflex-stimuli (R = 107) is higher than the total number of times caipira – also significantly correlated – was checked for all stimuli (R = 41; T = 8). Thus, the association of a trait, far from being categorical and dependent on a specific variant, is a more complex and indirect process. Retroflex /r/ does not mean caipira and simple, and tap does not mean articulate and sophisticated by themselves, because they are competing with multiple other meanings suggested by the same stimulus. We thus need a more comprehensive model, that gives room for multiple social meanings as well as the dynamics of their inter-relations. The next section discusses one such proposal, in dialogue with Eckert’s (2008) concept of the indexical field.
5 A computational approach for modeling the indexical field
It has been shown so far that variants of coda /r/ are correlated with degrees of “Paulistanity,” accent, area of residence, formality, education, social class, and personal attributes such as caipira, simple, articulate, and sophisticated. On the other hand, certain expected correlations were not observed – for instance, the association between tap /r/ and sounding “tall” or “patricinha/mauricinho,” or between retroflex /r/ and sounding “close to family,” “friendlier.” In fact, there is great variability in participants’ responses to all variables, which suggests that, far from being directly related to this set of characteristics, variants of /r/ interact in a network of ideologically related meanings, upon which listeners make inferences about the speakers.
These observations are in line with Eckert’s (2008) proposal of the indexical field, which conceives of meanings of variants as dynamic, potential, and emergent in interaction. The concept of indexical field opens the possibility of more complex representations of social meanings, more coherent with what is observed in speakers’ usage and in listeners’ perceptions. For example, it explains why not all speakers and social groups react to the same variant homogeneously; why the term articulate, although favored by the tap, was also frequently attributed to retroflex
stimuli; or why the correlation between /r/ and level of education does not extend to the scale of intelligence, as seen in other studies (e.g. MENDES, 2016; CAMPBELL-KIBLER, 2006). On the other hand, sociolinguists still do not have a method to compute and reliably replicate or compare such findings across studies, as is the case, for instance, with the variable rule analyses of speech production data.
This section proposes a method to compute the co-occurrence and the inter-relations among multiple variables which can represent emergent indexical fields. Minimum Spanning Trees (GOWER; ROSS, 1969; henceforth MSTs) are graphical representations of multiple correlations, in which a strong correlation between two elements is represented by a smaller distance in a bidimensional plane, and weaker or absence of correlation is represented by greater distance between two variables.17
MSTs can be built in R using the spantree function of the vegan package (OKNANSEN et al., 2018).18 The spantree function requires
a dissimilarity matrix as one of its arguments, which in turn requires a binarily coded spreadsheet. Hence the original data were recoded so that all variables had 0s or 1s for each of the participants’ responses. For the scale variables, values from 1 to 3 were turned into 0 and 4-5 into 1. For the categorical variables, levels were likewise reorganized into binary variables, as lower / upper class, and less / more than 30 years old. Because City Zone is not an ordinal variable, each level was turned into a variable in itself (WestZ, NorthZ, SouthZ etc.) and coded as either checked (1) or unchecked (0). The same procedure was applied to the checkboxes: each characteristic (tall, articulate, white etc.) was coded binarily as checked or unchecked. Four terms in the checkboxes were discarded – pothead, impolite, gay/lesbian, and nerd –, as they were overall rarely selected (less than 30 times). After adjusting the coding, the function Dist from the amap package (LUCAS, 2018) was used to produce the dissimilarity matrix, which calculates correlations between all possible pairs of variables and outputs a matrix of n columns and n lines, n being the total number of variables – 63 in the present experiment.
17 The argument that correlation analyses can help model the indexical field has also
been put forth in Tyler (2005).
18 The vegan package has been originally designed for “diversity analysis, ordination
methods” and “the analysis of dissimilarities” (OKNANSEN et al., 2018, p. 4); though intended primarily for biologists, its multivariate analysis tools are particularly useful for sociolinguistic data.
The full code and data, from recoding participants’ responses to the computation of the MSTs, can be downloaded from https://zenodo.org/ record/2548037#.XEkCi817lPY.
Figure 8 is the visual representation of the MST. Nodes closer to one another indicate levels that co-occurred more frequently (i.e., were both 0s or were both 1s). It thus allows for an analysis not only of the relations between the variants of /r/ and other variables, but also the inter-relations among all variables in the questionnaire.
FIGURE 8 – Indexical field of variable /r/ in São Paulo Portuguese (all data)
It seems useful to first comment on how this and the subsequent figures are not meant to be read. First, they are not to be interpreted as a mental map of how listeners arrived at their percepts of the speaker. For example, although the terms tap, Paulistano, central area and upper class are connected in this order from left to right, it does not imply that a participant first listened to a tap, and then associated it with Paulistano, then with central area, then with upper class and so on, i.e., it is not claimed that they represent any specific chain of connections in any direction. Further, there is no intrinsic meaning for a term showing up on the left, on the right, at the bottom or at the top. What matters here is
the proximity between terms: the closer they are, the more likely they were to have co-occurred in participants’ questionnaires, regardless of the direction from which listeners arrived at their conclusions and whether these were conscious or unconscious choices.
It should also be noted that MSTs, proposed here as models of an indexical field, are not meant to capture it in its entirety, as any given model is a simplified version of what it represents. It is clear that, being based on a closed questionnaire which was applied to a specific set of participants, the terms could have been different and are, necessarily, a subset of all its potential form and spread. The advantage of MSTs is the fact that they are built from observable correlation matrices that can be computed from our data.
Figure 8 thus shows that tap /r/ is close to the terms Paulistano, central area and upper class; being perceived as upper class, on its turn, frequently co-occurred with the perception of being educated, intelligent, articulate, and white. The retroflex variant, on the other hand, shows up closely associated with the notions of being accented, caipira, and simple, and the latter with hardworking and low class. The differently colored groups in Figure 8 represent clusters of terms that are consistently recurrent across different groups of participants, a point which will be further discussed ahead. This general representation of multiple correlations in the data agrees with the significant correlations seen in section 4. Here, in making explicit the relations that the participants made among multiple concepts when imagining who and how the speaker is, the MST provides a more reliable way to infer which terms are relatively more associated to one another.
Although the main focus here is on tap and retroflex /r/, it is likely that listeners didn’t start with these variants in drawing their impressions on the speakers. It is possible to imagine, for instance, that the first impression of a listener was that of a professor giving a lecture, as in example (5), from the speech content and from a perception of good verbal articulation on the part of the speaker; the listener may then have consciously or unconsciously inferred the speaker’s higher level of education, and possibly that he is an upper class individual who lives in a corresponding area of the city. In this scenario, listening to one or the other variant may reinforce the constructed image, lead to the revision of certain previous perceptions or even lead to the formulation of a new image altogether. It is worth mentioning that, in the face-to-face data collection, it was not uncommon for participants to change or adjust answers, both to the current and to previous speakers (although the latter occurred much less frequently).
The connections among all terms in the MST show that it is possible to arrive at any other, but with different probabilities. For example, the term articulate is close to the center of the MST, almost halfway between the tap and the retroflex, though a little closer to the former. This explains the correlation between the tap and sounding articulate, but is also in tandem with the fact that the term was frequently selected in retroflex guises. On the other hand, the term caipira is much closer to retroflex /r/, accented and simple, and quite far from the tap, which explains its strong correlation with retroflex /r/, even though it was selected for these guises fewer times than the term articulate.
Eckert’s (2008) model also predicts shifts in the indexical field according to speakers, listeners, speech context, interlocutors’ stances etc. Here, the experimental design was intended to minimize the effect of all these variables, but section 4 has already pointed to the fact that listeners of different social profiles show slightly different correlations. These differences can be visualized in the following figures, which show MSTs according to participants’ sex (FIGURE 9), area of residence (FIGURE 10), and origin (FIGURE 11). The comparison between these diagrams and that of the general sample makes it possible to identify recurrent patterns in all groups, as well as their specificities.
Certain clusters appear in all MSTs: (i) Paulistanity-central area-upper class-educated; (ii) retroflex-caipira-simple; (iii) simple-hardworking-low class-EastZ; (iv) patricinha/mauricinho-spoiled-snobbish-annoying; (v) lots of friends-friendly-extroverted; (vi) laidback-cool-funny; (vii) religious-family oriented. These are identified by different colors in Figures 8-13. The first two are always close to the tap and the retroflex respectively, which signals the consistency of these associations in the whole community – thus exhibiting significant correlations in the statistical analyses. The correlation between the retroflex and the East Zone (and no other zone) may be explained by these networks of relations. In the community’s imagination, this part of the city is associated with the working class, with simple and hardworking people. Such association is partially based on everyday experience, and partially by a process of erasure (IRVINE, 2001), in which certain facts are ignored, such as the massive presence of middle and upper middle-class individuals in this zone or the existence of working middle-class in all other city zones. The perception that speakers were from the East Zone when listened to in their retroflex-guises, thus, occurs indirectly – but frequently – among the ideologically related terms.
FIGURE 9 – Indexical fields of variable /r/ in São Paulo Portuguese by participants’ sex
FIGURE 10 – Indexical fields of variable /r/ in São Paulo Portuguese by participants’ area of residence
FIGURE 11 – Indexical fields of variable /r/ in São Paulo Portuguese by participants’ origin
For participants living peripheral areas (FIGURE 10), the term accented, although also showing up in the “retroflex-caipira-simple” cluster, is relatively farther to the retroflex – as it is mediated by low class and East Zone – than for central area residents. For non-Paulistanos (FIGURE 11), accented is quite far from the retroflex – and actually closer to the tap. These differences reflect previously observed correlations: for peripheral area residents, the retroflex is not considered such a strong accent (FIGURE 5 above), and for out-of-towners, both retroflex and tap are “accents”.
Other clusters are also differently placed among the MSTs. The “patricinha/mauricinho-spoiled-snobbish-annoying” cluster is closer to the tap for the females, residents of the periphery and Paulistanos, but relatively equidistant from the /r/ variants for men, central residents and non-Paulistanos. The fact that certain groups of concepts move “in bulk” is indicative of the new potential meanings of variants – in Silverstein’s (2003, apud ECKERT, 2008, p. 464) words, “always already immanent.” The clusters show ideologically related meanings that inhabit people’s imagination independently from specific variables and usages; but once one of the terms approximates a linguistic variant, all that cluster becomes available for new meanings. The MST model shows that not all “immanent” meanings have the same probability of association, but rather that those pertaining to a relatively stable cluster is more likely to be evoked in specific contexts. Take, for instance, the “patricinha”-cluster: for females, Paulistanos and residents of peripheral areas, it is more closely related to “upper class”; in contrast, for males, residents of central areas and non-Paulistanos, it is more closely associated with femininity and younger people (“feminine” and “<30y.o.”). Section 4 showed that variable /r/ significantly correlates more consistently with social class, but not femininity. This predicts that listeners who associate the “patricinha”-cluster with upper class – such as women – have greater probability to also associate the tap to “patricinhas” than those who associate “patricinha” with femininity (such as the males as a group). As observed, we verified a significant association between tap and “patricinhas” for women (p < 0.02), differently than for men (p = 0.71) (see TABLE 5 above).
Analyzing more subtle differences helps understand how the MSTs are built. Figure 12 compares the “Paulistanity-central area-upper class-educated” cluster for females and males. As already noted, this