LIFE-CYCLE GREENHOUSE GAS ASSESSMENT OF PORTUGUESE
CHESTNUT
Diana Rosa1, Filipa Figueiredo1, Érica G. Castanheira1, Manuel Feliciano2, Filipe Maia2, José Santos2, Ana Paula Silva3, Henrique Trindade3, and Fausto Freire1*
1: ADAI-LAETA (Center for Industrial Ecology) Department of Mechanical Engineering. University of Coimbra
Rua Luís Reis Santos, 3030-788 Coimbra, Portugal
*e-mail: fausto.freire@dem.uc.pt, web: http://www2.dem.uc.pt/CenterIndustrialEcology/
2: Mountain Research Centre (CIMO), ESA – Polytechnic Institute of Bragança Campus de Stª Apolónia, Apartado 1172, 5301-855 Bragança, Portugal
3: Centre for the Research and Technology of Agro-Environmental and Biological Sciences (CITAB), University of Trás-os-Montes and Alto Douro (UTAD)
Qta. de Prados, 5000-801 Vila Real, Portugal
Keywords: Chestnut; Cultivation; Global Warming; Life-Cycle Assessment (LCA); Processing.
Abstract This paper presents a life-cycle greenhouse gas (GHG) assessment of various chestnut production systems in northern Portugal. Life-cycle models and inventories were implemented for three chestnut cultivation systems and two processing lines (fresh and frozen chestnut). The overall GHG intensity ranged between 0.4-2.7 (fresh) and 0.6-2.9 (frozen) kg CO2eq kg-1harvested chestnut. The cultivation contribution to the overall GHG
intensity varied considerably (from 0.36 to 2.69 kg CO2eq kg-1harvested chestnut) mainly due to
different yields and input requirements (diesel and fertilizers) among the three chestnut cultivation systems analysed. The GHG emissions associated with chestnut processing ranged between 0.05 (for fresh chestnut, mostly from propane consumption) and 0.23 kg CO2eq kg-1 harvested chestnut (for frozen chestnut, mainly due to electricity consumption). The
2
1. INTRODUCTION
The Life-Cycle Assessment (LCA) methodology has been applied to multiple Portuguese agricultural products such as apples [1], wine [2], olive oil [3] and tomatoes [4]. However, so far there are no published LCA articles about chestnuts. Portugal was the third largest producer of chestnut in Europe and the eighth worldwide in 2012, with an annual production of 19 thousand tons [5]. About 80% of chestnut was produced in the north of the country [6]. This paper presents a life-cycle GHG assessment of various chestnut production systems in northern Portugal including three chestnut cultivation systems and two processing lines (fresh and frozen chestnut).
2. LIFE-CYCLE MODEL AND INVENTORY
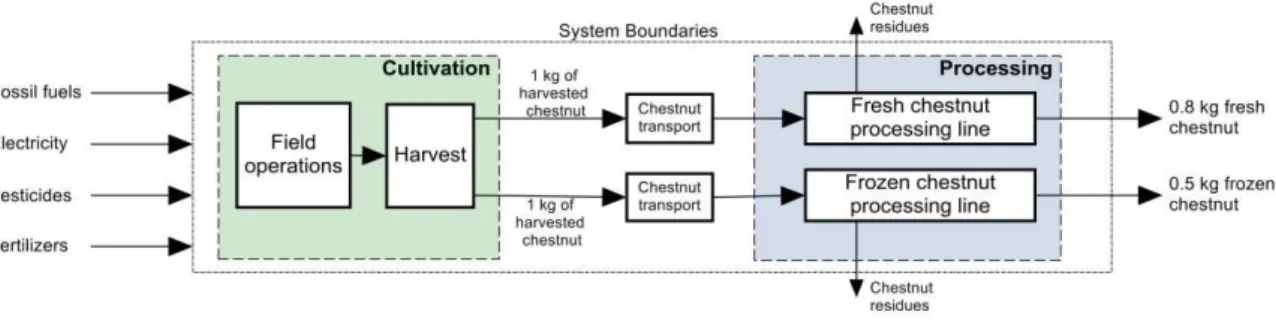
Life-cycle models and inventories were developed for three cultivation systems in northern Portugal: P1 (92 ha), P2 (7 ha) and P3 (10 ha). A processing factory with two distinct production lines (fresh and frozen chestnut) was analysed. The functional unit (FU) chosen for this study was 1 kg of harvested chestnut. Figure 1 presents the chestnut production system.
Figure 1 – Chestnut production system.
The chestnut tree was in full production for all producers (except for 80% of P3 orchard area, which had relatively new trees and consequently a low productivity). The main agricultural processes were soil management, fertilization, pruning, pesticide treatments and harvesting. Table 1 presents the main inputs of the chestnut orchards. Emissions from fertilization (direct and indirect N2O emissions and CO2 from liming [7]), combustion of petrol and diesel in
3
harvested chestnut was required to produce 0.5 kg of frozen chestnut (kernel). Losses were associated with chestnut selection (35%), peeling (11%) and water loss (4%). One kg of harvested chestnut was required to produce 0.8 kg of fresh chestnut, (lower losses than for the frozen line, as there is no peeling or water loss). Energy inputs for frozen and fresh chestnut processing are shown in Table 2. Propane was used in kilns (43%) and steam generators (57%). Emissions arising from the production and combustion of propane [8, 11], as well as the generation of electricity [12] were taken into account. Chestnut packaging materials were not addressed (the quantities involved are relatively low and it was not expected this would be relevant).
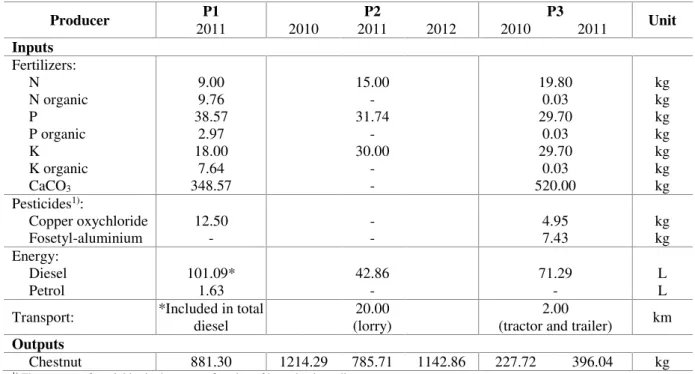
Table 1 – Main inputs of chestnut cultivation, per hectare.
Producer 2011 P1 2010 2011 P2 2012 2010 P3 2011 Unit
Inputs Fertilizers: N N organic P P organic K K organic CaCO3 9.00 9.76 38.57 2.97 18.00 7.64 348.57 15.00 - 31.74 - 30.00 - - 19.80 0.03 29.70 0.03 29.70 0.03 520.00 kg kg kg kg kg kg kg Pesticides1):
Copper oxychloride Fosetyl-aluminium 12.50 - - - 4.95 7.43 kg kg Energy: Diesel
Petrol 101.09* 1.63 42.86 - 71.29 - L L
Transport: *Included in total diesel (lorry) 20.00 (tractor and trailer) 2.00 km Outputs
Chestnut 881.30 1214.29 785.71 1142.86 227.72 396.04 kg
1) The amount of pesticides is shown as a function of its active ingredient.
Table 2 – Main inputs of chestnut processing.
Inputs Fresh chestnut Production line Frozenchestnut Unit / kg harvested chestnut
Electricity 0.05 0.49 kWh
Propane 19.02 25.83 g
1) The chestnut residues (inner and outer skin), are fed to the boiler. Emissions from this process were not accounted for.
3. RESULTS AND DISCUSSION
4
emissions derived from the production and application of fertilizers (45-62%) for the three producers. Emissions from diesel requirements were most relevant for P1 (39%). CO2 was the
most relevant GHG substance (66-81%), followed by N2O (17-31%) and CH4 (less than 3%).
The main cause of CO2 emissions from P1 and P2 was diesel production and operation (46%
and 53%), whereas for P3 liming was most relevant (35%). GHG emissions from cultivation ranged between 0.36 (P2) and 2.69 kg CO2eq kg-1harvested chestnut (P3).
Figure 2 - [A] GHG emissions from chestnut cultivation. [B] Contribution of GHG type to cultivation emissions. * Only 20% of P3 area was in full production.
Figure 3 presents the results for fresh chestnut processing. Total GHG emissions were 0.05 kg CO2eq kg-1harvested chestnut, with the most significant contributions coming from propane
production and combustion (61%).
Figure 3 – GHG emissions of fresh chestnut processing.
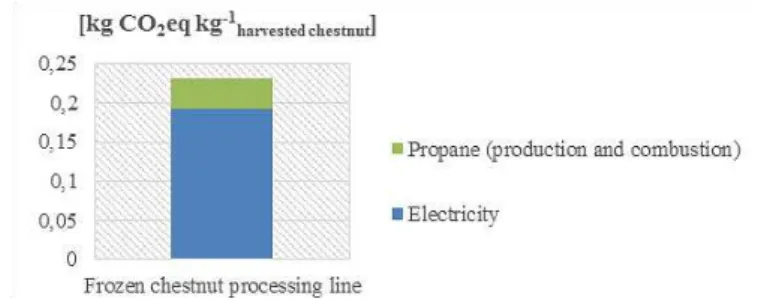
Figure 4 shows the results for frozen chestnut processing. GHG emissions were 0.23 kg CO2eq kg-1harvested chestnut, with electricity being responsible for the highest share of GHG
5
Figure 4 – GHG emissions of frozen chestnut processing. 4. CONCLUSIONS
This paper assessed the GHG intensity of Portuguese frozen and fresh chestnut. The GHG intensity varied due to the diversity of farming systems and processing type. The overall GHG intensity ranged between 0.4-2.7 (fresh) and 0.6-2.9 (frozen) kg CO2eq kg-1harvested chestnut. It
was concluded that cultivation emissions were mainly due to fertilizer production and application (45-62%). Total GHG emissions from cultivation ranged between 0.36-2.69 kg CO2eq kg-1harvested chestnut. Regarding the processing stage, emissions from chestnut processing
ranged between 0.05 (fresh) and 0.23 (frozen) kg CO2eq kg-1harvested chestnut. The most
significant GHG emissions for the fresh line came from propane (61%); however, for the frozen line, electricity was most significant (83%). The results of this study demonstrate the importance of resource management practices at the cultivation stage, namely an efficient use of fertilizers and fossil fuels.
ACKNOWLEDGEMENTS
This research was supported by ECODEEP project (Eco-efficiency and Eco-management in the Agro Industrial sector, FCOMP–05–0128–FEDER–018643), FEDER funds through
“Programa Operacional Factores de Competitividade” - COMPETE and by the Portuguese
Science and Technology Foundation (FCT) project FCOMP-01-0124-FEDER-029055 (PTDC/EMS-ENE/1839/2012), project FCOMP-01-0124-FEDER-021495 (PTDC/SEN-TRA/117251/2010), and project FCOMP-01-0124-FEDER-022692. Was also supported by the R&D project EMSURE (CENTRO-07-0224-FEDER-002004).
REFERENCES
[1] F. Figueiredo, É. Castanheira, M. Feliciano, A. M. Rodrigues, A. Peres, F. Maia, A. Ramos, J. Carneiro, V. Coroama, F. Freire, “Carbon footprint of apple and pear: Orchards, storage and distribution”. Energy for Sustainability 2013, Sustainable Cities: Designing for People and the Planet, Coimbra, Portugal, (2013).
[2] P. Quinteiro, A. C. Dias, L. Pina, B. Neto, B. G. Ridoutt, L. Arroja, “Addressing the
freshwater use of a Portuguese wine (‘vinho verde’) using different LCA methods”. Journal of Cleaner Production, vol. 68, pp. 46-55, (2014).
[3] F. Figueiredo, P. Marques, É. Castanheira, L. Kulay, F. Freire, “Greenhouse gas
6
Symbiosis International Conference 2014, Athens, Greece, (2014).
[4] D. Rosa, “Life-cycle assessment of chestnut and tomato in Portugal”. Environmental Engineering Integrated Master Thesis. University of Coimbra, Portugal, (2014).
[5] FAO (Food and Agriculture Organization of the United Nations). Production of Chestnut by countries. Statistics Division. http://faostat.fao.org/site/339/default.aspx (accessed November 2014).
[6] INE (Instituto Nacional de Estatística), “Estatísticas Agrícolas 2012”. Lisboa. http://www.ine.pt/ngt_server/attachfileu.jsp?look_parentBoui=162283087&att_display =n&att_download=y (accessed November 2014).
[7] IPCC (Intergovernmental Panel on Climate Change), "IPCC Guidelines for National Greenhouse Gas Inventories - volume 4: Agriculture, Forestry and Other Land Use", Hayama, Japan, (2006).
[8] N. Jungbluth, “Erdöl. Sachbilanzen von Energiesystemen”. Final report No. 6
ecoinvent data v2.0, Editors: Dones R., Vol. 6, Swiss Centre for LCI, PSI, Dübendorf and Villigen, (2007).
[9] T. Nemecek, T. Kägi, S. Blaser, “Life Cycle Inventories of Agricultural Production
Systems”, Ecoinvent report version 2.0, Vol. 15, Swiss Centre for LCI, ART, Duebendorf and Zurich, (2007).
[10] M. Spielmann, C. Bauer, R. Dones, and M. Tuchschmid, “Transport Services”. Ecoinvent report no. 14. Swiss Centre for Life Cycle Inventories, Dübendorf, CH, (2007).
[11] EPA (Environmental Protection Agency), “Liquefied Petroleum Gas Combustion”.
Emissions Factor Documentation for AP-42, Section 1.5.
http://www.epa.gov/ttnchie1/ap42/ch01/final/c01s05.pdf (accessed November 2014). [12] R. Garcia, P. Marques, F. Freire, “Life-cycle assessment of electricity in Portugal”.
![Figure 2 - [A] GHG emissions from chestnut cultivation. [B] Contribution of GHG type to cultivation emissions](https://thumb-eu.123doks.com/thumbv2/123dok_br/16982635.763019/4.892.118.783.298.531/figure-ghg-emissions-chestnut-cultivation-contribution-cultivation-emissions.webp)