ISSN: 1809-4430 (on-line)
_________________________
1 Eng° Industrial, Prof. Doutor, Programa de Engenharia Industrial, Universidad de Pamplona/Pamplona - Colômbia, Fone: (57)
3132613340, oscarortiz@unipamplona.edu.co
2 Microbióloga, Prof. Doutor, Departamento de Microbiologia, Universidad de Pamplona/Pamplona - Colômbia,
raquel.villamizar@gmail.com
3 Eng° químico, Director División Sostenibilidad GAIA S.A/Envigado - Colômbia, cnaranjo@gaiasa.com
4 Eng° Industrial, Prof. Doutor - Vice-president for Research, Universitaria Agustiniana (Uniagustiniana)/Bogotá - Colômbia,
rafael.garcia@uniagustiniana.edu.co
CARBON FOOTPRINT OF THE COLOMBIAN COCOA PRODUCTION
Doi:http://dx.doi.org/10.1590/1809-4430-Eng.Agric.v36n2p 260-270/2016
OSCAR O. ORTIZ-RODRÍGUEZ1, RAQUEL A. VILLAMIZAR-GALLARDO2, CARLOS
A. NARANJO-MERINO3, RAFAEL G. GARCÍA-CACERES4, MARÍA T. CASTAÑEDA-GALVÍS5
ABSTRACT: Cocoa is an important commercial crop in the tropics; and estimating the carbon emissions in the producing-areas is a worthwhile effort. The main goal of the current paper was to evaluate the carbon footprint (CF) per kilogram of Colombian cocoa bean produced under conventional and agroforestry managements, following the methods proposed by PAS 2050. In this research, we compared our results to other worldwide researches, showing an overview of the current limitations and challenges involving the CF researches. Our results showed that all calculated environmental burdens were lower for the conventional management. In the agroforestry practice, composting of cocoa pod husks contributed with approximately 34.00E+00 g methane and 2.55E+00 g nitrous oxide emissions per kilogram of cocoa grain produced. Therefore, such practice could reduce CF by 6.00E+00 kg CO2 Eq kg-1, which is certainly a significant amount. These cocoa residues left on the ground have a strong impact on CF of both studied managements due to the anaerobic decomposition of organic matter, which represents more than 85% of emissions. We concluded that both evaluated production processes can emit environmental burdens at the same magnitude. Definitely, there is a widespread need to improve cocoa production system by changing old and less productive plants to the so called clones to ensure cocoa yield and quality worldwide.
KEYWORDS: Carbon footprint, climate changes, global warming potential, Theobroma cacao L.
PEGADA DE CARBONO DA PRODUÇÃO DE CACAU COLOMBIANO
RESUMO: O cacau é uma importante cultura comercial nos trópicos e estimar as emissões de carbono para áreas de melhoria de segmentação é um esforço que vale a pena. Portanto, o principal objetivo do presente trabalho foi avaliar a pegada de carbono (CF) de grãos de cacau colombianos por kg utilizando a metodologia por PAS 2050. Nesta pesquisa, discutiram-se os resultados e apresentou-se uma visão geral das limitações percebidas e dos desafios atuais de pesquisa CF. Os resultados mostram que todas as cargas foram calculadas e encontram-se rebaixadas para a tecnologia convencional. A compostagem contribuiu com aproximadamente 34.00E + 00 g de metano e 2.55E + 00 g de óxido nitroso por quilograma de cacau. Assim, esta prática é capaz de reduzir o CF por 6.00E + 00 kg CO2 eq kg-1, que é certamente significativo. Resíduos deixados no solo, como é o caso da casca de cacau, têm um forte impacto sobre a CF de ambas as tecnologias estudadas devido à decomposição anaeróbia da matéria orgânica, o que representa mais de 85% das emissões. Pode-se concluir que o processo de produção selecionado pode emitir cargas ambientais com a mesma ordem de grandeza, utilizando-se das duas abordagens tecnológicas diferentes, vulgarmente utilizadas neste campo. Então, definitivamente, não é uma necessidade generalizada para promover a modernização da produção de cacau por uma transição em que as velhas e menos produtivas plantas são substituídas pelos chamados clones, a fim de garantir a produtividade do cacau mundial de qualidade.
PALAVRAS-CHAVE: pegada do carbono, alterações climáticas, potencial de aquecimento global,
INTRODUCTION
Climate change is one of the main environmental impacts that threats the entire world, being one of the greatest environmental challenges faced by global agriculture (ALENCAR et al. 2013;
ORTIZ et al., 2015). In 2010, investigations stated that the agricultural sector contributed with 15 to
17% of total anthropogenic emissions of greenhouse gases - GHG (IPCC, 2011; PONSIOEN & BLONK, 2012). Currently, carbon footprint (CF) has been a well known method of measuring the amount of GHGs discharged throughout the lifecycle of a product or a service (DRUCKMAN et al., 2011; CARBON TRUST, 2007; PLASSMANN et al. 2010).
During the last five years, there has also been growing interest in calculating and evaluating the amount of GHGs released in the agricultural production by using CF cradle-to-farm-gate measurements (PAGE et al., 2012; CHENG et al., 2011; BOCCHIOLA et al., 2013; DONG et al., 2013; KISSINGER, 2013; KNUDSEN et al., 2014).
Cocoa (Theobroma cacao L) is an important commercial crop in the tropics; therefore, the
estimation of carbon emissions in producing-areas becomes a rewarding endeavor. Since the Abidjan Cocoa Declaration, in 2012, the cocoa sector has gained increasing attention. With that, it was published the Cocoa Global Agenda that aimed at developing new knowledge with the purpose of combining increased yield, technological innovation and sustainability in the cocoa production chain.
Colombia is the fourth Latin American cocoa producer after Brazil, Ecuador and the Dominican Republic. Reports showed that in 2012 cocoa world production reached 5,000,000 tons (ICCO, 2012). In the same year, Colombia grew 143,645 hectares and reached a production of around 49,509 tons, accounting thus for a yield of 446 kg ha-1. This is still a low number when compared to Ivory Coast (700 kg ha-1), which is the first world producer (FAO, 2014). If added together, agriculture and forestry hold the fifth place in the Colombian economy making up the most important sectors, which contribute to 9% of gross domestic product (GDP), 21% of total exports, 19% of national employment and 66% in rural areas (GARCÍA-CÁCERES et al., 2014). Based on the the Cocoa Development Ten Year Plan 2012-2021, a total of 660,000 hectares are available for cocoa cultivation in Colombia. The same plan includes the renewal of 130,000 hectares, replacing old and less productive trees by clones or hybrids to ensure cocoa grain yield and quality worldwide.
Therefore, since cocoa farming is a key activity worldwide and highly active in the tropics, the main objective of this paper was to evaluate the CF of cocoa production in Colombia, following the method proposed by PAS 2050 and the guidelines of the GHG Protocol developed by the World Resources Institute (BSI, 2008a, b; SINDEN, 2009). In short, the research aimed to identify environmental impacts to be mitigated, discuss the results and provide an overview of the current limitations and challenges in this sector.
MATERIAL AND METHODS
Carbon footprint (CF) was estimated for two management types of cocoa production (conventional and agroforestry). Measurements were in accordance with the PAS 2050 methodology, which is based upon ISO 14040/44 for Life Cycle Assessment (LCA). This methodology accounts all GHG emissions including CO2, N2O and CH4. The CF calculations were carried out using the Umberto software. In this paper, the production scenarios were set at a cradle-to-farmgate basis, considering the functional unit as “the production of one kg of cocoa beans”. The lifecycle of cocoa trees was assumed to be 30 years for both systems. The emissions from cocoa pod husk left on the plantation ground were evaluated as composting system, since this material is burnt or even left to decompose outdoors without any environmental control.
North of Santander. These are the top five producing-areas in the country, and their production accounts for 95% of total domestic production.
The conventional management yields 400 to 500 kg of cocoa per hectare every year. This cultivation model is used in 65% of the Colombian cocoa crops; it features low yields and planting densities, aside from the use of old tools that promote medium susceptibility to pests and diseases.
On the other hand, the agroforestry management reaches yearly yields between 1,200 and 1,500 kg of cocoa per hectare. In this system, we sampled three varieties: clone CCN-51, clone ICS-39 and a hybrid. Both clones show yields higher than 1500 kg ha-1 year-1, which partly is due to their resistance to pests and diseases; whereas, the hybrid achieve productions between 1000 and 1200 kg ha-1 year-1 (MARTÍNEZ-ÁNGEL et al., 2015).
For both production systems, we estimated emissions until cocoa beans leave the field. For the assessments, we took into account transportation, infrastructure, soil and energy use besides raw material consumption, being divided into three phases: establishment, development and production.
The establishment phase takes one year and consists of a period without bean production. The development lasts from the 2nd to the 5th year, and corresponds to the beginning of cocoa production. Finally, the production is the phase at which plants reach their maximum development, which is within the 6th and the 30th year. Tables 1.1, 1.2, 1.3 show the amount of inputs used throughout the three different phases during the cocoa production.
TABLE 1.1. Inputs during the establishment phase.
Input Material Conventional management Agroforestry Management Units
Seed 1.10E+03 1.32E+03 Unt ha-1y-1
Plastic bags 1.10E+03 1.20E+03 Unt ha-1y-1
Organic fertilizer 7.75E+02 6.00E+02 kg ha-1y-1
Inorganic fertilizer 50:30:20 1.74E+02 1.20E+02 kg ha-1y-1
Formicide 1.00E+00 1.00E+00 kg ha-1y-1
Lime 1.80E+02 1.80E+02 kg ha-1y-1
Permanent shading 1.50E+02 1.50E+02 Unt ha-1y-1
Temporary shading 8.00E+02 8.00E+02 Unt ha-1y-1
Plantain (suckers) 3.00E+02 4.00E+02 Unt ha-1y-1
Clippers 3.30E-01 3.30E-01 Unt ha-1y-1
Matchet 3.30E-01 3.30E-01 Unt ha-1y-1
Shovel 3.30E-01 3.30E-01 Unt ha-1y-1
Bar 3.30E-01 2.00E+00 Unt ha-1y-1
Posts 2.00E+00 3.00E+00 Unt ha-1y-1
Barbed wire 2.20E+01 2.20E+01 m2 ha-1y-1
Hoe 3.30E-01 3.30E-01 Unt ha-1y-1
Chemical fertilizer (40:20:40) - 2.00E+02 kg ha-1y-1
Polyester net - 1.00E+01 m2 ha-1y-1
Herbicide - 4.00E+00 L ha-1y-1
Scythe - 2.30E-01 Unt ha-1
Razor - 3.30E-01 Unt ha-1y-1
Substratum - 2.50E+00 m3 ha-1y-1
Foliar Fertilizer - 1.00E+00 L ha-1y-1
TABLE 1.2. Inputs during the development phase.
Material Conventional management Agroforestry Management Units
Organic fertilizer 2.40E+03 1.80E+03 kg ha-1y-1
Fungicide 1.00E+00 1.00E+00 L ha-1y-1
Formicide 1.00E+00 1.00E+00 kg ha-1y-1
Lime 9.60E+02 7.20E+02 kg ha-1y-1
Matchet 6.70E-01 - Unt ha-1y-1
Clippers 2.50E-01 1.10E-01 Unt ha-1y-1
Scythe 2.33E-01 1.10E-01 Unt ha-1y-1
Chemical fertilizer (50:30:20) - 1.20E+02 kg ha-1y-1
Foliar Fertilizer - 1.00E+00 L ha-1y-1
Chemical fertilizer (40:20:40) - 1.00E+02 kg ha-1y-1
TABLE 1.3. Inputs during the production phase.
Material Conventional management Agroforestry Management Units
Chlorpyrifos 3.00E+00 - L ha-1y-1
Glyphosate 8.75E+00 - L ha-1y-1
Paraquat 1.50E+00 - kg ha-1y-1
Lime 1.08E+04 6.24E+03 kg ha-1y-1
Matchet 2.00E+00 3.30E-01 Unt ha-1y-1
Pruning shears 3.00E+00 3.30E-01 Unt ha-1y-1
Sisal bags 2.50E+00 2.50E+00 Unt ha-1y-1
Fiber Sacks 5.00E+00 5.00E+00 Unt ha-1y-1
Chemical fertilizer (50:30:20) - 1.44E+02 kg ha-1y-1
Organic fertilizer - 7.80E+00 kg ha-1y-1
Fungicide - 1.00E+00 L ha-1y-1
Formicide - 1.00E+00 kg ha-1y-1
Drawers fermentation - 1.00E+00 Unt per farm
Marquee - 3.30E-01 Unt ha-1y-1
Regarding the facilities and soil use, we considered a 3-hectare farm for the conventional management, and more than 3 ha for the other management, taking into account the use of materials as stakes, barbed wire, fermentation boxes and cocoa house covering material. Such infrastructure was assumed to last 30 years. Transportation from nursery to the farms was assumed to carry 1,100 seedlings in the conventional management, and 1,320 in the agroforestry, both covering an average distance of 200 km. Yet fertilizers and pesticides travelled an average of 400 km. This last calculation was based on product weight and traveled distance and was given in tons kilometers (tkm).
Air emissions were estimated using the method proposed by the Intergovernmental Panel on Climate Change (IPCC, 2007), evaluating the N2O emissions based on net N added to the soil by human activities (e. g., synthetic or organic fertilizers, manure, crop straw and sewage sludge) and
N mineralization. The conversion of N2O–N emissions into N2O emissions was made through the following [eq. (1)]:
N2O = N2O–N * 44/28 (1)
The CO2 emissions from urea fertilization were calculated according to the following [eq. (2)]:
CO2 – C emission = M * EF (2)
In which the general emission factor (EF) of urea was 0.20, being equivalent to the quotient between the carbon content of this compound and its atomic weight [20% for CO (NH2)2]. Yet the CO2 emissions due to liming were based on the following [eq. (3)]:
Regarding the methane (CH4) emissions, we took as reference the data published by the IPCC (2007), at the Good Practice Guide, to estimate the standard emissions of this gas that result from solid residue disposal onto the soil (level 1), see [eq. (4)].
Lo = MCF * DOC * DOCF * F * (16/12) (4) where,
Lo - Potential methane generation per unit of solid residue (kg CH4 per Kg solid residue); MCF - Methane Correction Factor (0.4);
DOC - Degradable organic carbon rate (kg C per Kg of residue);
DOCF - DOC rate actually degraded (standardly defined as 0.77 of the DOC value reported by IPCC (2007);
F - Carbon fraction released as methane, being 0.5 of the IPCC standard from 2007; 16/12 - Conversion ratio carbon to methane.
With respect to the amount of nitrogen, ARLORIO et al. (2005) concluded that cocoa pod husk has a nitrogen content of 2.90E+01 +1.3 g kg-1, while its moisture content is 1.01E+02 +6.0.
RESULTS AND DISCUSSION
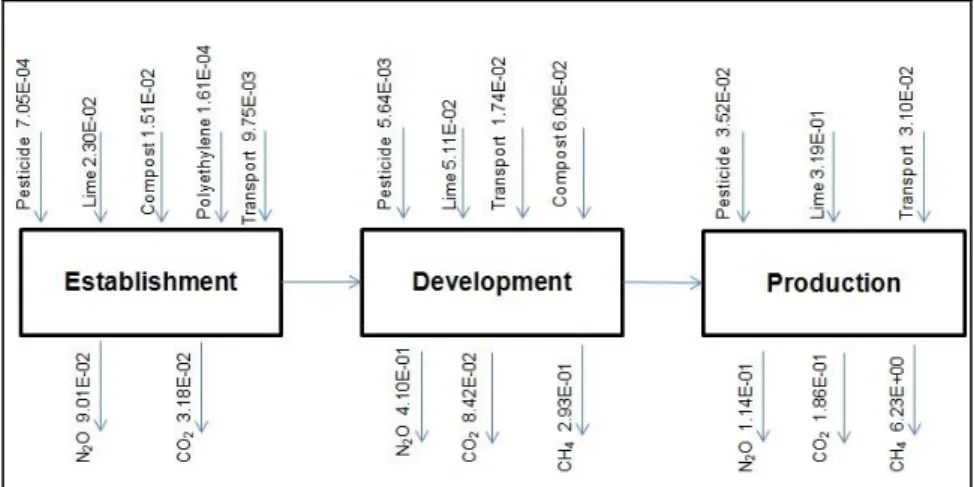
All calculated environmental burdens were less significant in the conventional management, which emitted about 8.00E+00 kg CO2 eq kg-1 throughout the cocoa bean lifecycle. Two percent of this amount corresponds to the establishment phase, while the development and product ion were responsible for 12% and 86%, respectively. During the development phase, it was emitted about 6.91E+00 kg CO2 Eq kg-1, of which the lime accounted for 83%, transportation for 8% and use of pesticides for 9%, as outlined in Figure 1.
FIGURE 1. Conventional management emissions in kg CO2 Eq Kg-1
FIGURE 2. Agroforestry management emissions in kg CO2 Eq Kg-1.
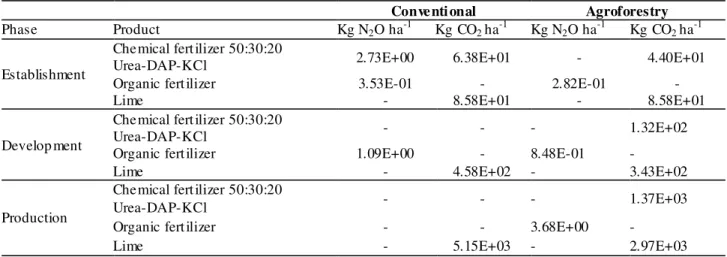
The foliar fertilizer used in the areas under study was Nutrimins, which is a mixture of components in the form of chelates. This compost consists ma inly of urea nitrogen with magnesium, sulfur, boron, copper, iron, manganese, molybdenum, zinc salts, in addition to plant hormones, which are present in minor amounts. This fertilization system is one of the major issues related to GWP, since it increases the amount of CO2 equivalent emitted in cocoa production. Similar percentages were found by other authors as NTIAMOAH & AFRANE (2008) and ORTIZ et al. (2014). Hence, as direct emissions from chemical fertilization and liming are a significant challenge in farming systems, they were estimated and are shown in Table 2.
TABLE 2. Direct emissions from chemical fertilizations and liming in both conventional and agroforestry cocoa production systems.
Conventional Agroforestry
Phase Product Kg N2O ha-1 Kg CO2 ha-1 Kg N2O ha-1 Kg CO2 ha-1
Establishment
Chemical fertilizer 50:30:20
Urea-DAP-KCl 2.73E+00 6.38E+01 - 4.40E+01
Organic fertilizer 3.53E-01 - 2.82E-01 -
Lime - 8.58E+01 - 8.58E+01
Develop ment
Chemical fertilizer 50:30:20
Urea-DAP-KCl - - - 1.32E+02
Organic fertilizer 1.09E+00 - 8.48E-01 -
Lime - 4.58E+02 - 3.43E+02
Production
Chemical fertilizer 50:30:20
Urea-DAP-KCl - - - 1.37E+03
Organic fertilizer - - 3.68E+00 -
Lime - 5.15E+03 - 2.97E+03
In terms of environmental benefits, we measured a few variables like dry biomass per hectare, the amount of carbon fixed by plantain (associated crop), cocoa and walnut yield and the total sum of carbon fixed by the cocoa agroforestry system in ton ha-1 over a 15-year time horizon. Moreover, we evaluated the emissions from cocoa pod husk left on the ground as in composting process. The results have shown that CH4 and N2O emissions throughout biodegradation process depend on the type of composting system and on the time it takes. Around 8.50E+00 kg cocoa pod husk yields 1 kg of cocoa, these residues left on the ground can produce 2.60E-01 kg CH4 and 4.00E+00 g N2O, which is equivalent to 7.69E+00 kg CO2 eq kg-1 of CF. The composting of such residues produced 34 g of methane and 2.55 g of nitrous oxide, all of which is equivalent to a contribution of 1.61E+00 kg CO2 Eq kg-1. Thus, this practice can reduce the CF of cocoa production in 6.00E+00 kg CO2 eq kg-1.
the reduction of environmental burdens in association with an intensive agricultural management (NEMECEK et al., 2011).
However, such emissions are not clearly estimated, since there are variations in cropping area, type of chemical fertilizers, product offer and demand in the coming years due to food security factors involved in agriculture, apart from other considerations such as energetic consumption derived from CO2 emissions and fertilizer use (CHENG et al., 2011). Even with all this, our study has great contribution in providing crucial information on environmental impacts caused by Colombian cocoa production throughout the entire cycle.
Next, we present a discussion of our results and show an overview of the current limitations and challenges to be overcome by CF researches. In this sense, NTIAMOAH & AFRANE (2008) evaluated the environmental impact cocoa farming and processing in Ghana (the second producer worldwide), by means of a lifecycle assessment method (LCA). These authors reported emissions of 3.22E+00E-01 kg CO2 Eq Kg-1 for each kg of cocoa produced. In turn, ORTIZ et al. (2014), evaluating global warming potential emissions of cocoa farms in Colombia, obtained emissions between 2 to 4 kg CO2 Eq Kg-1 cocoa.
The above-mentioned studies have differences on the approach used for GHG emission calculations, mainly regarding the methodology used. Thus, their results are expressed not only in different functional units, but also contrasting agricultural practices and regional infrastructure, which change from one country to another.
Transportation mode is crucial in reducing CO2 emissions (Da SILVA et al., 2010), the infrastructure comes to be particularly important at this point. None of these studies showed results in terms of the product lifecycle, considering the three stages of crop production (establishment, development and production). However, they clearly define their corresponding functional units, which are the basis of comparison with the current study.
Furthermore, it is clearly shown the differences in consumption among the evaluated countries, being not only due to variations related to bio-climatic differences but also because of their particular consumption custom. This fact is supported by PATHAK et al., 2010, who stated that changes in eating habits could improve GHG mitigation.
For this purpose, we compared our outcomes to those of other studies carried in different countries that outlined results on staple foods such as rice, potato and corn, which are fundamental to food security in Colombia. A few studies emphatically focused on rice crops have been performed over the past seven years, of which we can cite BLENGINI & BUSTO (2009); WANG et al. (2010); ZHANG et al. (2010); KOGA & TAJIMA (2011); HOKAZONO & HAYASHI (2012); LINQUIST et al. (2012); XIAOMING et al. (2013); THANAWONG et al. (2014); MOHAMMADI et al. (2015); PATHAK et al. (2010); potato in PISHGAR-KOMLEH et al. (2011); KRAMER et al. (1999); PATHAK et al. (2010); FERREIRA et al. (2011). Other studies targeting forage maize like the one developed by PATHAK et al. (2010).
Firstly, previous studies have all evaluated the combined impact resulting from GWP and energy use. For example, China is interested in using potato as an energy source for bioethanol production, since farming is one of the most important economic activities in terms of both production and consumption of bioenergy (OZKAN et al., 2004). Secondly, as an agroforestry crop, cocoa has clear advantages whether compared to other crops such as rice, potato and wheat. After calculating biomass, carbon fixation and carbon storage in cocoa and laurel (Cordia alliodora)
In environmental terms, this means that when the Colombian cocoa is grown under the shade of other trees, carbon sink and biodiversity are both favored. Besides benefits from certifications that can be attained by using such system, especially the Rainforest Alliance and the Carbon Labelling, which have brought good feedback from consumers (EDWARDS-JONES et al., 2009). Thus, the evaluation of food products is a dynamic process in which not only environmental information is gathered, but also knowledge on consumer perceptions of product quality (ATSUSHI et al., 2010). Thirdly, rice cropping generates elevated methane emissions from the organic matter decomposition under flooding conditions. In turn, potato and wheat are transitory crops, of which the carbon fixation is not taken into account in the PAS2050 method. Nationally, cocoa demand is greater than supply, increasing thus the imports. Indeed, this scenario is favorable to the farmers who becomes competitive, also allowing them to negotiate large amounts with great Colombian industries in this sector. Added to the low carbon emissions, Colombian cocoa exports can become quite interesting by the end of the Cocoa Development Ten-Year Plan, which will be concluded in the year of 2021. In this way, the country would be able to reduce environmental impacts, besides increasing economic growth and maximizing population welfare. And lastly, it is noteworthy mention that fertilization management was the practice that most co ntributed to the environmental burden. In contrast, other practices such as soil acidity correction, control of weeds, pests and diseases, pruning as well as the initial cocoa bean processing consisting of drying, cleaning and packaging had CO2 emissions, from energy consumption of these practices, almost null.
CONCLUSIONS
Yield increases per unit of crop area had relationship with the crop management type. Thus, the maintenance, at constant levels, of fertilizer doses enables the reduction of N2O emissions. We also concluded that both the agroforestry and the conventional management, for cocoa production, emit environmental burdens (measured in GWP kg CO2 Eq Kg-1) at the same order of magnitude.
ACKNOWLEDGMENTS
This study has been fully financed by the Administrative Department of Science, Management, and Innovation – COLCIENCIAS –, Inter-American Development Bank (IDB) and World Bank (WB) BIRF, Project Reference 0371- 2012.
REFERENCES
ALENCAR, L. P. de; SEDIYAMA, G.C.; MANTOVANI, E.C., MARTINEZ, M.A. Tendências recentes nos elementos do clima e suas implicações na evapotranspiração da cultura do milho em Viçosa - MG. Engenharia Agrícola, Jaboticabal, v.31, n.4, p.631-642, 2011.
ARANZAZU, H.L.F. Evaluación de híbridos y clones de cacao en rendimiento y calidad para la zona marginal baja cafetera bajo sistema agroforestal. Manizales: CORPOICA CASA LUKER. 2003. 82 p.
ARLORIO, M.; COÏSSON, J.D.; TRAVAGLIA, F.; VARSALDI, F.; MIGLIO, G.; LOMBARDI, G.; MARTELLI, A. Antioxidant and biological activity of phenolic pigments from Theobroma cacao hulls extracted with supercritical CO2. Food Research Inte rnational, New York, v.38, n.8-9, p.1009–1014, 2005.
ATSUSHI K, Y.W.; WADA, Y.; KAMADA, A.; MASUDA, T.; OKAMOTO, M.; GOTO, S.; TSUZUKI, D.; CAI, D.; OKA, T.; DAN, I. Interactive effects of carbon footprint information and its accessibility on value and subjective qualities of food products. Appetite, London, v. 55, p. 271– 278, 2010.
BLENGINI, G.A.; BUSTO, M. The life cycle of rice. LCA of alternative agri-food chain
management systems in Vercelli (Italy). Journal of Environme ntal Manage ment, Oxford, v.90, p.1512-1522, 2009.
BSI, PAS 2050:2008. Specification for the assessment of the life cycle greenhouse gas emissions of goods and services. London: British Standards, 2008a.
BSI, Guide to PAS 2050. How to assess the carbon footprint of goods and services. London:
British Standards, 2008b.
CARBON TRUST. Carbon footprint measurement methodology. London., 2007.
CHENG, K.; PAN, G.; SMITH, P.; LUO, T.; LI, L.; ZHENG, J.; ZHANG, X.; HAN, X.; YAN, M. Carbon footprint of China’s crop production-An estimation using agro-statistics data over 1993– 2007. Agriculture, Ecosystems & Environment, Amsterdam, v.142, n.3-4, p.231– 237, 2011. Da SILVA, V.P.; van der WERF, H.M.G.; SPIES, A.; SOARES, S.R. Variability in environmental impacts of Brazilian soybean according to crop production and transport scenarios. Journal of Environmental Manage ment, London, v.91, n.9, p.1831–1839, 2010.
DONG, G.; MAO, X.; ZHOU, J.; ZENG, A. Carbon footprint accounting and dynamics and the driving forces of agricultural production in Zhejiang Province, China. Ecological Economics, Amsterdam, v.91, p.38-47, 2013.
DRUCKMAN, A.; CHITNIS, M.; SORRELL, S.; JACKSON, T. Missing carbon reductions? Exploring rebound and backfire effects in UK households. Energy Policy, Surrey, v.39, n.6, p.3572–3581, 2011.
EDWARDS-JONES, G.; PLASSMANN, K.; YORK, E.H.; HOUNSOME, B.; JONES, D.L.; MILÁ I CANALS, L. Vulnerability of exporting nations to the development of a carbon label in the United Kingdom. Environmental Science Policy, Exeter, v.12, n.4, p.479-490, 2009.
FAO – FOOD AND AGRICULTURAL ORGANIZATION OF THE UNITED NATIONS. FAO,
2010. Disponível em: <http://www.faostat.fao.org/>. Acesso em: 03 Abr. 2014
FERREIRA, A.F.; RIBAU, J.P.; SILVA, C.M. Energy consumption and CO2 emissions of potato peel and sugarcane biohydrogen production pathways, applied to Portuguese road transportation.
Inte rnational Journal of Hydrogen Ene rgy, Oxford, v.36, n.21, p.13547-13558, 2011. GARCÍA-CÁCERES, R.G.; PERDOMO, A.; ORTIZ, O. BELTRÁN, P.; LÓPEZ, K.
Characterization of the supply and value chains of Colombian cocoa. DYNA, Medellin, v.81, n.187, p.30-40, 2014.
HOKAZONO, S.; HAYASHI, K. Variability in environmental impacts during conversion from conventional to organic farming: a comparison among three rice production systems in Japan.
Journal of Cleaner Production, Amsterdam, v.28, p.101-112, June 2012
ICCO - International Cocoa Organization. Abidjan cocoa declaration and global cocoa agenda.
World Cocoa Conference. Disponível em: <http://www.icco.org 2012>. Acesso em: 15 Mar. 2013
IPCC – Intergovernmental Panel on Climate Change. Climate Change 2007: The physical science basis. Cambridge: Cambridge University Press, 2007.
IPCC– Intergovernmental Panel on Climate Change. Special report on rene wable energy sources and climate change mitigation. In: EDENHOFER, O. et al. (Ed.). Working group III of the
Intergovernmental Panel on Climate Change. Cambridge: Cambridge University Press; 1075p. 2011.
KNUDSEN, M.T.; MEYER-AURICH, A.; OLESEN, J.E.; CHIRINDA, N.; HERMANSEN, J.E. Carbon footprints of crops from organic and conventional arable crop rotations – using a life cycle assessment approach. Journal of Cleaner Production,Oxford, v.64, n.1, p.609-618, 2014. KOGA, N.; TAJIMA, R. Assessing energy efficiencies and greenhouse gas emissions under bioethanol-oriented paddy rice production in northern Japan. Journal of Environmental Management, Oxford, v.92, n.3, p.967-973, 2011.
KRAMER, K.J.; MOLL, H.C.; NONHEBEL, S.; WILTING, H.C. Greenhouse gas emissions related to Dutch food consumption. Energy Policy, Surrey, v.27, n.4, p.203–216, 1999.
LINQUIST B.; GROENING, K.J. van; ADVIENTO-BORBE, M.A.; PITTELKOW, C.; KESSEL, C. van. An agronomic assessment of greenhouse gas emissions from major cereal crops. Global Change Biology, Oxford, v.18, n.1, p.194-209, 2012.
MARTÍNEZ-ÁNGEL J.D.; VILLAMIZAR-GALLARDO, R.A.; ORTÍZ-RODRÍGUEZ, O.O. Characterization and evaluation of cocoa (Theobroma cacao L.) pod husk as a renewable energy
source. Agrociencia, San Salvador, v.49, n.3, p.329-345, 2015.
MOHAMMADI, A.; RAFIEE, S.; JAFARI, A.; KEYHANI, A.; DALGAARD, T.; KNUDSEN, M.T.; NGUYEN, T.L.T.; BOREK, R.; HERMANSEN, J.E. Joint Life Cycle Assessment and Data Envelopment Analysis for the benchmarking of environmental impacts in rice paddy production.
Journal of Cleaner Production, Oxford, v.106, p.521-532, nov. 2015. doi:10.1016/j.jclepro.2014.05.008
NEMECEK, T.; DUBOIS, D.; HUGUENIN-ELIE, O.; GAILLARD, G. Life cycle assessment of Swiss farming systems: I. Integrated and organic farming. Agricultural System,v.104, n.3, p.217-232, 2011.
NTIAMOAH, A.; AFRANE, G. Environmental impacts of cocoa production and processing in Ghana: life cycle assessment approach. Journal of Cleaner Production,Oxford, v.16, n.16, p.1735-1740, 2008.
ORTIZ, A.; RIASCOS, L.; SOMARRIBA, E. Almacenamiento y tasas de fijación de biomasa y carbono en sistemas agroforestales de cacao (Theobroma cacao) y laurel (Cordia alliodora). Agroforestería en las Américas, n.46, p.26-29, 2008. Disponível em:
<http://www.sidalc.net/repdoc/A3117E/A3117E.PDF>. Acesso em: 03 Feb. 2012
ORTIZ-R, O.O.; VILLAMIZAR-G, R.A.; RANGEL, J.M. Applying life cycle management of colombian cocoa production. Food Science and Technology, Campinas, v.34, n.1, p.62-68, 2014. ORTIZ-RODRIGUEZ, O.O.; NARANJO, C.; GARCÍA-CACERES, R.G;
VILLAMIZAR-GALLARDO, R.A. Revista Brasileira de Engenharia Agrícola e Ambiental, Campina Grande, v.19, n.9, p.823–828, 2015.
OZKAN B.; AKCAOZ, H.; FERT C. Energy input-output analysis in Turkish agriculture.
Renewable Energy, Oxford, v.29, p.39-51, 2004.
PAGE, G.; RIDOUTT, B.; BELLOTTI, B. Carbon and water footprint tradeoffs in fresh tomato production. Journal of Cleaner Production, Oxford, v.32, p.219–226, Sept. 2012.
PATHAK, H.; JAIN, N.; BATHIA, A.; PATEL, J.; AGGARVAL, P.K. Carbon footprints of Indian food items. Agricultural Ecosystem & Environment, v.139, n.1-2, p.66–73, 2010.
PISHGAR-KOMLEH, S.H.; SEFEEDPARI, P.; RAFIEE, S. Energy and economic analysis of rice production under different farm levels in Guilan province of Iran. Energy, Whylie, v.36, n.10, p.5824-5831, 2011.
PLASSMANN, K.; NORTON, A.; ATTARZADEH, N.; JENSEN, M.P.; BRENTON, P.;
PONSIOEN, T.C.; BLONK, T.J. Calculating land use change in carbon footprints of agricultural products as an impact of current land use. Journal of Cleane r Production, Oxford, v.28, p.120-126, 2012.
SINDEN G. The contribution of PAS 2050 to the evolution of international greenhouse gas
emission standards. International Journal of Life Cycle Assessment, Landsberg, v.14, n.3, p.195– 203, 2009.
THANAWONG, W.; PERRET, S.R.; BASSET-MENS, C. Eco-efficiency of paddy rice production in Northeastern Thailand: a comparison of rain-fed and irrigated cropping systems. Journal of Cleaner Production, Oxford, v.73, p.204-217, 2014.
WANG, M.; XIA, X.; ZHANG, Q.; LIU, J. Life Cycle Assessment of a rice production system in Taihu region, China. International Journal of Sustainable Development & World Ecology, London, v.17, n.2, p.157-161, 2010.