310
Journal of Applied Biomechanics, 2014, 30, 310-315 http://dx.doi.org/10.1123/jab.2013-0038
© 2014 Human Kinetics, Inc.
Young Swimmers’ Classification Based on Kinematics,
Hydrodynamics, and Anthropometrics
Tiago M. Barbosa,1,7 Jorge E. Morais,2,7 Mário J. Costa,3,7
José Goncalves,2,4 Daniel A. Marinho,5,7 and António J. Silva6,7
1Nanyang Technological University; 2Polytechnic Institute of Bragança; 3Polytechnic Institute of Guarda; 4Robis Research Group from INESC TEC; 5University of Beira Interior; 6University of Trás-os-Montes and Alto Douro;
7Research Center in Sports Sciences, Health and Human Development (CIDESD)
The aim of this article has been to classify swimmers based on kinematics, hydrodynamics, and anthropometrics. Sixty-seven young swimmers made a maximal 25 m front-crawl to measure with a speedometer the swimming velocity (v), speed-fluctuation (dv) and dv normalized to v (dv/v). Another two 25 m bouts with and without carrying a perturbation device were made to esti-mate active drag coefficient (CDa). Trunk transverse surface area (S) was measured with photogrammetric technique on land and
in the hydrodynamic position. Cluster 1 was related to swimmers with a high speed fluctuation (ie, dv and dv/v), cluster 2 with anthropometrics (ie, S) and cluster 3 with a high hydrodynamic profile (ie, CDa). The variable that seems to discriminate better
the clusters was the dv/v (F = 53.680; P < .001), followed by the dv (F = 28.506; P < .001), CDa (F = 21.025; P < .001), S (F =
6.297; P < .01) and v (F = 5.375; P = .01). Stepwise discriminant analysis extracted 2 functions: Function 1 was mainly defined by dv/v and S (74.3% of variance), whereas function 2 was mainly defined by CDa (25.7% of variance). It can be concluded that
kinematics, hydrodynamics and anthropometrics are determinant domains in which to classify and characterize young swim-mers’ profiles.
Keywords: swimming, kinematics, hydrodynamics, anthropometrics, classification Talent identification in swimming is one of the most
challeng-ing tasks for researchers and sport analysts. Research on expertise, talent identification, and development has tended to be monodisci-plinary.1 Traditional approaches focused on the role of one single
scientific field or trait in expertise and talent identification, such as the relationship between anthropometrics and performance that was so popular in the 1970s and 1980s. However, several charac-teristics (ie, scientific fields, domains, and variables) are related to performance. Hence, expertise and talent identification were started to be seen as a multidisciplinary phenomenon. Multiple test bat-teries were implemented to identify talented athletes. Exploratory designs (notably comparison of cohort groups and correlational studies) were conducted to identify the scientific domains and
independent variables that determine the performance. In con-trast to more traditional approaches, a potentially more valuable conceptual framework for the classification of expertise and talent exists, understanding young athletes as multifactorial, complex, and dynamical systems. The potential for interaction between per-formance determinants (ie, scientific fields, domains, and variables) provides the platform for different and diverse patterns of behavior to emerge on an individual basis.1 To do so, cluster analysis,
consid-ering several scientific disciplines, domains, and variables, might be a solution2 as movement variability should not be disregarded.3
Nevertheless, one significant advantage of behavioral clustering is that no previous assumptions about the structure of the dataset are required to identify similar behaviors. This is a regular procedure in marketing and advertising, for instance, to identify consumer buying behaviors and thereafter create individual consumer cen-tric strategies. Cluster solutions obtained come from “emergent behavior” and not from “pre-existing assumptions.” Thereafter with a classification system developed, it will be straightforward to identify, classify, and design intervention programs accordingly for these and for new athletes in the future.
Recently, a research trend has emerged to try understand the links among all the variables that determine the swimming per-formance.4 Biomechanical characteristics (including kinematics,
kinetics, and anthropometrics) play a major role (approx. 50–60%) in children’s swimming performance.5 So, the classification of
young swimmers based on such characteristics can be a useful tool for talent identification and has never been attempted before.
Swimming is characterized as being an accelerated motion, where the changes in the acceleration within the stroke cycle can be assessed through the body’s intracyclic variations of the horizontal velocity (dv).6 So, Newton’s law of motion
Tiago M. Barbosa is with Nanyang Technological University, Singapore, and with the Research Center in Sports Sciences, Health and Human Development (CIDESD), Vila Real, Portugal. Jorge E. Morais is with the Polytechnic Institute of Bragança and with the Research Center in Sports Sciences, Health and Human Development (CIDESD), Vila Real, Portu-gal. Mário J. Costa is with the Polytechnic Institute of Guarda and with the Research Center in Sports Sciences, Health and Human Development (CIDESD), Vila Real, Portugal. José Goncalves is with the Polytechnic Institute of Bragança and with the Robis Research Group from INESC TEC, Portugal. Daniel A. Marinho is with the University of Beira Interior, Covilhã, and with the Research Center in Sports Sciences, Health and Human Development (CIDESD), Vila Real, Portugal. António J. Silva is with the University of Trás-os-Montes and Alto Douro, Vila Real, and with the Research Center in Sports Sciences, Health and Human Development (CIDESD), Vila Real, Portugal. Address author correspondence to Tiago M. Barbosa at [email protected].
An Official Journal of ISB www.JAB-Journal.com TECHNICAL NOTE
Young Swimmers’ Cluster Grouping 311 F a m = (1)
where F is the resultant force, m the body mass, and a the accelera-tion can be conceptually changed to
Pr D dv m + = (2)
where dv is the speed fluctuation, Pr is the total propulsive force, D is the hydrodynamic drag force, and m is the swimmer’s body mass. It is the resultant vector sum of Pr by D that plays a main part in the dv throughout the swim, as m is fairly constant (neglecting the added mass that a swimmer carries out; to be strict, m = body mass + added water mass).7 While actively swimming, D is a Newtonian
force with the name of active drag (Da) and calculated as
(3)
where Da is the swimmer’s active drag, ρ the density of the water
(assumed to be 1000 kg/m3), v the swimmer’s velocity, and S his/
her projected frontal surface area. From Equations 2 and 3, we find a theoretical relationship between kinematics (eg, dv and v), hydrodynamics (eg, CDa), and anthropometrics (eg, S). However,
humans while performing a motor task (in this case, swimming) can select different strategies to reach the same outcome, as they might be considered “overdeterminate” systems; that is, there is the ability of elements that are structurally different to reach the same function or yield the same output.8 For the case of the D
a, eventually
young swimmers also adopt different, very unique, and individual approaches to change it.
Traditionally, sports performance research is based on the uni-versalistic perspective. Data analysis is conducted considering the sample or the group’s main trend (eg, average differences, average variations, etc.). As a consequence, the individuality of each subject is “diluted” by the main trend of the overall sample and considered as “noise.” The assessment of individual trends and behaviors is a fair novelty in swimming.9 Accordingly, to the best of our
knowl-edge, a classification of young swimmers based on their individual biomechanical characteristics has never been attempted. The aim of this technical note has been to develop a classification system for young talented swimmers based on kinematical, hydrodynamic, and anthropometrical characteristics.
Methods
Sixty-seven young swimmers (34 girls and 33 boys, 12.83 ± 1.26 years old, 159.29 ± 8.569 m of height, 49.40 ± 9.22 kg of body mass, and 1–2 Tanner stages) with at least 4 years of experience in competitive swimming, participating on regular basis in regional- and national-level competitions volunteered as subjects.
Each subject swam a maximal 25-m front-crawl trial with a push-off start. A speedometer cable (Swim speedometer, Swims-portec, Hildesheim, Germany) was attached to the swimmer’s hip.10
The speedometer was placed in the forehead wall of the swimming pool, about 0.2 m above the water surface. A software’s interface in LabVIEW (v. 2009) was used to acquire (f = 50 Hz), display, and process pairwise velocity-time data online during the trial. To transfer data from the speedometer to the software application, a
12-bit resolution acquisition card (USB-6008, National Instruments, Austin, Texas, USA) was used. Thereafter, data were exported to signal-processing software (AcqKnowledge v. 3.5, Biopac Systems, Santa Barbara, USA) and filtered with a 5-Hz cut-off low-pass 4th-order Butterworth filter.10 This apparatus allowed measuring the
mean swimming velocity within the stroke cycle (v). Considering the theoretical background (ie, Equation 2, but more details on this can be obtained elsewhere4), intracyclic variation of the horizontal
velocity of the hip (dv) was measured as:10
(4)
where dv is the intracyclic variation of the horizontal velocity of the hip, v the mean swimming velocity, vi the instant swimming velocity, Fi the acquisition frequency, and n the number of observa-tions. Thereafter, dv was also normalized to the swimming velocity (dv/v). It should be considered that there is an overestimation of approximately 7% analyzing the center of mass forward velocity based on the hip’s assessment.11
Da was calculated with the velocity perturbation method.12 Each
swimmer performed two other maximal 25-m trials at front crawl (with and without carrying the perturbation device). Swimming velocity was assessed at 13m (between 11th and 24th m from the push-off wall). The time spent to cover this distance was measured with a manual stopwatch (Golfinho Sports MC 815, Aveiro, Portu-gal) by two expert evaluators (ICC = 0.97), and the mean value was used for further analysis. Da was calculated as follows.12
(5)
where Da is the swimmer’s active drag at maximal velocity, Db the
resistance of the perturbation buoy, and vb and v the swimming
velocities with and without the perturbation device, respectively. The drag of the perturbation buoy was obtained from the manufac-turer’s technical description (ie, buoy-drag characteristics and its velocity).12 Active drag coefficient (CDa) was calculated by
chang-ing Equation 3 to
(6)
where ρ is the density of the water (assumed to be 1000 kg/m3),
Da the swimmer’s active drag, v the swimmer’s velocity, and S the
swimmer’s projected frontal surface area.
S was measured with a photogrammetric technique;7,13 taking
pictures of the swimmers with a digital camera (DSC-T7, Sony, Tokyo, Japan) in the transverse plane from above.13 Subjects were
on land, standing in the upright and hydrodynamic position wear-ing a regular textile swim body suit, a cap, and goggles.7 On the
camera’s shooting field, a calibration frame with 0.945 m length was placed side by side with the swimmer at the shoulder level. S was measured from the subject’s digital photo with specific area-measuring software (Udruler, AVPSoft, USA).
Swimming performance was also assessed, measuring the time of the 100-m freestyle event during an official short-course competition at regional or national level. The time gap between
Eq 19.01
F a m Eq 19.02
Pr D dv m Eq 19.03
2 a a 1 2 D D v S CEq 19.04
2 . 100 . i i i i i i v v F n dv v F n
Eq 19.05
2 b b a 3 3 b D v v D v v Eq 19.06
a a 2 2 D D C S v F a m Eq 19.02
Pr D dv m Eq 19.03
2 a a 1 2 D D v S CEq 19.04
2 . 100 . i i i i i i v v F n dv v F n
Eq 19.05
2 b b a 3 3 b D v v D v v Eq 19.06
a a 2 2 D D C S v Eq 19.01
F a m Eq 19.02
Pr D dv m Eq 19.03
2 a a 1 2 D D v S CEq 19.04
2 . 100 . i i i i i i v v F n dv v F n
Eq 19.05
2 b b a 3 3 b D v v D v v Eq 19.06
a a 2 2 D D C S v Eq 19.01
F a m Eq 19.02
Pr D dv m Eq 19.03
2 a a 1 2 D D v S CEq 19.04
2 . 100 . i i i i i i v v F n dv v F n
Eq 19.05
2 b b a 3 3 b D v v D v v Eq 19.06
a a 2 2 D D C S v 312 Barbosa et al.
biomechanical data collection and the 100-m freestyle race was less than two weeks.14
Two clustering approaches to increase confidence in the sta-bility of the emergent profiles were used: (i) hierarchical cluster analysis using Ward’s linkage method with the squared Euclidean distance measure to provide guidance as to the number of clusters represented in the data; (ii) k-means (nonhierarchical) cluster analysis. Standardized z scores (ie, normalization process allowing the comparison of datasets with different units and/or magnitudes) of the selected variables were used in the clustering analysis. To identify the variables with the highest influence in each cluster, a cluster’s ANOVA and discriminant analysis (stepwise method) tests were computed (P < .05). MANOVA using cluster group as the independent variable and swimmers’ characteristics (ie, gender and swim performance) were also computed (P < .05).
Results
Coefficient of determination (R2) was used to test several cluster
solutions (from 1 to 9; ie, 1 < k < 9). The three-cluster solution (k = 3) was the one with the highest power with lower gains after the 4th cluster (R2 = .709) (Figure 1). Descriptive statistics revealed
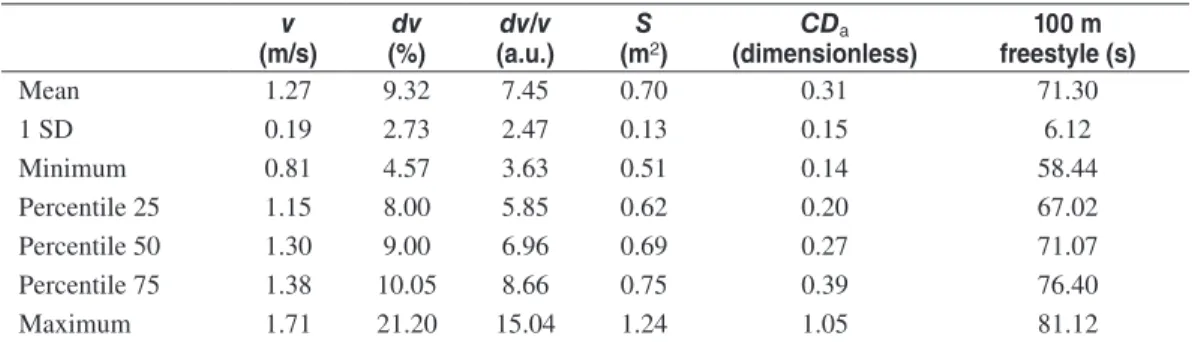
a moderate-large variation of all selected variables (Table 1). ANOVA statistics revealed significant variations in all tested variables (Table 2). Cluster 1 was characterized by high values of speed fluctuation (ie, dv and dv/v). Cluster 2 was characterized by high value of anthropometrics (ie, S). Cluster 3 was associ-ated with the high hydrodynamic profile (ie, CDa). The variable
that seems to discriminate the clusters better was the dv/v (F = 53.680; P < .001), followed by dv (F = 28.506; P < .001), CDa
(F = 21.025; P < .001), S (F = 6.297; P < .01), and v (F = 5.375; P = .01). MANOVA showed a nonsignificant multivariate effect of gender and swimming performance in cluster groups (ΛWilks’s
= 0.808; ΛPillai’s = 0.194; P = .08).
The stepwise discriminant analysis extracted two functions including the dv/v, CDa and S (Figure 2). Function 1 is mainly
defined by dv/v and CDa explaining 74.3% of variance (Λ= 0.179;
χ2(6) = 104.976; P < .001); function 2 is mainly defined by C
Da
and S explaining 25.7% of variance (Λ = 0.569; χ2(2) = 34.359;
P < .001):
Function 1 = 0.170⋅S – 0.750⋅CDa + 1.487⋅dv/v – 0.009 (7)
Function 2 = –0.684⋅S + 0.920⋅CDa + 0.591⋅dv/v + 0.025 (8)
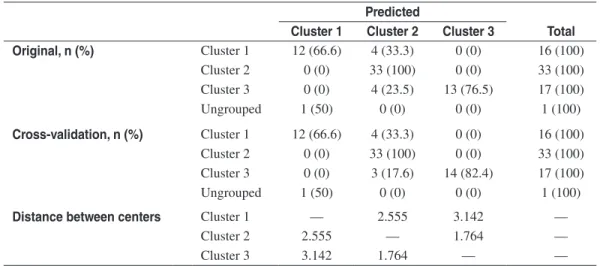
Regarding data validation, 89.2% of the original group were correctly classified (Table 3), with classification functions as fol-lows: Cluster 1, kinematics = 44.198⋅S – 2.852⋅CDa + 4.604⋅dv/v – 41.280 (9) Cluster 2, anthropometrics = 49.082⋅S – 0.305⋅CDa + 2.752⋅dv/v – 28.175 (10) Cluster 3, hydrodynamics = 37.788⋅S + 17.963⋅CDa + 2.195⋅dv/v – 24.175 (11)
Discussion
The aim of this research was to develop a classification system for young talented swimmers based on kinematical, hydrodynamic, and anthropometrical characteristics. Three clusters, based on dv and dv/v (cluster 1, labeled “kinematics”), S (cluster 2, labeled “anthropometrics”), and CDa (cluster 3, labeled “hydrodynamics”),
were obtained. The stepwise discriminant analysis extracted two functions including the dv/v, CDa, and S, explaining 74.3% and
25.7% of the variance, respectively.
Traditionally, talent identification research is based on the identification of variables that might be related to the performance during childhood and adulthood. Several authors conducted explor-atory studies to identify some of those variables with potential to predict the swimming performance.15–17 This exploratory research
involves, most of the times, the design of cohort or correlational studies. Researchers applied bivariate tests to know the empirical relationship between two variables (one of these is the performance). Kinematics (as happens for cluster 1),18,19 anthropometrics (cluster
2),20 and hydrodynamics (cluster 3)21 are highly related with young
swimmers’ performance. However, swimming performance is a multifactorial phenomenon where several variables play a role. Hence, one of the main limitations in this exploratory research is that it does not consider the interaction and/or the relationships between all the variables involved.
To solve this limitation, deterministic models were developed, with structural equation modeling, to explain the relationships between performance and determinant variables in young swim-mers. Structural equation modeling is a mathematical procedure for testing and estimating causal relationships of several variables.
Table 1 Descriptive statistics of the selected variables
v
(m/s) (%)dv (a.u.)dv/v (mS2) (dimensionless)CDa freestyle (s)100 m
Mean 1.27 9.32 7.45 0.70 0.31 71.30 1 SD 0.19 2.73 2.47 0.13 0.15 6.12 Minimum 0.81 4.57 3.63 0.51 0.14 58.44 Percentile 25 1.15 8.00 5.85 0.62 0.20 67.02 Percentile 50 1.30 9.00 6.96 0.69 0.27 71.07 Percentile 75 1.38 10.05 8.66 0.75 0.39 76.40 Maximum 1.71 21.20 15.04 1.24 1.05 81.12
Note. v, swimming velocity; dv, speed fluctuation; dv/v, speed fluctuation normalized to swimming velocity; S, trunk transverse surface area; CDa, active drag coefficient.
313
Figur
e 1
— Dendogram of the cluster analysis.
Tab le 2 Descr iptiv e and summar y ANO VA statistics b y c lust er ing and c lust er cent er (C) Clust er 1 (n = 1 6) Clust er 2 (n = 33) Clust er 3 (n = 1 7) M ± SD z C M ± SD z C M ± SD z C F v 1.14 ± 0.16 –0.66 –0.66458 1.32 ± 0.19 0.24 0.24149 1.31 ± 0.16 0.18 0.18697 5.375 dv 12.58 ± 3.38 1.20 1.20276 8.58 ± 1.36 –0.27 –0.27066 7.75 ± 1.52 –0.57 –0.57799 28.506 dv/v 10.99 ± 2.24 1.40 1.40908 6.60 ± 1.32 –0.34 –0.34220 5.94 ± 1.21 –0.60 –0.60843 53.680 S 0.67 ± 0.12 –0.28 –0.28150 0.75 ± 0.14 0.39 0.39648 0.63 ± 0.07 –0.50 –0.50469 6.267 CD a 0.25 ± 0.09 –0.32 –0.32034 0.24 ± 0.07 –0.41 –0.41784 0.47 ± 0.20 1.04 1.04169 21.025 Note . v , swimming v elocity; dv , speed fluctuation; dv/v
, speed fluctuation normalized to swimming v
elocity; S, trunk transv erse surf ace area; CD a , acti ve drag coefficient.
314 Barbosa et al.
It is known that performance depends on energetics, kinematics, and efficiency;14 while kinematics is influenced by anthropometrics
and kinetics.5 So, the interaction among these domains and how it
determines the performance should be considered.
Nevertheless, besides exploratory and causality designs, a further step is given in this research as it is now possible to classify new swimmers engaged in talent identification programs in a very straightforward way. Based on the discriminant analysis, it is possible to classify other swimmers in a given cluster solution according to the functions or the equations extracted. After collecting dv/v, CDa,
and S data, new swimmers can be classified through the scores of the discriminant functions (equations 7 and 8) or the classification
functions (Equations 9–11). The scores of Equations 7 and 8 are used as coordinates in a Cartesian system (x, y; function 1; function 2) to define the position of the new swimmer in the territorial map (Figure 2). As it presents the region frontier and the centroid of the cluster solutions, it becomes visually possible to inspect to which cluster the new athlete is allocated. Another analytical procedure to classify swimmers is to use Equations 9 to 11. From the three equations, the one with the highest score refers to the cluster where the new swimmer should be allocated to and “labeled.” In this sense, research and talent identification test batteries with young swimmers should consider a few variables from each one of these three domains and the application of the procedure described in this article.
Table 3 Cross-tabulation of group membership and distance between centers
Predicted
Cluster 1 Cluster 2 Cluster 3 Total
Original, n (%) Cluster 1 12 (66.6) 4 (33.3) 0 (0) 16 (100) Cluster 2 0 (0) 33 (100) 0 (0) 33 (100) Cluster 3 0 (0) 4 (23.5) 13 (76.5) 17 (100) Ungrouped 1 (50) 0 (0) 0 (0) 1 (100) Cross-validation, n (%) Cluster 1 12 (66.6) 4 (33.3) 0 (0) 16 (100) Cluster 2 0 (0) 33 (100) 0 (0) 33 (100) Cluster 3 0 (0) 3 (17.6) 14 (82.4) 17 (100) Ungrouped 1 (50) 0 (0) 0 (0) 1 (100)
Distance between centers Cluster 1 — 2.555 3.142 —
Cluster 2 2.555 — 1.764 —
Cluster 3 3.142 1.764 — —
Figure 2 — Territorial map of the two canonical discriminant functions.
Classification of subjects happens on a regular basis in other scientific fields, such as in health sciences to classify patients with a given disease, syndrome, or condition.22 As in those fields,
classification is useful so that: (i) practitioners would no longer need to produce a detailed explanation of the main outcomes (in this case, the performance and its determinant factors) but would rather classify it more broadly as being one of a few types; (ii) it would enable design training (ie, intervention) programs accord-ing to each category; (iii) it would make communication between practitioners quicker and easier. The three cluster solutions obtained (ie, cluster 1—kinematics, cluster 2—anthropometrics, and cluster 3—hydrodynamics) seem to be (i) easily identifiable in the field by practitioners; (ii) meaningful in terms of classification/diagno-sis for coaches and sports analysts as well as; (iii) helpful in the design of more individualized training (ie, intervention) programs. For instance, a given swimmer is classified as being part of cluster 3 (hydrodynamics) after running the tests and the classification system. This means that his profile is mainly determined by a high CDa. So, coaches could design an intervention program for
him focused on technique drills, feedback with specific visual and kinesthetic cues with the goal to improve such trait.
However, some limitations should be observed: (i) overall performance depends on other domains not considered here (eg, genetics, strength and conditioning, physiology). It is well accepted that young swimmers training should have main focus on their coordination/technical enhancement and less on the energetic/physi-ological workout; (ii) the classification procedure reported here is only suitable for talent identification of young swimmers. Some care should be exercised when applying this model to adolescent and adult/elite swimmers; (iii) others have proposed accurate but more complex and time-consuming procedures for talent identification.23
It can be concluded that kinematics (cluster 1), anthropometrics (cluster 2), and hydrodynamics (cluster 3) are determinant to clas-sify and characterize young talented swimmers. With this technical note, we were able to report a quick, straightforward, affordable, and practical procedure for young swimmers’ assessment and classification.
References
1. Phillips E, Davids K, Renshaw I, Portus M. Expert performance in sport and the dynamics of talent development. Sports Med. 2010;40:271–283. PubMeddoi:10.2165/11319430-000000000-00000
2. Glazier PS, Wheat JS, Pease DL, Bartlett RM. Dynamic systems theory and the functional role of movement variability. In: Davids K, Bennett S, Newell K, eds. Movement system variability. Champaign, Illinois: Human Kinetics Publishers; 2006:49–72.
3. Bartlett R, Wheat J, Robins M. Is movement variability important for sports biomechanists? Sports Biomech. 2007;6:224–243. PubMed doi:10.1080/14763140701322994
4. Barbosa TM, Bragada JA, Reis VM, Marinho DA, Carvalho C, Silva AJ. Energetics and biomechanics as determining factors of swim-ming performance: Updating the state of the art. J Sci Med Sport. 2010;13:262–269. PubMeddoi:10.1016/j.jsams.2009.01.003
5. Morais JE, Jesus S, Lopes V, et al. Linking selected kinematical, anthropometrics and hydrodynamic variables to young swimmers performance. Pediatr Exerc Sci. 2012;24:649–664. PubMed
6. Figueiredo P, Barbosa TM, Vilas-Boas JP, Fernandes RJ. Energy cost and body centre of mass’ 3D intracycle velocity variation in swim-ming. Eur J Appl Physiol. 2012;112:3319–3326. PubMeddoi:10.1007/ s00421-011-2284-6
7. Vilas-Boas JP, Costa L, Fernandes RJ, et al. Determination of the drag coefficient during the first and second gliding positions of the breaststroke underwater stroke. J Appl Biomech. 2010;26:324–331.
PubMed
8. Edelman GM, Gally JA. Degeneracy and complexity in biological systems. Proc Natl Acad Sci USA. 2001;98:13763–13768. PubMed doi:10.1073/pnas.231499798
9. Bideault G, Herault R, Seifert L. Data modelling reveals inter-individual variability of front crawl swimming. J Sci Med Sport. 2013;16:281–285. PubMeddoi:10.1016/j.jsams.2012.08.001
10. Barbosa TM, Morouço P, Jesus S, et al. The interaction between intra-cyclic variation of the velocity and mean swimming velocity in young competitive swimmers. Int J Sports Med. 2012;34:123–130. PubMed doi:10.1055/s-0032-1312582
11. Fernandes RJ, Ribeiro J, Figueiredo P, Seifert L, Vilas-Boas JP. Kine-matics of the Hip and Body Center of Mass in Front Crawl. J Hum Kinet. 2012;33:15–23. PubMeddoi:10.2478/v10078-012-0040-6
12. Kolmogorov S, Duplischeva O. Active drag, useful mechanical power output and hydrodynamic force coefficient in different swimming strokes at maximal velocity. J Biomech. 1992;25:311–318. PubMed doi:10.1016/0021-9290(92)90028-Y
13. Morais JE, Costa MJ, Mejias EJ, Marinho DA, Silva AJ, Barbosa TM. Morphometric study for estimation and validation of trunk transverse surface area to assess human drag force on water. J Hum Kinet. 2011;28:5–13. PubMeddoi:10.2478/v10078-011-0017-x
14. Barbosa TM, Costa MJ, Marinho DA, Coelho J, Moreira M, Silva AJ. Modeling the links between age-group swimming performance, ener-getic and biomechanic profiles. Pediatr Exerc Sci. 2010;22:379–391.
PubMed
15. Garrido ND, Marinho DA, Reis VM, et al. Does combined dry land and aerobic training inhibit performance of young competitive swim-mers? J Sports Sci Med. 2010;9:300–310. PubMed
16. Ackland TR, Bloomfield J, Elliott BC, Blanksby BA. Talent identifica-tion for tennis and swimming. J Sports Sci. 1990;8:161–162. 17. Poppleton WL, Salmoni AW. Talent identification in swimming. J
Hum Mov Stud. 1991;20:85–100.
18. Vitor FM, Böhme MT. Performance of young male swimmers in the 100 meters front crawl. Pediatr Exerc Sci. 2010;22:278–287. PubMed
19. Silva A, Figueiredo P, Soares S, Seifert L, Vilas-Boas JP, Fernandes RJ. Front crawl technical characterization of 11- to 13-year-old swim-mers. Pediatr Exerc Sci. 2012;24:409–419. PubMed
20. Lätt E, Jürimäe J, Mäestu J, et al. Physiological, biomechanical and anthropometrical predictors of sprint swimming performance in adolescent swimmers. J Sports Sci Med. 2010;9:398–404. PubMed
21. Kjendlie PL, Stallman RK. Drag characteristics of competitive swim-ming children and adults. J Appl Biomech. 2008;24:35–42. PubMed
22. Toro B, Nester CJ, Farren PC. Cluster analysis for the extraction of sagittal gait patterns in children with cerebral palsy. Gait Posture. 2007;25:157–165. PubMeddoi:10.1016/j.gaitpost.2006.02.004
23. Pfeiffer M, Hohmann A. Application of neural networks in training science. Hum Mov Sci. 2012;31:344–359. PubMeddoi:10.1016/j. humov.2010.11.004