International State of the
Art Report
Work Package 2
December 2014
International State of the Art
Report
Authors:
Luís Capucha
Alexandre Calado
Pedro Estêvão
In collaboration with:
Markus Promberger
Jennifer Dagg
Lars Meier
Jane Gray
Tarik Sengül
Kazimiera Wódz
Attila Aytekin
Krystyna Faliszek
Hulya Dagdeviran
Krzysztof Łęcki
Matthew Donoghue
Witold Mandrysz
Ursula Huws
Barbara Słania
Monica Tennberg
Paweł Ćwikła
Terhi Vuojala-Magga
Monika Gnieciak
Joonas Vola
María Arnal
Helen Kambouri
Carlos de Castro
Theodosia Marinoudi
Araceli Serrano
Aggeliki Yfanti
Francisco José Tovar
Table of Contents
Introduction ... 2
1. Economic and Social Impacts of the 2008 global financial crisis in Europe ... 7
1.1. Economic crisis and trends of economic growth... 7
1.2. Employment and labour conditions ... 11
1.3. Income and inequality ... 23
1.4. Migration flows ... 28
1.5. Poverty ... 34
1.6. Conclusion ... 42
2. The Welfare State and the Crisis ... 44
2.1. Main impacts of the crisis in economic and social policies ... 44
2.2. Integration of resilience concerns in policy making and institutional intervention ... 58
2.3. Conclusion ... 62
3. Social Economy ... 64
3.1. Impacts of the crisis on relations between the third sector and public institutions ... 65
3.2. Impacts of the crisis on third sector intervention Institutions ... 68
3.3. Conclusion ... 73
4. The Concepts of Poverty ... 74
4.1. Revisiting the concepts of poverty ... 74
4.1.1. The culturalist tradition ... 75
4.1.2. The socio-economic tradition ... 78
4.1.3. A renovated debate around basic needs and feelings of deprivation ... 81
4.2. Social Exclusion ... 86
4.2.2. Exclusion as rupture of the social contract ... 91
4.3. The idea of ways of life and the development of research on poverty and social exclusion ... 94
4.3.1. To gain in the two fields: the idea of ways of life ... 97
4.3.2. Factors, categories and lifstyles of poverty ... 100
5. Building up a sociological definition of social resilience ... 103
5.1. From a “heroic” to a critical version of resilience ... 103
5.2. Research findings on household resilience in Europe ... 110
5.2.1. Protecting / stabilizing household income ... 112
5.2.2. Cutting / management of the cost of family life ... 116
6. Conclusions ... 121
Economic and social crisis ... 121
Welfare state retrenchment and resilience ... 126
Social economy ... 129
Household resilience ... 130
Table Index
Table 1 – GDP Growth rate in the RESCuE countries sample (%) ... 9
Table 2 – Unemployment rate in the RESCuE sample countries (yearly average, %) .... 13
Table 3 – Long-term unemployment rate in the RESCuE sample countries (yearly average, %) ... 14
Table 4 – Unemployment rate for under 25 year-olds in the RESCuE sample countries (yearly average, %) ... 15
Table 5 – Part-time employment as a percentage of the total employment in the RESCuE Sample ... 19
Table 6 – Self-employment as a percentage of total employment ... 20
Table 7 - Median Equivalised Net Income in the RESCuE countries per year (in Euros) 24 Table 8 – S80/S20 income quintile ratio in the RESCuE sample. ... 26
Table 9 – Demographic balance in the RESCuE countries, in thousands ... 29
Table 10 - Total emigration from the RESCuE countries, in thousands (data not available for Turkey) ... 31
Table 11 – Total immigration to the RESCuE countries, in thousands ... 32
Table 12- Material Deprivation – Economic Strains and Durables Dimension (4 or more items) ... 36
Table 13- At-risk-of-poverty rate before social transfers (poverty threshold: 60% of median income) ... 37
Table 14- At-risk-of-poverty rate after social transfers (threshold: 60% of median income) ... 38
Table 15 – At-risk-of-poverty rate after social transfers by age group: values in 2012 and difference in relation to 2007 (threshold: 60% of median income ... 40
Table 16 - At-risk-of-poverty rate after social transfers by type of household: values in 2012 and difference in relation to 2007 (threshold: 60% of median income) ... 41
Table 17 - Social expenditure in Euros per inhabitant (2005 constant prices) ... 51
Table 18 – Growth in Total Annual Public Expenditure in Education ... 52
1
Table 20 - Expenditure in Health per inhabitant by the General Government in some of
the RESCuE countries (in Euros, current prices) ... 54
Table 21 – Taxes over Labour as a % of total taxation ... 55
Table 22 – Taxes over Capital as % of total Taxation ... 56
Table 23 - VAT as a % of total taxation ... 57
Table 24 – Final Consumption Expenditure of Households in the RESCuE countries (2007 = 100) ... 58
2
Introduction
The present report is part of the RESCuE project, an acronym that stands for Patterns of Resilience during Socioeconomic Crisis among Households. This project is coordinated by Professor Markus Promberger, from the Institute for Employment Research (IAB), in Germany. It was awarded by the 7th Framework Programme, and funded by the Community Research and Development Information Service (CORDIS).
The RESCuE project involves universities and research centres from 9 different European countries – Portugal, Spain, United Kingdom, Ireland, Germany, Poland, Finland, Greece, Turkey – and, in the context of the ongoing economic and financial crisis in Europe, aims to identify and understand the coping and adjusting mechanisms and strategies of different households at risk, thus learn from the resilience of European citizens, in order to find new sustainable ways of reducing poverty risks and inform and support policy-making.
Since 2008, Europe has experienced turbulent times with an ongoing economic and financial crisis. The counteractive sectorial and macroeconomic interventions pursued since then (e. g. government bailouts of banks and monetary expansion) have transformed the financial crisis into a public debt crisis. This has socialized the debt of distressed financial institutions and privatized the gains associated with these policies (Stiglitz, 2012). The policy prescriptions to solve the sovereign debt crisis in Europe have largely been based on austerity measures, in some countries involving severe cuts in public employment and government spending, including social policy budgets. The deep economic recession and rising unemployment are now threatening the progress towards an enhanced political and economic integration of the European Union and its neighbours and partners.
Affording support for any population that is exposed to socioeconomic risk is a distinctive characteristic of European political ethics. This support is usually provided through social policy and economic development instruments. However, governments and welfare state institutions are not the only mechanisms used to provide social response against the impact of the socioeconomic crisis. Citizens should not be treated
3
as passive social agents who are defenceless when faced with unemployment, poverty and social exclusion.
As a matter of fact, some vulnerable citizens and households can be observed to be developing resilience by performing social, economic and cultural practices that effectively protect them from greater suffering and provide sustainable patterns of coping and adaption. These resilience practices can consist of identity patterns, knowledge, family or community relations, other cultural and social as well as economic resources and conduct, whether formal or informal, tacit or explicit. In turn, welfare states, markets and economic policies at both macro and meso levels form the environment of these resilience patterns, which may be enabling, restrictive, neutral or even practically absent.
This household-level resilience is the main interest of RESCuE project. Socioeconomic resilience of households continues to remain almost a blank spot of scientific investigation, but the results of such research may be crucial for welfare states to develop innovative approaches towards maintaining the inclusive principles of the European social model. Thus, the crisis can be seen as an opportunity for the institutions of welfare states to learn from the resilience of their citizens and find new ways of reducing socioeconomic risks by creating a positive political framework for the development of these practices, and providing assistance to those that do not show the capacity to overcome a difficult situation by their own means.
Therefore, the main objective of RESCuE will be to identify and understand the specific resilience practices of different households at risk and analyze the conditions they require within and around themselves and the institutions, markets and regulations they interact with. This research will be carried out with a comparative focus, involving countries with different welfare state models, rural and urban areas, different types of households and gender, ethnicity and class intersectionalities. The investigation will also cover the respective households’ internal and external resources and relations, such as family property, knowledge and practices, intra-family relations, their local embedding in communities, neighbourhoods and networks as well as their interactions with governmental and non-governmental welfare institutions.
4
The present international report represents the final product of Work Package 2. It consists of the presentation of the state of the art concerning both the socioeconomic situation in Europe following the crisis and the development of the research on resilience within social science.
The main objective of this report is to discuss and develop the concept of resilience, with the goal of providing an innovative and operational approach of this concept within the field of social science. The ultimate aim is to provide theoretical framework capable of encompassing the issues, questions and goals established for this project. There are five specific objectives defined for this report, which provide the theoretical perspective and methodological structure for the data collection and supplementary analysis, namely:
1. Gain an overview of the effects of the crisis on household living conditions; 2. Gain an overview of the effects of the crisis on the welfare state and NGO
interventions;
3. Provide a general review of the state of the art and critically assess existing research on resilient cultural, social and economic practices, including identification of gaps in current knowledge;
4. Gain an understanding of the uses of the resilience concept in public and political discourses;
5. Develop a concept of resilience to guide the RESCuE ensuing fieldwork and data analysis.
The methodological strategy followed for the construction of this report was based on two main sources of information: (1) a scientific literature review and (2) the national reports produced by each of the members of the RESCUE sample teams. The literature review guided the development of the conceptual model of the research, namely the construction of an operational concept of resilience, able to guide the fieldwork and analysis of the data collected from households and institutional actors. In turn, the national reports complemented the literature review work. On the one hand, these reports provided national empirical data on the impact of the crisis on the countries sampled, as well as the coping and adaptation strategies developed by families and the policy responses implemented by the Welfare State and the Third Sector. On the other
5
hand, information was collected about the scientific research in each of these countries in the areas of poverty and social exclusion, and socio-economic resilience of families and communities.
National situations in their inner heterogeneity were compared through extensive data analysis, including national poverty reports, scientific literature reviewing, and public and policy discourses about each topic. In effect, the incorporation of these reports benefited from diversification in the appropriation of the general guidelines for the production of each report by each team, with different highlights and angles according to the specificity of each country. This multiplicity resulted in greater richness of the contributions, allowing the identification and clarification of contrasts and the exploration of new angles to approach and analyze the problems and challenges of the research.
Thus, the International Report is structured around five main topics, which will be described in the next paragraphs and related to each specific chapter:
1. Economic and social impacts of the 2008 global financial crisis in Europe; 2. Welfare state and the crisis;
3. Social economy and the crisis; 4. Concepts of Poverty
5. The concept of resilience: a new tool to understand poverty in the context of the crisis.
Chapter 1 of this report will review and describe the socioeconomic situation in the respective countries during the present crisis. Attention will be paid to economic performance since the turn of the century, focusing on the years that followed the 2007-8 global financial crisis. The core of the chapter will be a discussion of the consequences of this crisis in the RESCuE countries in four domains: unemployment and working conditions; income; international migrations; and poverty.
Chapters 2 and 3 will also examine ongoing changes in this political field, focusing on the changing role of the welfare state and social economy institutions. In particular, they will consider the impacts of the crisis on the available resources and on the political
6
orientation of social action. An account will also be given of the introduction of resilience practices and/or discourses on the welfare state and on social economy institutions, mainly regarding their priorities for action and methodology for social intervention. Chapters 4 and 5 will be dedicated to the theoretical grounding of the concept of social resilience. Chapter 4 will provide a comprehensive overview of the literature and scientific debate on poverty, whereas chapter 5 will make use of that discussion to put forward a concept of resilience anchored in the concept of “poverty ways of life”. We will trace the theoretical developments of the concept of resilience, particularly in the social sciences, in order to establish a theoretical perspective and model for the investigation. The main findings of scientific research in the countries of the study sample will also be surveyed with respect to the resilience of families and their coping and adaptation practices in view of the socioeconomic crisis.
Finally, the chapter 6 will present the conclusions of the report, summarizing the main conclusions drawn from the analysis of the collected information, with reference to the objectives set for the report.
Moreover, several additional aspects of great relevance to the RESCuE investigation will be tackled in the report. These concern spatial and community issues in their interrelation with vulnerable and resilient households; the lessons to be learned for social policy, the longitudinal (or process-shaped) nature of resilience; the gender dimension and other intersecting dimensions of social inequality like migration and ethnicity.
Finally, this report will also support the subsequent fieldwork of Work Package 3, by fine-tuning hypotheses and research questions and placing them alongside scientific, socioeconomic, cultural and political developments. It will thus feed the fieldwork by formulating clear general research questions that can be operationalised in sampling, interview guidelines, observation checklists and other research instruments.
7
1. Economic and Social Impacts of the 2008 global financial
crisis in Europe
The idea of crisis is widespread in common discourse. But what does crisis mean in the RESCuE project? And to what extent has it affected families in the RESCuE countries? These are the basic questions that this chapter will seek to answer. To do so, we will start with a brief excursion on economic indicators, emphasizing the 2007-8 global financial crisis and the form of its shockwaves in Europe, taking care to look not only at general trends but also into country-specific manifestations. But economic indicators alone do not capture the vastness of social and demographic consequences stemming from the crisis. Given the focus of RESCuE on resilience, we will give centre stage to work – as both a fundamental source of economic resources for families and as a crucial element in the construction of social identity and life projects - and movement in geographic space – as one of the strategies for coping with the crisis that has visible translation at a statistical level. Thus, identify and discuss some of the transformations in the labour world and international migration patterns that were either triggered or deepened by the crisis. With these changes in mind we will then proceed to trace of the evolution of poverty since 2007.
1.1. Economic crisis and trends of economic growth
The shockwaves of the 2007-8 global financial crash and the subsequent credit crunch hit Europe quickly. Yet not all countries suffered its effects to the same measure or over the same time frame. The outer periphery of the European Union (EU) – Ireland, Portugal, Spain and Greece - would bear the harshest and longest of the recessions that followed the crisis, ones from which they are yet to recover. A second group of countries including traditional industrial powerhouses such as Germany and the UK, as well as Finland and also emerging economies such as Poland and Turkey initially felt the effects of the global crisis but recovered much more quickly – to the extent that, in the two latter countries, the crisis not even seem to be anything other than a short-term downturn, at least when compared to other moments such as the recession of 2002-3.
8
Yet, they too failed to reach pre-crisis levels of GDP growth consistently and appear to be showing a new trend of slow and fragile economic growth, while displaying increased vulnerability to external shocks.
In large part due to its close economic ties with the United States, where the financial crisis had started, Ireland would be officially declared in recession in August 2008 - the first EU country to do so. By the end of that year, Irish GDP had fallen by 2.2% and would fall a further 6.4% in 2009 and 1.1% in 2010. By then, the drying up of credit in financial markets coupled with the bursting of a real estate bubble had led to a major crisis in the Irish banking system. The Irish Government opted to bail out some of the largest Irish banks and was thus forced to negotiate a Financial Rescue Package with the International Monetary Fund (IMF) and European Central Bank (ECB) in November 2010 with the imposition of an austerity plan. Despite this, not only did economic growth fail to reach anything resembling pre-crisis levels but, by 2013, Ireland was back in recession, with a 0.3% contraction of GDP.
Greece is another country on the frontline of the financial and economic crisis – and arguably the one that has suffered the most from it. As soon as 2008, Greek GDP had declined by 0.2% and would continue to drop sharply in 2009, contracting by a further 3.1%. In the midst of the fallout of successive revisions of public deficit figures and sharp rises in public debt interests, the Greek Government was forced to ask for an IMF-ECB loan in April 2010, which came attached with harsh austerity measures. A second loan coupled with partial debt restructuring was made in February 2012. Yet, the implementation of a series of harsh austerity packages, while incurring in heavy social costs and fostering significant political turmoil - which included, as will be explored further below, a deep transformation of the Greek political party system – did not prevent Greece from plunging into a full-fledged economic depression whose end is yet in sight. Indeed, Greek GDP fell by 7.1% in 2011, 7.0% in 2012 and 3.9% in 2013.
Spain has also been heavily hit by the crisis. High growth rates came to a halt with the bursting of a real estate bubble and a banking crisis that bore some similarities with Ireland’s. Though not being subject to a formal external intervention as the other countries in this group, Spain nevertheless proceeded to implement successive austerity measures from 2010 onwards. Yet, stagnation and recession has so far been
9
the only visible result, with Spanish GDP showing negative growth rates for every year after 2008, with the single exception of a negligible 0.1% positive growth rate in 2011. Table 1 – GDP Growth rate in the RESCuE countries sample (%)
2000 2001 2002 2003 2004 2005 2006 2007 2008 2009 2010 2011 2012 2013 EU28 3.9 2.0 1.3 1.5 2.6 2.2 3.4 3.2 0.4 -4.5 2.0 1.6 -0.4 0.1 Germany 3.1 1.5 0.0 -0.4 1.2 0.7 3.7 3.3 1.1 -5.1 4.0 3.3 0.7 0.4 Ireland 10.6 5.0 5.4 3.7 4.2 6.1 5.5 5.0 -2.2 -6.4 -1.1 2.2 0.2 -0.3 Greece 4.5 4.2 3.4 5.9 4.4 2.3 5.5 3.5 -0.2 -3.1 -4.9 -7.1 -7.0 -3.9 Spain 5.0 3.7 2.7 3.1 3.3 3.6 4.1 3.5 0.9 -3.8 -0.2 0.1 -1.6 -1.2 Poland 4.3 1.2 1.4 3.9 5.3 3.6 6.2 6.8 5.1 1.6 3.9 4.5 2.0 1.6 Portugal 3.9 2.0 0.8 -0.9 1.6 0.8 1.4 2.4 0.0 -2.9 1.9 -1.3 -3.2 -1.4 Finland 5.3 2.3 1.8 2.0 4.1 2.9 4.4 5.3 0.3 -8.5 3.4 2.8 -1.0 -1.4 UK 4.4 2.2 2.3 3.9 3.2 3.2 2.8 3.4 -0.8 -5.2 1.7 1.1 0.3 1.7 Turkey 6.8 -5.7 6.2 5.3 9.4 8.4 6.9 4.7 0.7 -4.8 9.0 8.8* 2.1* 4.0*
Source: Eurostat and World Bank (for Turkey 2011-2013)
Portugal also became a major casualty of the crisis. Unlike Ireland, Spain or Greece, Portugal had experienced slow growth rates for most of the 2000s. This owed much to loss of competitiveness of the Portuguese economy, still struggling from the impacts of the EU opening to international markets in mid-to-low added value production and the lack of the option of currency devaluation following the adoption of the Euro. Yet an initial set of fiscal expansionist policies initially averted the recession and even made for signs of quick recovery: after a drop of 2.3% in 2009, the worst seemed to have passed by 2010, with an actual growth of 1.9% being recorded. However, the sudden shift in EU policies from fiscal expansionism to austerity in mid-2010 and consequent rising debt interest in financial markets forced the Portuguese Government to ask for a financial rescue package from the International Monetary Fund and the European Central Bank in May 2011. This package implied the signing of a Memorandum of Understanding that foresaw the implementation of a wide range of austerity measures. These measures – and particularly their impacts on aggregate demand - halted the Portuguese economic
10
recovery in its tracks, with Portuguese GDP proceeding to fall continuously from 2010 onwards: 1.3% in 2011, 3.2% in 2012 and 1.4% in 2013.
Of the other countries in the RESCuE sample, Finland is perhaps the one in worse economic situation. The immediate impact of the crisis was very hard, with Finnish GDP declining by 8.5% in 2009 alone. Quick recovery ensued, with GDP growing by 3.4% in 2010 and 2.8% in 2011. However, this recovery seems to have been short-lived. With an economy struggling with loss of competitiveness and hit by considerable industrial delocalization phenomena, the Finnish economy has since entered in recession, with GDP reductions of 1.0% in 2012 and 1.2% in the following year.
The UK is not faring much better. Like Ireland, it became one of the first countries in the sample to enter recession after the global crisis - greatly due to the importance of the financial sector in the British economy. British GDP fell by -0.8% immediately in 2008 had proceeded to fall by a further 5.9% in 2009. Despite returning to positive rates from 2010 onwards, it has also showed a pattern of much slower growth than in the pre-crisis years: 1.7% in 2010, 1.1% in 2011, 0.3% in 2012 and 1.7% again in 2013.
Germany presents a somewhat different picture. After falling by 5.1% in 2009, German GDP not only recovered quickly but recorded the highest grow rates of the decade in the two following years – 4.0% in 2010 and 3.3% in 2011 - which suggested at the time that Germany could be seen as a sort of a “winner” of the crisis. A possible explanation for this evolution rests on the competitiveness gains of the German economy at the expense of peripheral and weaker economies. These gains owed much both to the strength of a German exporting sector no longer facing the risk of currency devaluation by Eurozone trading partners and also to the wage compression policies set in place during Chancellor Gerhard Schroeder’s Government in the early 2000s. Yet this recovery was short-lived. By 2012, GDP growth fell considerably by 0.7% and declined even further to 0.3% in 2013, all signs of economic stagnation.
Finally, Turkey and Poland are the countries that more strongly contrast with the general trend of the RESCuE countries regarding economic growth. Turkish GDP did fall by -4.8% in 2009 but, by 2010 and 2011 GDP was growing at 9.0% and 8.8% respectively – by far the largest growth levels in the entire sample. Even if at a somewhat more moderate
11
pace, Turkish GDP continued to grow at the strong rates of 2.1% in 2012 and 4.0% in 2013. This made the notion of economic crisis fall out of the radar in public debates in Turkey, to the point that, when called upon, it will most likely refer to the early 2000s crisis and not the late 2000s one.
In turn, Poland is the country in the RESCuE sample that was hit less severely by the 2007-8 global financial crisis. Despite strong speculative pressure on the zloty and high levels of public debt, Polish GDP continued to grow even in 2009, albeit at a slower pace (1.9%), making Poland the only country not to have technically experienced recession in that period. By 2010, Polish GDP growth was back at 3.9% and would even peak at 4.5% in 2011. Although these rates have fallen to 2.0% and 1.6%, they are still well above the EU average, which makes the term “downturn”, rather than “crisis” drawn upon in domestic debates on the economic situation - unlike most of the other RESCuE sample countries.
1.2. Employment and labour conditions
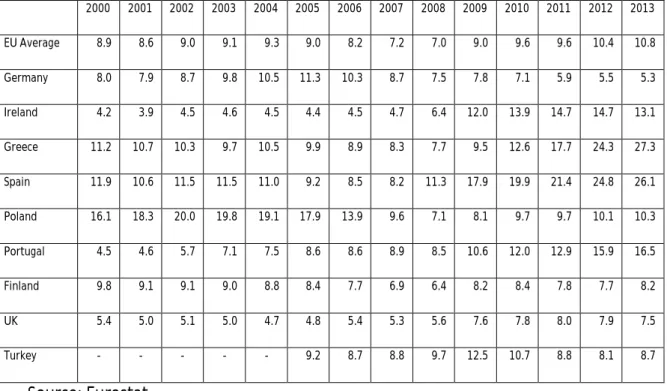
The average unemployment rate in the EU has been on the rise since 2008, coinciding with the beginning of the economic crisis. In 2008, the EU average rate stood at 7.0%, but by 2013, had peaked at 10.8% - the highest since 2000. An analogous trend is detected regarding long-term unemployment – that is, the proportion of the active population that is unemployed for more than 12 months – which, from a minimum of 2.6% in 2008, was reaching 5.1% in 2013.
Yet this general average hides distinct trends within the RESCuE sample. Again, the peripheral countries of the Eurozone – Greece, Ireland, Portugal and Spain - saw the most dramatic increases in total and long-term unemployment rates in the wake of the crisis. But even in countries less penalized by it, such as Poland or Turkey, another trend seems to be taking place: that of jobless growth, as economic recovery fails to generate an equivalent increase in employment. With Finland mired in relatively high levels of unemployment that hark back to the deep Scandinavian recession of the mid-1990s, only Germany is left showing a significant declining trend in this regard since the beginning of the crisis.
12
Unemployment in the Eurozone periphery peaked after 2008. Between 2007 and 2013, unemployment rates almost doubled in Portugal, tripled in Spain and Ireland and nearly quadrupled in Greece.
In Ireland, 14.7% of the active population was unemployed in 2012, a figure that would fall to 13.1% in 2013 – still an extremely high number, if we consider that the Irish unemployment rate hovered around 4.5% between 2000 and 2007. Likewise, long-term unemployment, which was residual in the wake of the crisis - standing at 1.7% in 2007 - peaked at 9.1% in 2012. The bursting of the housing bubble in the immediate aftermath of the global credit crunch meant that workers from the construction sector – of which a majority was low-skilled and/ or migrant – were the first major casualty in this regard. As the recession went on, unemployment extended to workers in service sectors that are particularly sensitive to declines in aggregate demand, such as retail and hospitality. Furthermore, the crisis introduced a new feature in the Irish labour market: youth unemployment on a massive scale. In 2007, at the eve of the crisis, the unemployment rate for those less than 25 years old in Ireland stood at 9.1%, far below the EU average of 15.7%. By 2012, this proportion had grown to 30.1%, a full 7.4 p.p. above the EU average and the slight drop in 2013 to 26.8% does not suffice to alter this general picture.
Spain too experienced the effects of a massive housing bubble whose collapse greatly affected the construction sector – one of the former mainstays of the Spanish labour market – and later spread to other aggregate demand-sensitive sectors such as tourism. Yet, unlike Ireland, high unemployment had long been a structural trait of the Spanish economy, although it was on the decline in the years leading up to the crisis. In 2000, Spain featured an unemployment rate of 11.9% - the second highest unemployment rate of our sample at the time – which would slowly fall until reaching a minimum of 8.2% just before the triggering of the global financial crisis. However, the years following the global financial crisis not only halted the decreasing trend but also saw unemployment reach new heights. From 8.2% in 2007, Spain’s unemployment rate rapidly swelled afterwards, until hitting a massive 26.1% in 2013. Long-term unemployment soon followed the same trend, increasing nearly eightfold between 2007 – when it stood at a near-residual level of 1.7% - and 2013 – when it reached 13.1%.
13
Table 2 – Unemployment rate in the RESCuE sample countries (yearly average, %)
2000 2001 2002 2003 2004 2005 2006 2007 2008 2009 2010 2011 2012 2013 EU Average 8.9 8.6 9.0 9.1 9.3 9.0 8.2 7.2 7.0 9.0 9.6 9.6 10.4 10.8 Germany 8.0 7.9 8.7 9.8 10.5 11.3 10.3 8.7 7.5 7.8 7.1 5.9 5.5 5.3 Ireland 4.2 3.9 4.5 4.6 4.5 4.4 4.5 4.7 6.4 12.0 13.9 14.7 14.7 13.1 Greece 11.2 10.7 10.3 9.7 10.5 9.9 8.9 8.3 7.7 9.5 12.6 17.7 24.3 27.3 Spain 11.9 10.6 11.5 11.5 11.0 9.2 8.5 8.2 11.3 17.9 19.9 21.4 24.8 26.1 Poland 16.1 18.3 20.0 19.8 19.1 17.9 13.9 9.6 7.1 8.1 9.7 9.7 10.1 10.3 Portugal 4.5 4.6 5.7 7.1 7.5 8.6 8.6 8.9 8.5 10.6 12.0 12.9 15.9 16.5 Finland 9.8 9.1 9.1 9.0 8.8 8.4 7.7 6.9 6.4 8.2 8.4 7.8 7.7 8.2 UK 5.4 5.0 5.1 5.0 4.7 4.8 5.4 5.3 5.6 7.6 7.8 8.0 7.9 7.5 Turkey - - - 9.2 8.7 8.8 9.7 12.5 10.7 8.8 8.1 8.7 Source: Eurostat
Youth and over 50 year-old workers have suffered in particular from the rising unemployment. Youth unemployment in Spain was already massive before the crisis, with the unemployment rate for those less than 25 year old standing at 24.5% in 2007. Yet the situation would get even worse in the following years, with the unemployment rate in this age echelon reaching an astonishing maximum of 55.5% in 2013 – meaning that more than half of the active young Spanish population were without work at the time.
But Greece is arguably the country in the sample in direst straits regarding unemployment. Like Spain, Greece started the decade with a high unemployment rate – 11.2% in 2000 – that slowly fell until reaching a minimum of 7.7% in 2008. But this trend was suddenly and emphatically reversed afterwards, in the context of the debt crisis and successive cycles of austerity measures and economic depression in which Greece plunged after 2010. Unemployment quickly soared, reaching a maximum of 27.3% in 2013 – the highest value in the entire sample.
Long-term unemployment, as usual, followed suit. Already high by EU standards at the eve of the crisis (4.1% in 2007) it rose to a massive 18.4% in 2013 – by far the highest in
14
the sample. Likewise, youth unemployment, already extremely high on the eve of the crisis when compared to the EU standards, reached staggering heights in the following years. Indeed, the unemployment rate among under 25-year-old Greeks rose from 22.1% in 2007 to a staggering 58.3% in 2013.
Table 3 – Long-term unemployment rate in the RESCuE sample countries (yearly average, %)
2000 2001 2002 2003 2004 2005 2006 2007 2008 2009 2010 2011 2012 2013 EU28 - - 4.1 4.2 4.3 4.1 3.8 3.1 2.6 3.0 3.9 4.2 4.7 5.1 Germany 4.1 3.9 4.2 4.9 5.9 6.0 5.8 4.9 4.0 3.5 3.4 2.8 2.5 2.4 Ireland 1.6 1.3 1.3 1.5 1.6 1.5 1.4 1.4 1.7 3.5 6.8 8.7 9.1 7.9 Greece 6.2 5.5 5.3 5.3 5.6 5.1 4.8 4.1 3.6 3.9 5.7 8.8 14.4 18.4 Spain 4.9 3.8 3.8 3.8 3.5 2.2 1.8 1.7 2.0 4.3 7.3 9.0 11.1 13.1 Poland 7.4 9.2 11 11.1 10.3 10.3 7.8 4.9 2.4 2.5 3.0 3.6 4.1 4.4 Portugal 1.9 1.7 2.0 2.5 3.3 4.1 4.3 4.2 4.0 4.7 6.3 6.2 7.7 9.3 Finland 2.8 2.5 2.3 2.3 2.1 2.2 1.9 1.6 1.2 1.4 2.0 1.7 1.6 1.7 UK 1.4 1.3 1.1 1.1 1.0 1.0 1.2 1.3 1.4 1.9 2.5 2.7 2.7 2.7 Turkey 2.7 2.3 2.3 2.8 2.8 2.1 1.8 1.9 Source: Eurostat
Of the Eurozone periphery countries, Portugal offers a somewhat different shade to this trend, as unemployment was already growing at a steady pace from the situation of near full employment of the late 1990s. Indeed, the unemployment rate had risen from a mere 4.5% in 2000 – the second lowest rate in the sample at the time – to 8.9% in 2007. This was undoubtedly due to the stagnation of the Portuguese economy in the early 2000s, whose reasons were alluded above. Nevertheless, the crisis did accelerate the trend: by 2010, the Portuguese unemployment rate was at 10.6% and would peak in 2013 at 16.1%.
Long-term unemployment followed the same trend. Nearly residual in 2001 (when it stood at 1.7%), it crept into a plateau slightly above 4.0% between 2005 and 2008. However, it quickly grew after 2008, reaching 9.3% in 2013. Likewise, youth unemployment, started the 2000s at 10.5%, before rising to a plateau around 19.5% between 2004 and 2008 and shooting upwards to 37.7% in 2012 and 2013.
15
Table 4 – Unemployment rate for under 25 year-olds in the RESCuE sample countries (yearly average, %)
2000 2001 2002 2003 2004 2005 2006 2007 2008 2009 2010 2011 2012 2013 EU28 17.7 17.4 18.0 18.7 19.1 18.9 17.6 15.7 15.8 20.1 21.1 21.4 23.0 23.4 Germany 8.7 8.4 9.9 11.6 13.8 15.6 13.8 11.9 10.6 11.2 9.9 8.6 8.1 7.9 Ireland 6.7 7.2 8.4 8.7 8.7 8.6 8.7 9.1 13.3 24.0 27.6 29.1 30.4 26.8 Greece 29.1 28.0 26.8 26.8 26.9 26.0 25.2 22.9 22.1 25.8 32.9 44.4 55.3 58.3 Spain 23.2 21.1 22.2 22.7 22.0 19.6 17.9 18.1 24.5 37.7 41.5 46.2 52.9 55.5 Poland 35.1 39.5 42.5 41.9 39.6 36.9 29.8 21.6 17.2 20.6 23.7 25.8 26.5 27.3 Portugal 10.5 11.5 14.3 17.8 18.9 19.8 20.1 20.4 20.2 24.8 27.7 30.1 37.7 37.7 Finland 21.4 19.8 21.0 21.8 20.7 20.1 18.7 16.5 16.5 21.5 21.4 20.1 19.0 19.9 UK 12.2 11.7 12.0 12.2 12.1 12.8 14.0 14.3 15.0 19.1 19.6 21.1 21.0 20.5 Turkey 17.4 16.4 17.2 18.4 22.7 19.7 16.8 15.7 17.0 Source: Eurostat
While the crisis led these four countries to a trend of growth of unemployment (albeit in different magnitudes and with some country-specific traces) related to austerity and economic recession, other countries such as Finland, the UK, Poland and Turkey are good illustrations of another facet of the European economy post-2007-8 global crisis: that of jobless growth.
Interestingly enough, a country such as Finland which is rarely paired with the above peripheral countries, actually bears some similarities with them regarding the evolution of unemployment – albeit considerably toned down both in absolute volume and range of fluctuation. Owing still to effects of the Scandinavian recession of the mid-1990s, and despite a return of economic growth in the latter years of that decade, Finnish unemployment rates began the 2000s at a somewhat higher level than the European average (standing at 9.8% in 2000 against an EU average of 8.9%). Moreover, and despite high growth rates recorded after 2003, the reduction of unemployment in Finland progressed very slowly afterwards, reaching a minimum of 6.4% in 2008. This has been partly attributed to a lag in employment policies, which have been slow to adapt to a set of changes in the Finnish economic structure – and specifically to the phenomenon of relocation of traditional industrial production to other countries. Particularly with unemployed men, focus has been on competing for dwindling industrial workplaces instead of reconversion to other sectors, such as tourism or care.
16
The crisis accentuated these problems and, by 2009, these gains had almost been wiped out, with unemployment rising to 8.2%. Yet again, even as the Finnish economy appeared to recover in 2010 and 2011, unemployment reduction was minimal and, by the latter year, it stood at 7.8%. And, as the country plunged back into recession afterwards, the unemployment rate would rise again to 8.2% by 2013.
Unlike Ireland, Portugal, Greece and Spain, however, long-term unemployment has stayed at nearly residual levels throughout the period in analysis. In fact, it has not exceeded 2.0% since 2005 and was, in 2013, the lowest in the entire sample. Likewise, youth unemployment, although currently higher than in the years immediately before the crisis – it stood at 16.5% in 2007 - has not experienced anything like the post-financial crisis hike felt in Ireland, Spain, Greece or Portugal, as it stood at 19.9% in 2013. This is undoubtedly related to the lower magnitude of the increase in general unemployment, although some characteristics specific to Finland – such as the high education level of the workforce – should also play their role in this outcome.
In the UK, recovery from the 2007-8 global crisis in terms of employment has also been next to non-existent, with unemployment failing to return to pre-crisis levels. Unemployment jumped from 5.6% to 7.6% between 2008 and 2009 – meaning that, at the height of the global crisis, about 1 million people lost their jobs. As in other countries, this was acutely felt in construction activities, the sector which had been creating jobs at the fastest rate before the crisis. In this period, construction alone accounted for a sixth of job losses in Britain. Since then, and despite the country leaving recession in 2010 – albeit featuring low growth rates since – the UK’s unemployment has failed to return to pre-crisis levels. By 2013, it still stood at 7.5%.
The crisis also saw a reversal in the evolution of long-term unemployment. Having been on the decline since the mid-1990s, long-term unemployment rate stood at just 1.3% in 2007. In the years after that, it would proceed to double, reaching 2.7% in 2011, 2012 and 2013. Youth unemployment also rose significantly. By 2013, 20.5% of British under the age of 25 years old were unemployed, representing a 6.2 p.p. increase in relation to 2007.
17
An even more clear-cut case of jobless growth is provided by Poland. Having had a peak unemployment rate of 20.0% during the early 2000s recession, the Polish unemployment rate fell extremely rapidly after the ascension of the country to the EU in 2004, reaching a minimum of 7.1% in 2008. As discussed above, Poland was actually the only country that did not record negative growth rates during or after the 2007-8 global crisis. Yet, despite this, unemployment began to creep back after 2008, standing at 10.3% in 2013. Long-term unemployment which had dropped to 2.5% by 2005, also began steadily growing from then on, standing at 4.4% in 2013. The same trend can be discerned regarding youth unemployment. In 2008, 17.2% of under 25 year-old active Poles were unemployed, a proportion that had risen to 27.3% by 2013.
Turkey also presents a good example of jobless growth. Recovery in terms of GDP was quick in Turkey after the 2007-8 shock. Yet unemployment has more or less stagnated from 2011 onwards, despite very high growth rates. While it is true that, in this latter year, it stood at 8.8%, - thus returning to pre-crisis levels – it did not fall significantly afterwards, standing stationary at 8.7% in 2013. Furthermore, this rate has to be regarded cautiously, in view of the importance of informal economic activities in Turkey. This results in a low rate of declared participation in the workforce – which the Turkish Statistical Institute estimates at 51.0% - and consequent underestimation of situations of unemployment.
Finally, we are left with the one single exception to this general picture of either stagnation or increased unemployment of the RESCuE sample: Germany. Germany had actually experienced an unemployment hike during and immediately after the early 2000s recession, which reached a maximum of 11.3% in 2005. Two years later, in the eve of the crisis, the unemployment rate was on the decline but still above EU average, standing at 8.7%. And the global crisis did not affect this trend, with unemployment rate proceeding to fall continuously after the crisis, reaching 5.3% in 2013 – a figure corresponding to less than half the EU average.
Long-term unemployment fell along the same line. After peaking in 2005 at 6.0%, the long-term unemployment rate in Germany then started to fall, with the global crisis having little noticeable impact on the trend. By 2013, it stood at 2.4% - again, less than half the EU average. Youth unemployment followed a similar path, showing a continuous
18
decline since 2005 – when it stood at 15.6%. By 2013, only 7.9% of active Germans of 24 years of age or younger were unemployed - an exceptionally low figure, representing about a third of the EU average.
Rising unemployment tells an important part of the story of the transformations in the labour market of the RESCuE countries before and after the global financial crisis. But it is by no means an exhaustive account of this story. In order to fully assess the impact of economic recession on the labour market, one has to take into account the specific realities of each of country. Here, we focus on two indicators that come to the forefront in the discussion of resilience: part-time employment and self-employment.
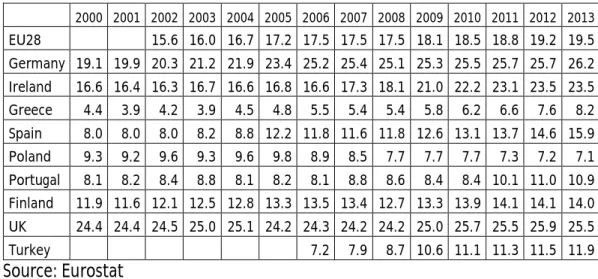
Regarding part-time employment, one can see how RESCuE countries differ among one another both regarding the starting point and their trajectory in the past decade. In 2007, on the eve of the crisis, three countries stood above or very close to the EU average of 17.5% of employed persons having part-time jobs: Germany with 25.7%, the United Kingdom with 24.2%. and Ireland with 17.3%. At the other end of the scale, we had Greece with 5.4%, Turkey with 7.9%, Poland with 8.5% and Portugal with 8.8%. Finland with 13.3%, and Spain with 11.8% occupy a somewhat middle position.
By 2013, EU average part-time employment rate had grown, a trend followed in all of the RESCuE countries except Poland. In our sample, part-time employment growth ranges from 0.6 p.p. in Finland and 0.8 p.p. in Germany to 2.1 p.p. in Portugal, 4.0 p.p. in Turkey, 4.3 p.p. in Spain and 6.2 p.p. in Greece.
Now, the increase in part-time employment can have different readings. At a macroeconomic level, it can follow the implementation of classic Keynesian measures of reduction in working hours as a reaction to sudden drops in aggregate demand to help prevent unemployment. A good illustration is the case of the German responses in the industrial sector to the immediate shockwaves of the 2007-8 crisis. These included a reduction in working hours up to a full day per week, with the loss in revenue by the workers being partly compensated by Social Security transfers. Aside these forms of macroeconomic risk-sharing, part-time employment may also, in some circumstances, be regarded as a transitional stage to full integration in the labour market. Conceivable examples of this include youth part-time employment while at school and/or during
19
university holidays or as a part of training and the reduction of working hours for parents during the early childhood of their children.
Table 5 – Part-time employment as a percentage of the total employment in the RESCuE Sample
2000 2001 2002 2003 2004 2005 2006 2007 2008 2009 2010 2011 2012 2013 EU28 15.6 16.0 16.7 17.2 17.5 17.5 17.5 18.1 18.5 18.8 19.2 19.5 Germany 19.1 19.9 20.3 21.2 21.9 23.4 25.2 25.4 25.1 25.3 25.5 25.7 25.7 26.2 Ireland 16.6 16.4 16.3 16.7 16.6 16.8 16.6 17.3 18.1 21.0 22.2 23.1 23.5 23.5 Greece 4.4 3.9 4.2 3.9 4.5 4.8 5.5 5.4 5.4 5.8 6.2 6.6 7.6 8.2 Spain 8.0 8.0 8.0 8.2 8.8 12.2 11.8 11.6 11.8 12.6 13.1 13.7 14.6 15.9 Poland 9.3 9.2 9.6 9.3 9.6 9.8 8.9 8.5 7.7 7.7 7.7 7.3 7.2 7.1 Portugal 8.1 8.2 8.4 8.8 8.1 8.2 8.1 8.8 8.6 8.4 8.4 10.1 11.0 10.9 Finland 11.9 11.6 12.1 12.5 12.8 13.3 13.5 13.4 12.7 13.3 13.9 14.1 14.1 14.0 UK 24.4 24.4 24.5 25.0 25.1 24.2 24.3 24.2 24.2 25.0 25.7 25.5 25.9 25.5 Turkey 7.2 7.9 8.7 10.6 11.1 11.3 11.5 11.9 Source: Eurostat
However, in other countries and situations, the increasing proportion of part-time jobs suggests instead the fast growth of precarious and hitherto atypical labour relations. The UK is a good case in point. The share of temporary and part-time contracts in Britain rose by nearly 10% after the crisis. Extremely precarious labour relations such as “zero-hour contracts” – where the employer does not have to guarantee any specific weekly number of working hours to the employee - experienced a sharp rise after 2008. By 2013, a total of 208,000 workers were under zero-hour contracts, representing 0.7 of the total workforce – although this is likely to be a severe underestimation. Younger workers and those of specific economic sectors such as healthcare, hospitality, administration and retail are particularly targeted.
In the peripheral countries of the EU, this problem is even more evident. In Greece and Portugal, for instance, deregulation of labour markets was a key point in the Memorandum of Understanding that accompanied the IMF and EU financial intervention during the debt crisis. In the Greek case, this seems to have resulted in a fully-fledged phenomenon of conversion of full-time and permanent contracts into part-time and ad-hoc ones in the private sector, with firms frequently firing employees, and at re-hiring them afterwards at lower wages and on a more precarious basis.
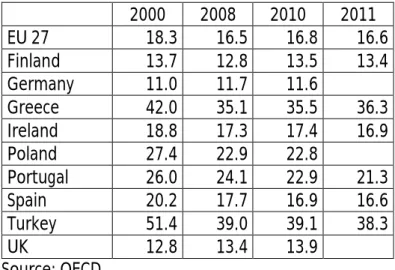
Another indicator of relevance is that of self-employment. As shown in Table 6, the RESCuE countries differ widely in this regard. Taking 2010 as a reference year, three
20
main groups can be identified in the sample. The first is composed of countries where self-employment as a percentage of total employment is clearly above the EU average of 16.8%: Turkey with 39.1%; Greece with 35.5%; Portugal with 22.9%; and Poland with 22.8%. The second group features two countries that hover around the average: Ireland, with 17.4%; and Spain, with 16.9%. Finally, one can point to three RESCuE countries where self-employment was lower than the average in 2010: the UK with 13.9%; Finland with 13.5%; and Germany with 11.6%.
In public discourse, entrepreneurship and the creation of one’s own business are often touted as effective individual answers to economic crisis situations. However, these claims should be met with caution and a realistic discussion on the question of self-employment.
Firstly, one should take into account that a self-employed worker is placed in a category that can harbour very different situations. To be sure, it does comprise young entrepreneurs in technological start-ups or micro-business units set up by former workers who became unemployed. However, it can also include a wide range of precarious situations, such as free-lance teachers or industry workers working at home and paid by-the-piece. In short, it encompasses many situations where there is no formal permanent link between the worker and the institution – public or private – for which he works.
Table 6 – Self-employment as a percentage of total employment 2000 2008 2010 2011 EU 27 18.3 16.5 16.8 16.6 Finland 13.7 12.8 13.5 13.4 Germany 11.0 11.7 11.6 Greece 42.0 35.1 35.5 36.3 Ireland 18.8 17.3 17.4 16.9 Poland 27.4 22.9 22.8 Portugal 26.0 24.1 22.9 21.3 Spain 20.2 17.7 16.9 16.6 Turkey 51.4 39.0 39.1 38.3 UK 12.8 13.4 13.9 Source: OECD
21
The German case is emphatic in this regard. Studies of the German labour market emphasize that non-standard labour rose considerably since the mid-2000s, to the point that, by 2012, it comprised a quarter of the active population. There is also evidence linking self-employment to lower wages and deteriorated working conditions in Germany, with the number of self-employed persons receiving basic supplementary income having grown from 72,000 to 127,000 between 2007 and 2011.
Non-standard labour is also an increasingly important feature of other labour markets. In Turkey, where a switch from an import-substitute to an export-oriented economy has taken place since the 1980s, strong economic growth heavily depends on sectors that make widespread use of informal labour, as a means to adapt to fluctuations in demand. This particularly affects women and youth – to the point of including child labour – and translates into work at home and other forms of employment on a non-contract basis and without access to social security benefits.
Another case worth mentioning is that of Portugal. Here, 76.4% of self-employed workers were isolated self-employed - that is, they were not employers. Moreover, 9.3% of these isolated self-employed were estimated by the Portuguese National Statistical Institute as actually being in situation commonly referred to as “dependent self-employment” or “false independent work”. In these latter cases, workers perform regular functions at employer institutions but do not have a permanent contract and receive their wages against a receipt, just as if they were an independent professional. This exempts employers from defining a fixed set of working hours, from paying their share in social security contributions – which, in these cases, is entirely borne by the worker – and also from legal compensation to workers in case of lay-off. Moreover, being formally independent, these workers do not have access to regular social protection measures, such as unemployment benefit and paid sickness leave.
Secondly, two trends of evolution can be detected regarding self-employment in the RESCuE sample. In countries such as Finland, Germany and the United Kingdom, self-employment rates have shown little variation since the early 2000s. However, a trend of decline is noticeable in countries such as Portugal, Spain, Poland, Turkey and Greece.
22
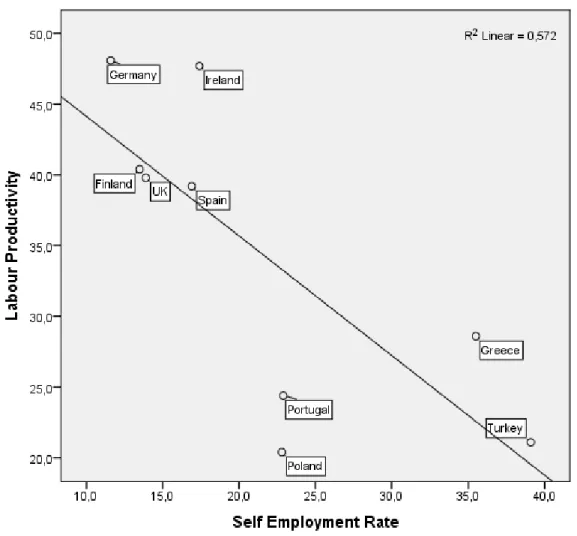
Figure 1 – Labour productivity (GDP per hour worked) and self-employment rate in the RESCuE countries in 2010
Data source: OECD
This is not surprising, given the range of situations covered by the category of self-employment. On the one hand, precarious workers are in a more vulnerable position and are likely to be the first to lose their jobs in an economic downturn. On the other hand, small and micro business are just as vulnerable as other firms (if not more) to the collapse of aggregate demand derived from recessions – a fact that also illustrates the limits of self-creation of jobs in the context of economic crisis
Thirdly, as can be seen in Figure 1, an inverse relationship can be detected between the self-employment rate and productivity. Indeed, it is the four countries that feature highest in self-employment rates – Portugal, Poland, Greece and Turkey – that show the lowest levels of productivity.
Indeed, there is a case for pondering whether excessive levels of self-employment actually hamper economic development. On the one hand, economic fabrics
over-23
relying on micro and small businesses face problems such as capital pulverization, low technological incorporation, lack of organizational differentiation and means of organizational development. On the other hand, precariousness in itself incentivizes short-term reactions to economic downturn such as lay-offs and high worker turnover while discouraging structural changes in firms, including investment in training or technological and organizational modernization.
Although with variable intensity in the RESCuE sample, unemployment growth and increasing labour precariousness seem to be key features in the transformation of labour markets that was already taking place in the period leading up to the 2007-8 global credit crisis. It is thus important to assess how these changes are reflected in household income.
1.3. Income and inequality
Addressing the themes of poverty and resilience, the problem of income inequality is a crucial one.1 Apart from showing the wide asymmetries between the RESCuE countries with regard to median income – ranging from 5 057 euros per equivalent adult per year in Poland to 19 592 in Germany in 20122 - Table 7 highlights the evolution and, particularly, the years of decline in nominal annual median income. As would be expected in view of the timeline of the crisis, these are concentrated from 2008 onwards. It should be noted, however, that that these reductions do not occur at the same time. The UK was the first country where median income started to decline. By 2009, annual median net income per equivalent adult in Britain was 4 873 euros/year lower than in 2007, representing a staggering drop of 23.1%. Despite a slow recovery in the following years, median income was still to recover pre-crisis levels by 2012, standing at only 89.1% of that recorded in 2007. In Ireland, income also experienced a
1 Income inequality is one of the main forms of inequalities, which cover a broad range of forms and
domains. Poverty is one of them and income inequality is one of main factors of poverty, although the two concepts cannot be equalized. Therefore, the eradication of poverty does not imply absolutely equalitarian societies, while there can be societies with levels of income inequality rather high but where most people access the necessary means for a fair living.
2 Eurostat does not present values for this indicator for Turkey in recent years. The only year for which
data is available for Turkey is 2006. Median net income for Turkey in this latter year stood at 2 372 euros per equivalent adult – the lowest in the RESCuE sample at the time.
24
harsh contraction. Between 2008 and 2012, annual median income fell by 3 367 euros per equivalent adult – a reduction of 15.1% - and was still falling by 2012.
Table 7 - Median Equivalised Net Income in the RESCuE countries per year (in Euros)
2000 2001 2003 2004 2005 2006 2007 2008 2009 2010 2011 2012 EU27 12 637 12 916 13 879 14 456 14 610 14 736 14 874 15 338 Germany 15 339 15 758 16 395 15 646 17 774 18 304 18 586 18 795 19 043 19 592 Ireland 12 119 14 255 17 079 18 075 18 798 19 757 22 065 22 995 22 445 20 512 19 726 19 078 Greece 6 923 7 107 8 207 8 857 9 400 9 833 10 080 10 800 11 530 11 963 10 985 9 460 Spain 8 236 9 027 10 200 10 417 11 111 11 644 12 624 12 856 12 666 12 115 11 970 Poland 2 531 3 111 3 502 4 154 5 090 4 402 5 032 5 057 Portugal 5 662 5 982 6 921 7 200 7 311 7 576 8 152 8 267 8 678 8 410 8 323 Finland 14 208 14 861 16 679 17 481 18 304 18 703 19 794 20 962 21 349 21 826 22 699 UK 15 441 17 720 18 546 19 403 21 139 18 766 16 266 17 106 17 136 19 007 Turkey 2 372 Source: Eurostat
Note: Years of negative growth in red; maximum in the period in green
By 2010, the degradation of general income levels also began to hit Spain. By 2012, median annual income was still falling, being 886 euros less than in 2009 – that is, a 6.9% drop in relation to 2012. Poland too recorded a decline in median net annual income in the same year. The Polish case is very interesting in this regard. Despite Poland escaping negative GDP growth throughout the global crisis period and actually enjoying a healthy 3.9% growth rate in 2010, Polish median income dropped by 688 euros – representing 13.5% - in that year alone. Median income in Poland did recover in the following two years, yet by 2012, it had still not surpassed 2009 levels. This contrasted heavily with the fast growth rate recorded between 2005 and 2009, a period during which Polish median income effectively doubled, rising from 2 531 to 5 090 euros/year per equivalent adult. In 2011, two further countries slid into a declining trend. In Portugal, median income fell by 268 euros in 2011 and a further 87 euros in 2012 – representing a total reduction of 4.1% in relation to 2010. Greece’s case is considerably more emphatic, with the magnitude of the contraction matched only by the UK. In 2011, median income fell by 978 euros/year and a further 1 525 euros in 2012. This meant that, by 2012, median income in Greece was 9 460 euros/year per equivalent adult – that is, a mere 79.1% of that of 2010.
25
Germany and Finland are the only countries in the RESCuE sample that do not follow this declining trend. Indeed, Finnish median net income never stopped increasing in the period covered by Table 7 and, by 2012 stood at 22 699 euros/year per equivalent adult – representing growth of 21.4% in relation to 2007. Median income growth in Germany is less dramatic, but still remarkable. Between 2007 and 2012, median income grew 1 818 euros/year per equivalent adult – representing an increase of 10.2% in the period. A point of discussion arising from the analysis of this data concerns the relationship between median income and economic growth. Indeed, reductions in median income do not always match decline in economic performance either in start or duration. In some countries, such as Ireland and the UK, the GDP contraction was almost immediately accompanied by a drop in household income. In others, such as Portugal or Greece this effect occurred much later, with negative GDP growth rates only taking their toll from 2011 onwards. By contrast, in others such as Poland, income declines occurred even without negative GDP growth.
This discrepancy between these two indicators is a sign of the operation of “buffers” mediating the relationship of the business cycle with the evolution of family income. Two of these buffers will be further explored in the next chapters: welfare state regimes and social economy institutional landscape. But another important buffer is precisely labour market regulation. Indeed, different types of regulation models of labour relations – including the importance of collective bargaining instances, the predominant labour contract forms or the regulation of lay-offs – can play a major role in either accelerating, delaying, mitigating or magnifying the effects of upturns and downturns in economic performance.
An interesting example in this regard is provided by Germany. Even if German nominal median income has continued growing since 2000s (with the exception of 2006), the actual share of national wealth going to the working classes has been declining over the past 20 years. This is very much tied to wage compression policies – by pegging salary increases to inflation (which has been very low for the most part of the last twenty years) and not to productivity – but also to the growth of precarious and non-standard forms of work, which are not covered by traditional collective negotiation and labour protection structures.
26
Thus, in order to fully grasp the consequences of recent transformations in the labour market, it is also important to consider how wealth distribution has evolved within the RESCuE sample. When looking at the S80/S20 ratio – which compares the income of the first quintile with that of the last quintile - one verifies how heterogeneous the RESCuE countries are in this regard too. Placing these countries on a continuum, closer to an equal distribution pole are countries such as Finland (where the income of the top quintile was only 3.7 times that of the bottom quintile in 2012) or Germany (where the analogous ratio was 4.3). In contrast, Spain (where the income of the top quintile in 2012 was 7.2 times that of the bottom quintile), Greece (where it is 6.6 times) and Portugal (5.8 times) are closer to a wealth concentration pole.
Table 8 – S80/S20 income quintile ratio in the RESCuE sample.
2000 2001 2002 2003 2004 2005 2006 2007 2008 2009 2010 2011 2012 EU28 5.0 5.1 5.1 Germany 3.5 3.6 3.8 4.1 4.9 4.8 4.5 4.5 4.5 4.3 Ireland 4.7 4.5 4.9 4.9 5.0 4.9 4.8 4.4 4.2 4.7 4.6 Greece 5.8 5.7 6.4 5.9 5.8 6.1 6.0 5.9 5.8 5.6 6.0 6.6 Spain 5.4 5.5 5.1 5.1 5.2 5.5 5.5 5.5 5.7 6.4 7.2 7.1 7.2 Poland 4.7 4.7 6.6 5.6 5.3 5.1 5.0 5.0 5.0 4.9 Portugal 6.4 6.5 7.3 7.4 7.0 7.0 6.7 6.5 6.1 6.0 5.6 5.7 5.8 Finland 3.3 3.7 3.7 3.6 3.5 3.6 3.6 3.7 3.8 3.7 3.6 3.7 3.7 UK 5.2 5.4 5.5 5.3 5.9 5.4 5.3 5.6 5.3 5.4 5.3 5.4 Turkey 10.8 9.9 11.3 Source: Eurostat
But heterogeneity between countries is also visible when considering the evolution of the S80/S20 ratio since 2000. Spain stands out as a case in which the crisis was very quickly reflected in a rapid increase in inequality. While the income of the top 20% was 5.5 times that of the lowest 20% in 2007, by 2010 the same ratio had increased to 7.2 times – and would remain thereabouts for the next two years. Greece, already one of the countries in the sample with a higher S80/S20 ratio before the crisis, also saw a fast increase in inequality, particularly after 2010 – about the same time that median income began to fall.
Portugal is also an interesting case in this regard. Portugal entered the new millennium as the country with the highest inequality level in the RESCuE Sample as measured by
27
this indicator, and the indicator peaked in 2003 – when the income of the top 20% was 7.3 times that of the bottom 20%. From thereon, the S80/S20 would start a slow decline reaching a minimum of 5.6 in 2010. Like Greece, however this trend would reverse in 2011 and 2012, at the same time when the median wage began to fall.
For other RESCuE countries, the impact of the crisis on this indicator is far less visible. Germany does feature a considerably higher S80/S20 ratio in 2012 than in 2000. The income of the top 20% of the German population was 4.3 greater than that of the bottom 20%, which is consistent with a long-term trend of rising inequality. However, most of the growth occurred in the years immediately before the crisis – peaking at 4.9 in 2007 - and the S80/S20 ratio has actually receded since. Poland follows a similar trend. In 2012 the S80/S20 ratio stood at 4.9 - just 0.2 above the level of 2000 - after having peaked at 6.5 in 2000. In Ireland too, although general variation in the period is lower than either in Germany or Poland, with the S80/S20 peaking at around 5.0 in the years just before the crisis (2005-2007).
In the other countries, the variation during this period is practically unnoticeable. The UK, though being fourth country in the sample with the highest S80/S20 ratio, has seen it floating in narrow band between 5.6 and 5.3 since 2006. Finally, in Finland, we also find a narrow interval for the same period, but between 3.3 and 3.7.
Analysis of this data thus puts forward two further transformations in late capitalist economies. The first is that the relatively high economic growth rates of the mid-2000s were accompanied by a surge in inequality – which suggests that the wealth gains in this period tended to be geared towards the top tiers of income distribution. This seems to be the case in countries such as Ireland, Poland and Germany, whose maximum points for the S80/S20 ratio in this period are located in the immediate pre-crisis years of 2005, 2006 and 2007. The above further hints at the possibility that economic growth is not only no longer necessarily associated with job creation – at least in equivalent measure – but also not accompanied by redistribution of wealth – both crucial features of European welfare state-framed capitalism after World War II.
The second transformation concerns countries that were already plagued by high rates of inequality before the crisis. In these countries, the years after 2008 witnessed either
28
a further deepening of inequality levels – such as in Spain and Greece – or a stopping and then reversal of a declining trend – such as Portugal. Incidentally, both the hike in inequality in Greece and the reversal of the decreasing trend in Portugal coincide with the enforcement of EU-IMF-ECB monitored austerity programmes from 2010 onwards. This highlights not only how public policies can have just as powerful effects over living conditions as the economic crisis itself but also how new political economy arrangements may be forming, which hinge more on the lowering or stagnating salaries and on increasing inequality than on redistribution – as was characteristic of post-war welfare-state capitalism. These topics will be further developed on chapter 2.
1.4. Migration flows
The 2007-8 global financial crisis and subsequent European economic recession also had significant effects on the migration movements to and from the RESCuE countries. This is not surprising given the strong economic element usually present in migratory phenomena, as migration flows consistently flow from economically depressed regions towards more affluent ones. Nevertheless, it is still striking to see up to what point and how quickly the general migration panorama was to change in some of the RESCuE countries. Indeed, data regarding migrations point to the crisis as a watershed point marking the reversal of some hitherto established trends and the deepening of others. Before tackling the evolution of emigration and immigration per se, we will start by considering net migration, that is, roughly the difference between immigration and emigration, in the RESCuE sample. This is due to the fact that a more synthetic indicator allows for a clearer analysis of the magnitude and timing of the changes in migration patterns brought on by the crisis.
Between 2000 and 2007, only two of the RESCuE countries, Poland and Turkey, recorded years of negative net migration – with Turkey very close to break-even. By contrast, this number increased to seven for the period between 2008 and 2012, with only Finland and the UK escaping yearly negative net migration at some point in this period – and in 2012, the UK itself actually recorded its lowest positive value since 2000.
29
However, even when considering those RESCuE countries whose migration patterns were affected during the crisis, the situation is by no means uniform. Indeed, although Germany features net negative migration in consecutive years at the peak of the global crisis – 2008 and 2009 – it recovered very quickly, with the cumulative loss of those years being completely covered in a single year – 2010. By 2012, Germany boasted a net migration gain of 3 919 thousand, which not only represented its highest figure for this indicator in the 21st century but also accounted for 45.3% of total net migration across the entire European Union for that year.
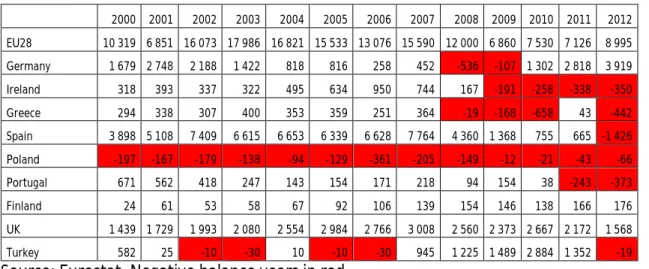
Table 9 – Demographic balance in the RESCuE countries, in thousands
2000 2001 2002 2003 2004 2005 2006 2007 2008 2009 2010 2011 2012 EU28 10 319 6 851 16 073 17 986 16 821 15 533 13 076 15 590 12 000 6 860 7 530 7 126 8 995 Germany 1 679 2 748 2 188 1 422 818 816 258 452 -536 -107 1 302 2 818 3 919 Ireland 318 393 337 322 495 634 950 744 167 -191 -258 -338 -350 Greece 294 338 307 400 353 359 251 364 -19 -168 -658 43 -442 Spain 3 898 5 108 7 409 6 615 6 653 6 339 6 628 7 764 4 360 1 368 755 665 -1 426 Poland -197 -167 -179 -138 -94 -129 -361 -205 -149 -12 -21 -43 -66 Portugal 671 562 418 247 143 154 171 218 94 154 38 -243 -373 Finland 24 61 53 58 67 92 106 139 154 146 138 166 176 UK 1 439 1 729 1 993 2 080 2 554 2 984 2 766 3 008 2 560 2 373 2 667 2 172 1 568 Turkey 582 25 -10 -30 10 -10 -30 945 1 225 1 489 2 884 1 352 -19 Source: Eurostat. Negative balance years in red
In the case of Turkey, the change brought on by the crisis was also one of a vast increase in net migration gains. After a period between 2002 and 2006 where net migration was close to zero, migration gains picked up after 2007, reaching a maximum of 2 884 thousand in 2010. However, it should be pointed out that net migration was again back to near-zero levels by 2012, which might be tributary of a new trend.
Poland’s case also bears some similarities with these two, albeit here regarding the rate of net migration loss and not of any gain. Poland has featured negative net migration for every year since 2000. However, the rate of loss has actually diminished with the crisis. Peaking at 361 thousand individuals in 2006, net migration loss was down to 12 thousand by 2009 – the country’s lowest for the period in analysis. Although the population loss did increase in the following years, the figure of 66 thousand in 2012 was still well below that of any of the pre-crisis years considered.