UNIVERSIDADE DA BEIRA INTERIOR
Engenharia
Planning and Dynamic Spectrum Management in
Heterogeneous Mobile Networks with QoE
Optimization
Daniel Luís Silveira Robalo
Tese para obtenção do Grau de Doutor em
Engenharia Eletrotécnica e de Computadores
(3º ciclo de estudos)
Orientador: Prof. Doutor Fernando José da Silva Velez
Departamento de Engenharia Electromecânica
Universidade da Beira Interior
Covilhã, Portugal
iii
v
Acknowledgements
This work was only possible thanks to the contribution of many people. Foremost among these is Prof. Fernando J. Velez, my Ph.D. advisor, whose guidance and technical excellence were the keystone to achieve the goals of all research stages.
This work was performed and financially supported within the scope of several projects: Ubiquimesh, Planopti, Opportunistic-CR and CREaTION. The frameworks from these projects were the cornerstone for this thesis. I am grateful to all projects members, coordinators and researchers for their guidance and contributions throughout the years. I would also like to acknowledge the European Cooperation in Science and Technology (COST), namely COST2100, COST IC1004 and COST IC0905 “TERRA”.
To Instituto de Telecomunicações (IT) and Universidade da Beira Interior (UBI), I would like to acknowledge the excellent lodging and outstanding working conditions. IT and UBI supported my attendance to research meetings and conferences, essential for my research and to divulge this work.
I would also like to acknowledge Robert Kooij, from TNO ICT, who provided MOS experimental results of gaming applications, Giuseppe Piro, from Politecnico de Bari, for is precious guidance in the implementation of Carrier Aggregation functionalities into LTE-Sim. I am thankful to Maria Camino Noguera and M. Kashif Nazir, former students from UBI and King’s College of London, respectively, for their contributions in the formulation of the system capacity and Optimization of the cost/revenue trade-off of fixed WiMAX with and without relays. I am very grateful to Paulo Soeiro and Rui Sancho, from Viatel, who provided information on current LTE equipment prices and installation cost. Additionally, Finally, I would also like to thanks Jessica Acevedo, from IT-UBI, for her suggestions given in the context of the average SINR formulation in the context of LTE-A carrier aggregation.
To my colleagues from WE-Move@Covilhã, João Ferro, Luís Borges, Orlando Cabral, Rui Paulo, João Oliveira, and Jorge Tavares, I would like to thank all for their support and friendship. I am very grateful to my beloved Sandra Morais for her never ending love, affection, friendship, and relentless praise. To kali, whose playfulness, livelihood and wiggling tail brightens my every day. At last, but never least, I am thankful to my family, especially my parents, and brother for their unconditional love, care and support.
vii
Resumo
O planeamento rádio e otimização de redes são processos que não terminam após o lançamento de uma rede sem fios. De forma a alcançar o melhor equilíbrio entre qualidade e custos, as operadoras recorrem a diversos métodos de forma a melhorar a cobertura bem como a capacidade das suas redes. Por conseguinte, a investigação realizada nesta tese propõe os seguintes métodos: a implementação de cell zooming e estações repetidoras (RSs), com modos dinâmicos para a redução de consumo energético, e a agregação de portadoras (CA), a fim de melhorar a cobertura e a capacidade celular.
Inicialmente, apresenta-se um survey sobre cenários de implementação de redes em malha ubíquas, e propõe-se uma caracterização atualizada dos requisitos de serviços e aplicações. Definiram-se, ainda, as métricas de desempenho para os parâmetros chave: o atraso, a variação do atraso, perdas de informação e débito, para vários serviços. Dada a atual concorrência existente no mercado das comunicações móveis, o sucesso de uma operadora não depende apenas da qualidade que oferece o seu serviço (QoS), mas, também, se essa responde à expetativa dos clientes, isto é, a qualidade de experiência (QoE). Neste contexto, propõe-se um modelo que mapeia parâmetros de QoS em QoE para tráfego multimédia.
No que concerne ao planeamento e otimização de redes Worldwide Interoperability
for Microwave Access (WiMAX) fixas com RSs e cell zooming, considerou-se o cenário exigente
da região montanhosa da Covilhã. Além disso, uma função de custo/proveito foi desenvolvida considerando-se o custo da construção e da manutenção da infraestrutura com RSs. Nesta parte da investigação, analisou-se, também, a eficiência energética e as implicações económicas da utilização dos modos de poupança energética das RSs. Assim, assumindo que as RSs possam ser desligadas nos períodos em que a troca de tráfego é reduzida, tal como noites e fins-de-semana, demonstrou-se que esse consumo pode ser reduzido enquanto a cobertura celular, a capacidade e o desempenho económico podem ser otimização.
Finalmente, propôs-se uma entidade de gestão de recursos rádio integrada (iCRRM) que implementa CA num sistema Long Term Evolution – Advanced (LTE-A) ao agendar recursos entre bandas de 800 MHz e 2.6 GHz disponíveis em Portugal. Posto isto, tendo em conta o tráfego de vídeo, após simulações extensas verificou-se que com os escalonadores de multi banda propostos supera-se a capacidade de sistemas LTE sem CA. Os resultados obtidos demonstram que recorrendo à CA existe uma clara melhoria dos parâmetros de QoS, da QoE e aspetos económicos.
Palavras-chave
Planeamento celular e otimização, cenários de implementação, caracterização de serviços e aplicações, QoS, QoE, WiMAX, SINR, repetidores, cell zooming, otimização de custos/proveitos, LTE-A, agregação de portadoras, escalonamento multi banda
ix
Abstract
The radio and network planning and optimisation are continuous processes that do not end after the network has been launched. To achieve the best trade-offs, especially between quality and costs, operators make use of several coverage and capacity enhancement methods. The research from this thesis proposes methods such as the implementation of cell zooming and Relay Stations (RSs) with dynamic sleep modes and Carrier Aggregation (CA) for coverage and capacity enhancements.
Initially, a survey is presented on ubiquitous mesh networks implementation scenarios and an updated characterization of requirements for services and applications is proposed. The performance targets for the key parameters, delay, delay variation, information loss and throughput have been addressed for all types of services. Furthermore, with the increased competition, mobile operator’s success does not only depend on how good the offered Quality of Service (QoS) is, but also if it meets the end user’s expectations, i.e., Quality of Experience (QoE). In this context, a model for the mapping between QoS parameters and QoE has been proposed for multimedia traffic.
The planning and optimization of fixed Worldwide Interoperability for Microwave Access (WiMAX) networks with RSs in conjunction with cell zooming has been addressed. The challenging case of a propagation measurement-based scenario in the hilly region of Covilhã has been considered. A cost/revenue function has been developed by taking into account the cost of building and maintaining the infrastructure with the use of RSs. This part of the work also investigates the energy efficiency and economic implications of the use of power saving modes for RSs in conjunction with cell zooming. Assuming that the RSs can be switched-off or zoomed out to zero in periods when the traffic exchange is low, such as nights and weekends, it has been shown that energy consumption may be reduced whereas cellular coverage and capacity, as well as economic performance may be improved.
An integrated Common Radio Resource Management (iCRRM) entity is proposed that implements inter-band CA by performing scheduling between two Long Term Evolution – Advanced (LTE-A) Component Carriers (CCs). Considering the bandwidths available in Portugal, the 800 MHz and 2.6 GHz CCs have been considered whilst mobile video traffic is addressed. Through extensive simulations it has been found that the proposed multi-band schedulers overcome the capacity of LTE systems without CA. Result shown a clear improvement of the QoS, QoE and economic trade-off with CA.
Keywords
Cellular planning and optimization, deployment scenarios, services and applications characterization, QoS, QoE, WiMAX, SINR, relays, cell zooming, cost/revenue optimization, LTE-A, carrier aggregation, multi-band scheduling
xi
Table of Contents
List of Figures ... xv
List of Tables ... xix
List of Acronyms ... xxi
List of Symbols ... xxv
Chapter 1 Motivation and approach ... 1
Motivation and approach ... 1
1.1 Main objectives ... 4
1.2 Cellular Network Planning and Optimization ... 6
1.3 1.3.1. Pre-planning ... 7
1.3.2. Planning ... 8
1.3.3. Detailed planning ... 8
1.3.4. Verification and Acceptance ... 8
1.3.5. Optimization... 8
1.3.6. Network Coverage and Capacity Enhancement Methods ... 9
Contributions ... 10
1.4 Structure of the Thesis ... 14
1.5 Chapter 2 Deployment Scenarios and Characterization Parameters for Concatenated Ubiquitous Wireless Mesh Network Applications ... 17
Introduction ... 17
2.1 Scenarios ... 18
2.2 2.2.1. Mobile Business User Scenario ... 18
2.2.2. Nomadic Business User Scenario ... 19
2.2.3. Gaming User Scenario... 19
2.2.4. Fixed Home User – Leisure Activity Scenario ... 20
2.2.5. Fixed Home User – Entertainment Activity Scenario ... 21
2.2.6. Tourist/Attraction Visitor Scenario... 21
2.2.7. Video Surveillance/Home Monitoring Scenario ... 22
2.2.8. Mobile Commerce Scenario ... 24
Key Parameters Impacting the User ... 26
2.3 Performance Considerations for Different Applications ... 26
2.4 2.4.1. Audio ... 26
2.4.2. Video ... 27
xii
2.4.4. Background Applications ... 29
2.4.5. Context-based Information ... 30
ITU-T and 3GPP Performance Targets ... 30
2.5 EU-MESH Services and Applications Requirements ... 32
2.6 WiMAX Forum Application Working Group Views ... 33
2.7 2.7.1. VoIP Traffic Model (Class 2) ... 35
2.7.2. Video Conference Traffic Model (Class 2) ... 36
2.7.3. MPEG traces ... 37
2.7.4. Music/Speech Traffic Model (Class 3) ... 38
Proposed Requirements for Services and Applications ... 38
2.8 Conclusions ... 40
2.9 Chapter 3 Generic Unified Model for the Mapping between the Quality of Service and Experience in Multimedia Applications ... 43
Introduction ... 43 3.1 Gaming Applications ... 44 3.2 Video Applications ... 48 3.3 Web-browsing Applications ... 49 3.4 Audio Applications ... 53 3.5 Unified Model ... 56 3.6 Conclusions ... 58 3.7 Chapter 4 Planning and Optimization of Fixed WiMAX Networks with Relays ... 59
Introduction ... 59
4.1 Carrier-to-Noise-plus-Interference Ratio ... 60
4.2 4.2.1. Carrier-to-Noise-plus-Interference Ratio without Relays ... 60
4.2.2. Interference-to-Noise Ratio and Reuse Pattern ... 66
4.2.3. Carrier-to-Noise-plus-Interference Ratio and co-channel Reuse Factor ... 72
4.2.4. Carrier-to-Noise-plus-Interference Ratio with Relays ... 73
System Capacity ... 78
4.3 4.3.1. Modelling of the Propagation Environment ... 78
4.3.2. Measurements Results and Curve Fitting ... 81
4.3.3. Assumptions ... 82
4.3.4. Supported Cell/Sector Physical Throughput ... 86
Cellular Planning in Actual Environments ... 91
4.4 Conclusions ... 95
4.5 Chapter 5 Cost/Revenue Trade-off and Energy Saving Through Relay Sleep Modes and Cell Zooming 97 Introduction ... 97 5.1
xiii
Models ... 98
5.2 Assumptions with no Relays... 100
5.3 Assumptions with Relays ... 101
5.4 Cost/Revenue Trade-off in the Optimization of Fixed WiMAX Deployment with 5.5 Relays 103 Economic and Environmental Impact of Cell Zooming ... 105
5.6 Conclusions ... 107
5.7 Chapter 6 Carrier Aggregation for Wireless Cellular Networks Capacity Enhancement ... 109
Introduction ... 109
6.1 Definition of key terms for LTE-Advanced Carrier Aggregation ... 111
6.2 3GPP Carrier Aggregation Deployment Scenarios ... 113
6.3 Common Radio Resource Management for Carrier Aggregation, Objective and System 6.4 Model 114 General Multi-Band Scheduling ... 117
6.5 Enhanced Multi-Band Scheduling ... 120
6.6 Basic Multi-Band Scheduling ... 121
6.7 System Capacity ... 121
6.8 Average SINR Analysis with Reuse Pattern Equal to Three ... 127
6.9 6.9.1. SINR at a Given Position ... 127
6.9.1. Average Cell SINR ... 129
Transmitter Power Normalization Procedure ... 131
6.10 Cell Capacity Analysis ... 132
6.11 Simulation Environment ... 135
6.12 Simulation Results ... 136
6.13 6.13.1. Packet Loss Ratio ... 136
6.13.2. Delay ... 137
6.13.3. Quality of Experience ... 138
6.13.4. Goodput ... 139
6.13.5. Spatial Distribution and Allocation of Radio Resources with iCRRM ... 141
6.13.6. Spatial Distribution of the Supported Goodput with iCRRM ... 142
Cost/Revenue Analysis ... 144
6.14 Conclusions ... 147
6.15 Chapter 7 Conclusions and Future Research Direction ... 151
Conclusions ... 151
7.1 Suggestions for Future Research ... 158
7.2 Appendix A Calculation of the Average SINR ... 161
Appendix B Implementation of Carrier Aggregation into LTE-Sim ... 165
xv
List of Figures
Figure 1.1 Network planning project organisation (extracted from [18]). ... 6
Figure 1.2 Network planning process steps (extracted from [18]). ... 7
Figure 1.3 Network performance constraint evolution path (extracted from [18]). ... 9
Figure 1.4 Radio and network planning optimization. ... 10
Figure 3.1 MOS results as a function of the number of samples. ... 46
Figure 3.2 Variation of the MOS considering only the interference of the ping. ... 47
Figure 3.3 Sequences for the video the metric tests (extracted from [77]). ... 48
Figure 3.4 Time-line for the web-browsing application: T1 is the non-interactive response time, T2 is the non-interactive download time, T3 and T4 are the equivalents for the interactive part (extracted from [83]). ... 50
Figure 3.5 MOS fitting as a function of the transferred data and brate for web-browsing application. ... 53
Figure 3.6 MOS vs. packet loss rate ρ for AMR codec (extracted from [91]). ... 55
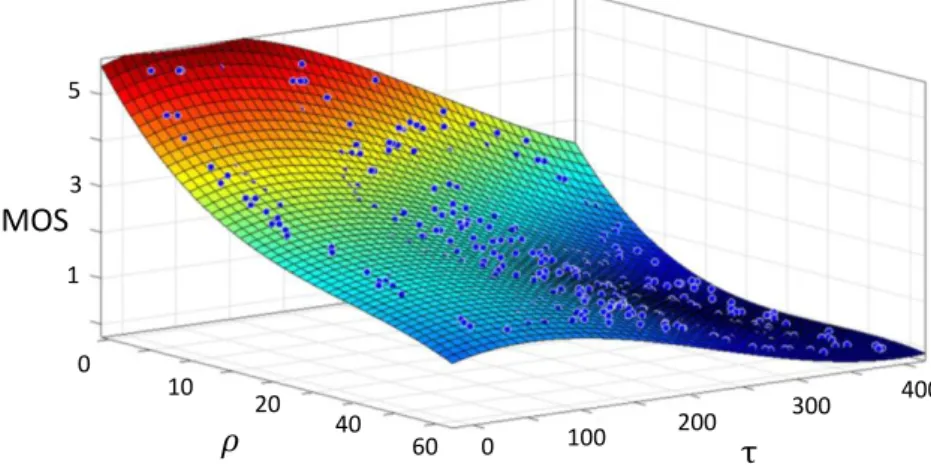
Figure 3.7 MOS fitting as a function of packet loss and delay for audio applications. ... 56
Figure 4.1 Co-channel interference in the worst-case for the DL (extracted from [94]). ... 60
Figure 4.2 Co-channel interference in the worst-case for the UL... 61
Figure 4.3 Co-channel interference in the worst-case for the UL... 64
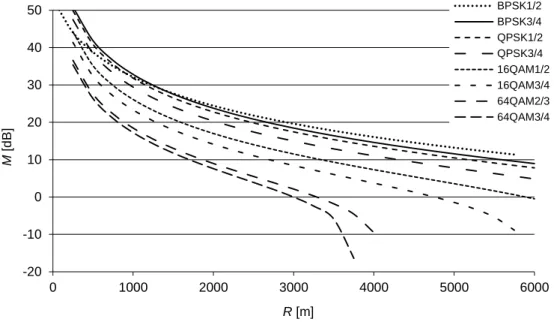
Figure 4.4 Interference-to-noise ratio without sub-channelization... 66
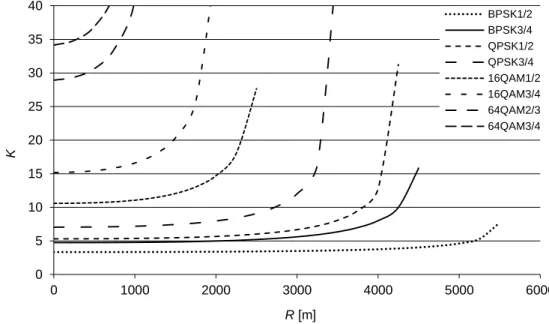
Figure 4.5 Reuse co-channel factor as a function of the coverage distance with MCS level as a parameter, in the DL without sub-channelization. ... 67
Figure 4.6 Reuse pattern as a function of the coverage distance with MCS level as a parameter, in the DL without sub-channelization. ... 67
Figure 4.7 Reuse pattern as a function of the coverage distance with MCS level as a parameter, in the UL without sub-channelization. ... 68
Figure 4.8 Interference-to-noise ratio with sub-channelization, valid for both links. ... 69
Figure 4.9 Reuse co-channel as a function of the coverage distance with MCS level as a parameter, in the UL with sub-channelization. ... 69
Figure 4.10 Reuse pattern as a function of the coverage distance with MCS level as a parameter, in the UL with sectorisation, but without sub-channelization. ... 71
Figure 4.11 Reuse pattern as a function of the coverage distance with MCS level as a parameter, in the UL with sectorisation and sub-channelization. ... 71
Figure 4.12 CNIR as a function of rcc with R as a parameter, in the UL, no sub-channelization. ... 72
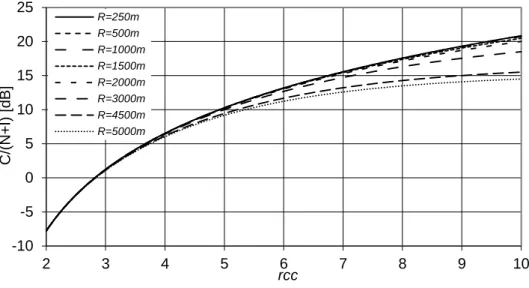
Figure 4.13 CNIR as a function of rcc, with R as a parameter, in the UL with sub-channelization. ... 73
xvi
Figure 4.14 CNIR as a function of rcc, with R as a parameter, in the UL with sub-channelization and sectorization. ... 73 Figure 4.15 DL Scenario. ... 74 Figure 4.16 DL Scenario with 120 º RS sectorial antennas and 240º RS sector coverage area. 75 Figure 4.17 Distances from the RS interferers to the SS. ... 76 Figure 4.18 Decrease of the co-channel interference by using directional antennas at RS. ... 77 Figure 4.19 Distances from RS to BS in the UL. ... 78 Figure 4.20 Measurement campaigns μBS setup and measurement equipment. ... 79 Figure 4.21 Distribution of the terminal received power (dBm) for a measurement point taken in Covilhã. The superimposed Gaussian curve (in dB) suggests this terminal received power ensemble is approximately log-normal. ... 80 Figure 4.22 Measured and modified Friis (γ = 2.416) path loss curve. ... 81 Figure 4.23 Influence of the angles of incidence and arrival in the computation of the path loss. ... 82 Figure 4.24 a) BS, RS and respective “hexagonal” coverage areas, b) central coverage zone zooms out when RSs sleep... 84 Figure 4.25 Structure for UL and DL sub-frames with deployed RSs, a) omnidirectional BS, b) the tri-sectored BS. ... 85 Figure 4.26 Areas of the coverage rings where a given value of physical throughput is
supported. ... 86 Figure 4.27 Correspondence between the physical throughput for rings J, J-1, J-2, …, and the minimum CNIRs of consecutive MCS that map to step distances dJ, dJ-1, dJ-2, …. ... 88 Figure 4.28 Comparison of the equivalent supported throughput between the cells with relays and the zoomed-out cells, K = 3. ... 91 Figure 4.29 Pixel database for the city of Covilhã terrain and buildings. ... 92 Figure 4.30 CNIR in the central cell (marked with the orange circle) comprising tri-sectored BSs and three RSs with RT. ... 93 Figure 4.31 Spatial variation of the throughput with tri-sectored BS antenna and the presence of relays with RT. ... 94 Figure 5.1 Cost and revenues with RSs (K = 3, omni. BS) for MByte R144[€/MByte] = 0.0025 and 0.005, in the DL. ... 103 Figure 5.2 Profit in percentage for R144[€/MB] = 0.0025 and 0.005, in the DL and K = 3, without
and with RSs (omnidirectional and trisectored BS antennas). ... 104 Figure 5.3 Profit in percentage for a price per MByte R144 = 0.0025 and 0.005, in the UL and K = 3, with RSs (omnidirectional and trisectored BS antennas for the latter). ... 104 Figure 5.4 Comparison of the economic performance between omnidirectional (three carriers) and tri-sectored (one carrier/sector) BSs in the presence of RSs and with the central BS coverage zoomed out (while RSs coverage zoom in to zero) under the same total BW, in the DL and K = 3. ... 106
xvii Figure 6.1 Carrier Aggregation, intra-band and inter-band aggregation alternatives (adapted
from [120]). ... 112
Figure 6.2 Carrier aggregation deployment scenarios (adapted from [118]). ... 113
Figure 6.3 Structure of a multi-component carrier LTE-A system (extracted from [121]). ... 115
Figure 6.4 Inter band carrier aggregation infrastructure sharing configuration and deployment scenario. ... 116
Figure 6.5 Comparison of the equivalent supported throughput between cells K = 1, 3 and 7 at 800 MHz. ... 123
Figure 6.6 Comparison of the equivalent supported throughput between cells K = 1, 3 and 7 at 2.6 GHz. ... 123
Figure 6.7 Area covered by each MCS index versus R for K = 3 at 800 MHz. ... 125
Figure 6.8 Area covered by each MCS index versus R for K = 3 at 2.6 GHz. ... 126
Figure 6.9 Topology considered for the inter and intra cell interference for an LTE network with K = 3. ... 127
Figure 6.10 Geometry for the interference received from neighbouring cells. ... 129
Figure 6.11 Average SINR [dB] as a function of the cell radius, in meters. ... 130
Figure 6.12 Normalized transmitter power in [dBW], as a function of the cell radius in [m] for V = 10 %. ... 131
Figure 6.13 3D representation of the cell SINR for both carriers. ... 132
Figure 6.14 3D representation of the cell CQI for both carriers. ... 132
Figure 6.15 3D representation of cell MCS for both carriers. ... 133
Figure 6.16 3D representation of the supported cell throughput for both carriers. ... 133
Figure 6.17 Difference between the 800 MHz and 2.6 GHz SINR and supported cell throughput. ... 134
Figure 6.18 3D representation of the supported cell throughput with CA. ... 134
Figure 6.19 Average cell PLR as function of the number of UEs for R = 1000 m. ... 136
Figure 6.20 Average cell PLR as function of the number of UEs. ... 137
Figure 6.21 Average cell delay as function of the number of UEs for R = 1000 m. ... 138
Figure 6.22 QoE as a function of the number of active UEs in the cell for R = 1000 m. ... 138
Figure 6.23 Average cell supported goodput as function of the number of UEs for R = 1000 m. ... 139
Figure 6.24 Average supported cell goodput with PLR ≤ 1 % as a function of cell radii. ... 140
Figure 6.25 Average supported cell goodput for QoE ≥ 2.5 as a function of cell radii. ... 140
Figure 6.26 3D representation of the geographic allocation of CCs for the GMBS. ... 141
Figure 6.27 3D representation of the geographic allocation of CCs for the EMBS. ... 141
Figure 6.28 3D representation of the geographic allocation of CCs for the GMBS. ... 142
xviii
Figure 6.30 Total cost and revenue for different cell radii, for R144[€/MByte] = 0.005 and
R144[€/MByte] = 0.10. ... 145 Figure 6.31 Profit in percentage as a function of the cell radius and PLR ≤ 1 %, R144[€/MByte] = 0.005. ... 145 Figure 6.32 Profit in percentage as a function of the cell radius and QoE ≥ 2.5, R144[€/MByte] = 0.005. ... 146 Figure 6.33 Profit in percentage as a function of the cell radius and PLR ≤ 1 %, R144[€/MByte] = 0.01. ... 146 Figure 6.34 Profit in percentage as a function of the cell radius and QoE ≥ 2.5, R144[€/MByte] = 0.01. ... 146 Figure A.1 Average power and interference (dBW) within a cell as a function of the inter-cell distance (m), PTx = 13 dBW. ... 164
xix
List of Tables
Table 1.1 Contributions to COST actions. ... 12
Table 1.2 Conference proceeding papers. ... 13
Table 1.3 Book chapters. ... 13
Table 1.4 Journal papers. ... 14
Table 2.1 Performance targets for audio and video applications (extracted from [49] and [50]). ... 31
Table 2.2 Performance targets for data applications (extracted from [49] and [50]). ... 31
Table 2.3 EU-MESH Requirements for Internet, conversational and streaming services [51]. . 32
Table 2.4 EU-MESH Requirements for interactive, multimedia and context-based services [51]. ... 33
Table 2.5 WiMAX Application Classes, extracted from [55]. ... 34
Table 2.6 Application mix ratio and subscriber distribution, extracted from [57]. ... 35
Table 2.7 Video Conference Traffic Model [55]. ... 37
Table 2.8 Overview of frame statistics of MPEG-4 traces [58]. ... 37
Table 2.9 Applications and services requirements. ... 39
Table 3.1 Sample of 20 results obtained during experimental gaming MOS trials. ... 46
Table 3.2 Sample of results obtained during the fitting of the experimental gaming MOS. ... 46
Table 3.3 Sample of results obtained during the fitting of the experimental video MOS ... 49
Table 3.4 Optimal model weighting T1, T2, T3 and T4 with the associated model correlations between objective timing and subjective MOS results (extracted from [84]) ... 51
Table 3.5 Variables to be replaced in the final equation, according to the selected application to compute the expected QoE. ... 57
Table 4.1 Values for the vertical asymptote without sub-channelization. ... 66
Table 4.2 Values for the vertical asymptote with sub-channelization. ... 70
Table 4.3 Transmitter/receiver parameters for the field trials setup. ... 79
Table 4.4 Spectrum analyser acquisition parameters. ... 80
Table 4.5 CNIRmin, physical throughput and AuxFactor for different values of the MCS ID for the communications to the SSs at the RS coverage zone. ... 83
Table 4.6 Parameters for the analysis of the system capacity. ... 83
Table 4.7 Parameters for the analysis of the system capacity. ... 92
xx
Table 4.9 Summary of the cellular planning results considering RT coverage in the
simulations. ... 94
Table 4.10 Summary of the planning results considering the DP model. ... 94
Table 5.1 Fixed WiMAX cost assumptions (extracted from [94]). ... 100
Table 5.2 Required spectrum bandwidth for different cell configurations and reuse patterns (extracted from [94]). ... 101
Table 5.3 Costs with relays with different antennas and K = 3 and K = 1 (three carriers for the omnidirectional and one carrier for the tri-sectored). ... 102
Table 5.4 Power consumption parameters for the BSs and RSs (extracted from [92]). ... 105
Table 6.1 CA bandwidth classes (extracted from [126]). ... 111
Table 6.2 LTE-A R10 CA configurations (extracted from [126]). ... 112
Table 6.3 Parameters and models used for 800 MHz and 2.6 GHz bands. ... 117
Table 6.4 Example of the allocation matrix over two frequency bands. ... 120
Table 6.5 Parameters for the analysis of the system capacity. ... 121
Table 6.6 Mapping of the SINR into throughput for a 5 MHz bandwidth. ... 122
Table 6.7 Values for the normalized transmitter power PTx[dBw] for the 800 MHz and 2.6 GHz bands. ... 131
Table 6.8 Simulation parameters. ... 135
xxi
List of Acronyms
2D Bi-dimensional space
3G Third Generation of Mobile Telecommunications Technology 3GPP 3rd Generation Partnership Project
ACIP Audio Contribution over IP AMR Adaptive Multi-Rate
ATBC Aggregated Transmission Bandwidth Configuration ATIS Alliance for Telecommunications Industry Solutions AWG Application Working Group
BER Bit Error Rate
BPSK Binary Phase Shift Keying BS Base Station BW Bandwidth C/I Carrier-to-Interference CA Carrier Aggregation CC Component Carrier CD Compact Disc
CNIR Carrier-to-Noise-Plus-Interference Ratio
COST European Cooperation in Science and Technology CP Cyclic Prefix
CRRM Common Radio Resource Management DL Downlink
DP Dominant Path DVD Digital Versatile Disc E-mail Electronic mail
EMBS Enhanced Multi-Band Scheduling eNB Evolved Node B
EU-MESH Enhanced, Ubiquitous, and Dependable Broadband Access using MESH Networks E-UTRA Evolved Universal Terrestrial Radio Access
Fax Facsimile
FCC Federal Communications Commission FDD Frequency Division Duplexing FER Frame Erasure Rate
FFA Free-For-All FP7
WG Seventh Framework Package Working Group fps Frames per second
FPS First Person Shooter
GAP General Assignment Problem GMBS General Multi-Band Scheduling GPS Global Positioning System
GSM Global System for Mobile/Groupe Spécial Mobile HD High Definition
xxii
HOL head of line
HSF Health Science Faculty HTML HyperText Markup Language
iCRRM integrated Common Radio Resource Management IEEE Institute of Electrical and Electronics Engineers IETF Internet Engineering Task Force
IGeoE Instituto Geográfico do Exército iLBC Internet Low Bitrate Codec IP Internet Protocol
IQ IneoQuest
ISO International Organization for Standardization
ITBS Transport Block Size index
ITU International Telecommunication Union ITU-T ITU Telecommunication Standardization Sector
K Reuse pattern LTE Long Term Evolution
MCS Modulation and Coding Scheme MH Mobile Hashing
M-LWDF Modified Largest Weighted Delay First MOS Mean Opinion Score
MP3 MPEG-2 Audio Layer III MPEG Moving Picture Experts Group MSE Mean Square Error
ODFM Orthogonal Frequency Division Multiplexing ODU Outdoor Data Unit
Ofcom Office of Communications P2P Peer-to-Peer
PC Personal Computer PDA Personal digital assistant
PESQ Perceptual Evaluation of Speech Quality PF Profit Function
PHY Physical PL path loss
PLR Packet Loss Ratio PRB Physical Resource Block
QAM Quadrature amplitude modulation QCIF Quarter Common Intermediate Format QoE Quality of Experience
QoS Quality of Service
QPSK Quadrature Phase Shift Keying
R Correlation coefficient
R2 Determination coefficient RA Resource Allocation RAN Radio Access Network RB Resource Block
xxiii RF Radio Frequency
RNC Radio Network Controllers RR Round Robin
RRHs Remote Radio Heads RRM Radio Resource Management RS Relay Station
RT Ray Tracing
RTT Round-Trip Time Measurement SD Small Definition
SINR Signal to Interference plus Noise Ratio SIP Session Initiation Protocol
SMS Short Message Service SS Subscriber Station STB Set-Top-Box
TBS Transport Block Size
TCP Transmission Control Protocol TDD Time Division Duplexing TTI Transmission Time Interval UE User Equipment
UL Uplink
UMTS Universal Mobile Telecommunication System VoIP Voice over Internet Protocol
VPN Virtual Private Network
WCDMA Wideband Code Division Multiple Access WiFi Wireless Fidelity
WiMAX Worldwide Interoperability for Microwave Access WMA Windows Media Audio
xxv
List of Symbols
(Rv)cov_zone revenue in a hexagonal-shaped coverage zone per year
Acell total affected cell area
Aow total integration area
BER (CQIb,u) DL average BER s for user u on band b
brate video bitrate
brf bandwidth
C Carrier
Cost cost per unit area
Cb cost per BS
Cbh cost for the normal backhaul
CBS cost of the BS
Cfi fixed term of the costs
CInst cost of the installation of the
CM&O cost of operation and maintenance
CQI channel quality indicator
CRS cost of the RS
d distance between SS and BS
D reuse distance
Dhb BS antenna height
DHOL head of line (HOL) packet delay
f frequency
fp integrand function
Fr Fraunhofer distance
GBS BS antenna gain for BS-to-SS and BS-to-RS communications
Gr receiver antenna gain
GRS RS antenna gain for RS-to-SS communications
GSS SS antenna gain for SS-to-BS communications
Gt transmitter antenna gain
I interference
Id delay impairments
Idd one-way mouth-to-ear delay impairments
Idle listener echo impairments
Idte talker echo impairments
Ie low bitrate codecs impairments
Is voice signal impairments
j jitter
K reuse pattern
Lbmax maximum normalised load that can be handled in band b
M interference-to-noise ratio
xxvi
Nf noise figure
Nhex number of hexagonal coverage zones per unit area
NRB_agg number of aggregated Resource Blocks
Nsec number of sectors
Nyear project lifetime
p ping
P profit
PBS BS power consumption
Pnh total interfering power coming from the neighbour cells
Pnoise thermal noise power
Pow power received from the own cell
PRS RS power consumption
Pt transmitter power
R radius
R(CQIb,u) DL throughput for user u on band b
Rasymptote vertical asymptote
Rb physical throughput
Rb-central throughput in the central zone
Rb-ch bit rate of the basic “channel”
Rb-RS-zone throughput in the RS zone
Rb-sup supported physical throughput
Rb-sup[kb/s] supported throughput per BS or sector
Rb-tot the total throughput in the multihop cell
rcc co-channel reuse factor
Rf rating factor
Ri i-th flow transmission rate
Ri(k) throughput achieved by the i-th flow during the k-th TTI
ri,j instantaneous available throughput (of the i-th flow in the j-th sub-channel)
Ro basic signal-to-noise ratio
RRb revenue of a channel with a throughput Rb[kbps]
Rv revenue per unit area per year
Rz−out zoomed out cell radius
Srate service bit rate
T talker echo delay
Ta one-way mouth-to-ear delay
Tbh equivalent duration of busy hours per day
Tr listener echo delay
Wb,u normalised metric for UE u is on band b
wi,j scheduler metric
wi,j,b multi-band scheduler metric
xxvii
α orthogonality factor
β adjustment coefficient for worst case SS position in the cell with relays
γ propagation exponent
δi maximum probability that DHOL,i exceeds the delay threshold of the i-th flow
μ expectation
ρ percentage of loss
σ standard deviation
τ delay
τi i-th flow packet delay threshold
φ1 take-off angle
1
Chapter 1
Motivation and approach
Motivation and approach
Motivation and approach
1.1
In nowadays wireless cellular networks, not only mobile services and applications are more and more used by consumers each year, leading to an expansion of mobile data traffic, but the pace at which it is growing is accelerating. According to [1], in 2013 mobile data traffic was nearly 18 times the size of the entire global Internet in 2000. One Exabyte of traffic traversed the global Internet in 2000, and in 2013 mobile networks carried nearly 18 Exabyte’s of traffic. In 2013 alone, 526 million mobile devices and connections were added, the global mobile data traffic grew 81 % and mobile video represented 53 % of all mobile traffic and by 2018 it will reach 69 %. Moreover, it is expected that mobile-connected devices will exceed the world’s population by 2014. Monthly mobile data traffic will reach 15.9 Exabyte’s by 2018 and between 2013 and 2018 the annual growth rate will be 61 %, i.e., mobile data traffic will increase nearly 11-fold between 2013 and 2018. These statistics show beyond the shadow of a doubt that wireless and cellular networks technologies need to be enhanced to support such demands. As so, the research performed in this Ph.D. thesis aims at contributing for the optimization and planning of cellular networks in a context of heterogeneous mobile networks and spectrum management.
The goal of cellular coverage is to provide access to mobile users in a given region, called cell while guaranteeing the quality of the received signal in both directions, uplink (UL) and downlink (DL), even for the users at the longest distance from the cell centre, i.e., at the cell edge. As resources, e.g., radio frequency channels, need to be reused in different geographical zones (but not in the closest proximity), the impact of interference among co-channel cells needs to be evaluated in both DL e UL directions. Furthermore, due to heavy interference in frequency reuse deployment, users at cell edge may suffer low connection quality.
Therefore, in the context of Interoperability for Microwave Access (WiMAX) and Long Term Evolution (LTE) cellular planning, research on the variation of the Carrier-to-Noise-plus-Interference Ratio (CNIR) with different system parameters is critical. As there are limitations in both links, UL and DL, techniques such as sub-channelization need to be applied to reduce the impact of the noise on the link performance. In the context of WiMAX, however, only mobile WiMAX will allow for sub-channelization in the DL while fixed WiMAX only allows for it in the UL and may cause a degradation of performance (mainly owing to the extra noise caused by the largest bandwidth).
2
In the optimization of cellular planning for next generation wireless networks, the use of Relay Stations (RSs) makes unnecessary a wire-line backhaul, improving the coverage and system capacity significantly. Moreover, the use of RSs with much lower hardware complexity provides the opportunity for cost and energy-efficient aware mobile radio networks. RSs can be switch-off during either the night period or the weekends, when the traffic load is low, providing energy saving, the coverage will then be sustained by the Base Station (BS) associated to the switch-off RSs. Mesh and RS networks may consider cell zooming as a cost-efficient way to achieve green cellular networks. While the BS coverage is zoomed out, RSs are able to work in sleep mode. This way, the air-conditioner and other energy consuming equipments can be switched off within the RS shelter. At these times of low traffic load, users may only be supported by the central zone cell by increasing the BS transmitter power and zooming out. Furthermore, antenna height and antenna tilt of BSs can also be adjusted for cells to zoom in or zoom out.
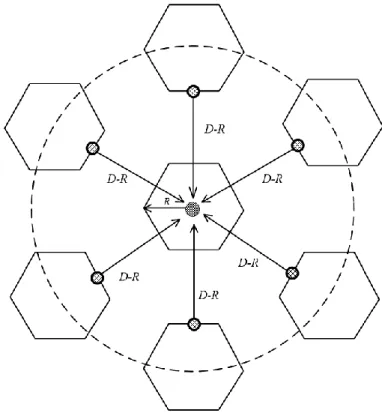
The presence of neighbouring cells, Subscriber Stations (SS), RSs and other networks increases the interference and noise levels. There are certain CNIR thresholds at the receiver and BS below which the service cannot be granted. Thus all the above aspects must be considered for an adequate radio and network planning, especially for the considered heterogeneous and cooperative mobile wireless networks. The main objective is to achieve the highest values for the carrier-to-Interference ratio, C/I, and, in turn, the maximum supported throughput, by using RSs for a given frequency reuse pattern, e.g., K = 3.
To optimize service usage and the management of radio resources, the characterization of the deployment of scenarios, as well as, services and applications requirements must also be addressed. The characterization in terms of quality of service and experience is performed to provide the key features of wireless ubiquitous network applications. As such, the main recommendations from such entities as the International Telecommunication Union Telecommunication Standardization Sector (ITU-T), 3rd Generation
Partnership Project (3GPP) and key elements proposed by a major European project, i.e. EU-MESH, are considered. Moreover, detailed video and voice encoding application requirements presented by the WiMAX Forum are also assumed. Besides, rather than developing new and distinct sets of deployment scenarios it is expected that, for a better iteration and perhaps cooperation with the remaining international scientific community, one should rather assume EU-MESH’s scenario characterization. In addition, the main key parameters impacting user’s quality should be identified and their performance targets for audio, video and data applications must also be considered. This works involves updating the current state of application requirements. For this purpose, one addresses the recommendations from the ITU-T, 3GPP, WiMAX Forum and EU-MESH. This task is required for a deeper understanding, evaluation and optimization of wireless networks system performance.
Furthermore, with the increased competition between network and service providers, improving the quality of the offered services as perceived by users, commonly referred to as Quality of Experience (QoE), becomes very important as well. This constitutes a significant
3 challenge to service providers who aim to minimize the customer churn while maintaining their competitive edge [2]. Thus, it is very important for operators to accurately measure and improve the users Quality of Service (QoS) and experience. QoS parameters are the most accessible and measurable metrics to assess the overall performance of the network in real time. Nonetheless, QoS measurements are generally defined in terms of network delivery capacity and resource availability but not in terms of the satisfaction to the end-user. In this context, a unified model for the mapping between QoS and QoE will be proposed for different types of services and applications. Hence, values for QoS metrics gathered from various parts of the network must be mapped onto QoE targets. Mean Opinion Score (MOS) experimental results have been widely used and considered one of the most accurate approaches to attain the user’s subjective quality assessment. Therefore, the mapping is obtained by means of fitting MOS measurements, which are in turn validated by using the Mean Square Error (MSE) and the coefficients of correlation and determination, R and R2. The novelty of this approach is to introduce a unified model that provides network and service providers a framework to evaluate user’s satisfaction for multimedia applications, i.e., gaming, video, web-browsing and audio.
In nowadays heterogeneous wireless networks topologies the scarce wireless spectrum can be much better utilized [3]. Besides, in the near future, communication systems are anticipated to become pervasive with demands for higher data rates. To accommodate the increased demand for communication bandwidth, the concept of Carrier Aggregation (CA) is introduced by 3GPP in LTE-Advanced (LTE-A). The easiest way to implement CA would be to use contiguous component carriers within the same operating frequency band. However, large portions of continuous spectrum are not often available. Therefore, aggregating smaller bandwidths is another interesting solution to increase data rate. Hence, while considering the available bandwidths and frequency bands in Portugal CA will be addressed in this thesis. On the one hand, CA will enable superior data rates. On the other, it will also provide interference reduction, efficient spectrum use and quantitative quality of service improvement. Moreover, in the context of CA, Radio Resource Management (RRM) plays a key role in wireless system design and involves procedures as power control, cell search, cell reselection, handover, radio link or connection monitoring, connection establishment and re-establishment. Another fundamental element in resource management is scheduling, which prioritizes packets that are ready for transmission. Based on the scheduling algorithm, as well as the traffic characteristics of the multiplexed flows, certain QoS levels can be achieved. Common Radio Resource Management (CRRM) is a class of radio resource management functionality that refer to the set of functions that are devoted to ensure an efficient and coordinated use of the available radio resources in heterogeneous networks scenarios. More specifically, CRRM strategies should ensure that the operator’s goals in coverage, resource reuse and QoS are met while providing as high as possible overall capacity (i.e. the sum of the capacities achieved in every single Radio Access Network, RAN). It is also worthwhile to note that, within CRRM, load balancing has become a relevant concern in design.
4
Main objectives
1.2
The research activities addressed in this thesis aim at contributing to the evolution and optimization of wireless radio and network planning, in a context of multiple heterogeneous and cooperative wireless networks, within a combination of architectures, i.e., cellular topologies in the presence or absence of RSs. The mobile multi-hop relay technology extends the service area of mobile networks and also improves the transmission quality. Such proliferation of architectures should allow for an enhancement of coverage and system capacity. This thesis addresses the planning and radio resource management optimization of fixed WiMAX with RSs in real environments and the challenge of modelling the propagation for hilly rural areas at 3.5 GHz.
The emerging trend towards energy-efficient network operation shifts the focus from system optimization to the energy consumption of the wireless access network infrastructure, which has triggered activities in standardization and regulatory bodies, such as 3GPP, ITU and ATIS [4]. One technology enabling cost-efficient green cellular networks is cell zooming. It allows adjusting the cell size according to the traffic conditions and has the potential to balance the traffic load and reduce the energy consumption, by decreasing the transmitting power to reduce cell coverage (zoom in) [5]. Additionally, multi-hop relays with lower hardware complexity, power consumption and cost, can also be used to optimise network planning (enhancing coverage) and reduce energy consumption [6]. The use of RSs allied to cell zooming can enable the design of cost-efficient and green wireless systems.
For commercial and technical reasons [7], it is critical for network operators and service providers to be able to assess, predict and possibly control their user’s perceptual multimedia (e.g., voice and video) quality. The first step to reach this goal is to fully characterize and define deployment scenarios, as well as, services and applications requirements for wireless heterogeneous multi-hop networks. In this context, the ITU-T, 3GPP, WiMAX Forum and EU-MESH recommendations are merged and updated to address nowadays wireless networks requirements. The second step is enabling operators and service provider to evaluate the user’s QoE according to the network state (QoS parameters). Moreover, several works have been performed on the characterization of the QoE as a function of the QoS [2], [8] and [9]. However, they only consider one QoS parameter for each application. In the framework of this thesis, a unified model for the mapping between QoS and QoE is proposed. This model considers key parameters that impact user’s experience for several multimedia applications. One of the most accurate approaches to evaluate QoE is the subjective quality assessment, since the best indicator of personal quality is the one given by a human being. Therefore, QoE data should succeed where possible in combining both user experience and technical measures, for example, to provide an equation for the user experience when using a particular service with known levels of QoS [10]. The objective is to provide the network and service providers with the means to assess the contribution of the
5 network performance to the overall level of user’s satisfaction. This mechanism allows building an effective QoE control mechanism onto measurable QoS parameters.
There is growing interest in LTE-A CA implementation. Not only it allows for superior data rates but, CA importance lays in its potential to allow real-time optimization of spectral resources and radically change spectrum management by better exploiting (aggregating) small portions of radio spectrum that would be unusable otherwise. As so, another objective of this thesis is to address CA application to answer to the increased demand for communication bandwidth, as well as, enhance wireless networks capacity, i.e., QoS and QoE. In the framework of the Portuguese scenario, e.g., available bandwidths and radio frequency bands, multi-band scheduling algorithms will be proposed to optimize average cellular capacity, service performance and user’s perceived quality. Besides, CA’s cost/revenue trade-off, from the operator/service provider point of view will also be addressed.
The main goals of the research from this thesis can be summarized as the follows:
Deployment scenarios and characterization parameters for concatenated ubiquitous wireless mesh network applications:
o Definition of deployment scenarios;
o Definition of key parameters impacting users; o Definition of services and applications requirements.
Unified model for the mapping between the QoS and QoE in multimedia applications: o Sub-model for gaming applications;
o Sub-model for video applications;
o Sub-model for web-browsing applications; o Sub-model for audio applications;
o Unified model for the mapping between QoS and QoE.
Planning and optimization of fixed WiMAX networks with relays:
o Formulation of the signal-to-noise-plus-interference ratio in the presence and absence of RSs;
o System capacity;
o Supported cell/sector physical throughput;
o Measurement-based propagation modelling for hilly rural areas at 3.5 GHz; o Cellular planning in actual environments, hilly rural areas.
Energy saving and cost-revenue analyses through relay sleep modes and cell zooming: o Models for cost/revenue optimization;
o Economic and environmental impact of cell zooming and RSs deployment.
Carrier Aggregation for wireless networks capacity enhancement: o Definition of the LTE scenario within two non-continuous bands; o Multi-band scheduling for carrier aggregation;
o Average cell SINR analysis
o Transmitter power normalization over 800 MHz and 2.6 GHz frequency bands; o QoS, QoE and cost/revenue improvement through carrier aggregation.
6
Additionally, the work presented in this thesis is a significant part of different research European frameworks, such as the European Cooperation in Science and Technology (COST), namely COST 2100 [11], COST IC1004 [12] and COST IC0905 “TERRA” [13]. Moreover, contributions on the deployment scenarios and characterization parameters for concatenated ubiquitous wireless mesh networks applications and the unified model between QoS parameters and QoE addressed in this thesis have been developed in the context of the Portuguese project Ubiquimesh [14] and Opportunistic-CR [15]. The planning and optimization of fixed WiMAX networks with relays, energy saving aspects and cost-revenue analysis, and the common radio resource management for spectrum aggregation were developed within the framework of Planopti (Marie Curie Reintegration Grant) [16], Opportunistic-CR and CREaTION [17]. The main contributions and dissemination achieved within the scope of this thesis will be detailed in a later section.
Cellular Network Planning and Optimization
1.3
The network planning process itself is not standard for all mobile communication technologies, even though some of the steps may be common. In this thesis, the planning and optimization approach shares some key points with the network planning process from [18]. The network planning project organisation is based on the network planning roll-out process steps. The final target of the roll-out process is to deliver a new network for the operator according to the agreed requirements and applies both for individual BSs as well as for the whole network. The network planning project organisation is pictured according to the process flow from Figure 1.1.
7 In this, thesis the goal is not to plan an end-to-end network, some parts of the above project organization will not be addressed, e.g., activities directly linked to the network operator (site acquisition team, construction team and telecom implementation team). Therefore, the main steps from the network planning process proposed by [18] will instead be considered, shown in Figure 1.2.
Figure 1.2 Network planning process steps (extracted from [18]).
The radio network planning process is divided into five main steps, from which four are typically performed before the network launch, i.e., pre-planning, planning, detailed planning, verification acceptance. Finally, the optimization is usually addressed after the network has been launched. After the detailed planning step, the network is ready for commercial launch, but the post-planning phase continues the process and targets the most optimal network configuration. Actually, the network planning process is a never ending cycle due to changes in the design parameters [18].
The input for the pre-planning phase is the network planning criteria. Its main activity is dimensioning, which gives the initial network configuration as a result. The first step in the planning phase is nominal planning; it provides the first site locations in the map based on input from the dimensioning phase. The process continues with more detailed coverage planning after site hunting and transmission planning and also includes capacity planning. Detailed planning covers frequency, neighbour and parameter planning. After the detailed planning the network is ready for verification and acceptance, which finishes the pre-launch activities. After the launch the activities continue with optimization. As mentioned earlier, some of these steps, such as site hunting, will not be considered; they are beyond the scope of this thesis. Furthermore in the context of the site location, i.e., the BS location considered in this work for propagation analysis was not optimized by the dimensioning phase, but rather by the limitations of the University estate and approval constraints to install the WiMAX equipment, shown in Chapter 4.
1.3.1.
Pre-planning
Before the actual network planning is started, the pre-planning phase covers the assignments and preparation. As in any other field of business it is an advantage to be aware of the current market situation and competitors. The network planning criteria is considered
8
as an input for network dimensioning. Some of the basic inputs for dimensioning are the following ones [18]:
Coverage requirements, the signal level with the coverage probabilities;
Quality requirements;
Frequency spectrum;
Services and applications.
1.3.2.
Planning
The planning phase takes the inputs from the pre-planning dimensioning. This is the basis for nominal planning, which means radio network coverage and capacity planning. The goal of the coverage planning phase is to find the optimal BSs locations. In the capacity planning phase the network capacity is allocated by combining the final coverage plan with the user density information. The detailed coverage maps for the planned area, the final site locations and the capacity plans are the outputs of the planning phase.
1.3.3.
Detailed planning
Once the site location and configurations are known the detailed planning can be started. It includes frequency, adjacency and parameter planning. According to [18], planning tools are usually used in this step, as they have specific algorithms for automatic frequency planning. The tools use interference calculation algorithms aiming to minimise the co-channel and adjacent channel interference, in context of this thesis the WinpropTM tool was used.
Frequency planning is a critical phase in network planning, since the number of frequencies is limited and the best possible solution must be found. Neighbour planning is usually performed with a coverage planning tool using the frequency plan information. The basic rule is to consider the neighbouring cells from the first tier of the surrounding BS [18].
1.3.4.
Verification and Acceptance
The verification and acceptance is performed once the planning phase has been finished and aims to ensure optimal operation of the network. Besides fine-tuning, a verification of possible errors that might have occurred during the installation is performed. The targets to be met for network acceptance are specified by the key performance indicators found during the pre-planning phase. This radio network planning process step is not fully addressed in this thesis as no real network installation is performed, however the key performance parameters (QoS) are defined in Chapter 2 and used to evaluate the multi-band schedulers proposed in Chapter 6.
1.3.5.
Optimization
Radio and network planning and optimization are a continuous process that does not end after the network has been launched. The optimization inputs are all available network
9 information and status. The network statistic figures, alarms and traffic itself are monitored carefully. Customer observations and opinions are also taken into account by the network optimization team. To detect and analyse potential problems at a given location, the optimization process includes both network level measurements and field test measurements. Besides, it is worth noting that, among other methodologies, like drive testing, the authors from [18] also refer MOS as a practice to measures human beings perception during the optimization process, as addressed in Chapter 3.
1.3.6.
Network Coverage and Capacity Enhancement Methods
The performance of a mobile network can be seen from several perspectives:
Capacity - Each operator owns a limited frequency band which is shared by an increasing number of network users;
Quality - It is measured by metrics such as the carrier-to-interferer ratio (C/I);
Coverage - Service continuity is tremendously important in a cellular network;
Cost - Technical requirement to achieve the best quality perception from the subscriber side should be balanced with costs;
New services - Operators cannot differentiate and gain new customers if they do not offer enhanced data services on top of high data rate technologies;
Complexity and flexibility - Two very important criteria from an operation of the network point of view make it easy for maintenance teams to maintain the network. All these aspects are related among them and are interdependent. Commonly, network design transits mainly through the path shown in Figure 1.3.
Figure 1.3 Network performance constraint evolution path (extracted from [18]).
At the first roll-out stage, the most important thing is to provide coverage. Then, when the number of subscribers starts to increase and generate more traffic, capacity becomes the main issue for the operator. When a certain maturity in terms of subscriber behaviour, coverage and capacity levels is reached for the network, the operator should improve the end user’s perceived quality. To achieve the best trade-offs, especially between quality and costs, the operator tries to make use of several coverage and capacity enhancement methods [18]. In this context, the research throughout this thesis proposes methods such as RSs, cell zooming and CA for coverage and cellular capacity improvement.
Radio resource management (RRM) plays an important role in the optimization LTE-A with CA, due to the scheduling algorithm which decides among packets that are ready for transmission. Based on the scheduling algorithm which allocates Component Carriers’ (CCs) resource blocks to users, as well as the traffic characteristics of the multiplexed flows, the
10
optimization of radio and network planning is tuned, and certain QoS requirements can be achieved. Common RRM (CRRM) refers to the set of functions that are devoted to ensure an efficient and coordinated use of the available radio resources in heterogeneous networks scenarios. A non-contiguous CA (from an upper layer point of view) and an integrated CRRM (iCRRM) entity for multiband scheduling are proposed in the framework of this thesis, where CA and CRRM functionalities are handled simultaneously in an LTE-A scenario. The proposed resource allocation (RA) assigns the user packets to the available radio resources, i.e., CCs, in order to satisfy user requirements based on integer programming optimization, or even suitability based optimization, and ensures efficient packet transport to maximize spectral efficiency.
Figure 1.4 Radio and network planning optimization.
Contributions
1.4
The contributions given in this work were originates from (and financed through research grants) the Portuguese projects: Cross-Layer Optimization in Multiple Mesh Ubiquitous Networks (Ubiquimesh) [14], Opportunistic Aggregation of Spectrum and Cognitive Radios: Consequences on Public Policies (Opportunistic-CR) [15] and Cognitive Radio Transceiver Design for Energy Efficient Data Transmission (CREaTION) [17].
Besides, the research presented in this thesis has been addressed within the scope of the research European framework, Planning and Optimization for the Coexistence of Mobile and Wireless Networks Towards Long Term Evolution (PLANOPTI), Marie Curie European Reintegration Grant [16], as well as, cooperation in the field of Scientific and Technical Cooperation (COST), namely COST2100 (Pervasive Mobile Ambient Wireless Communications) [11], COST IC1004 (Cooperative Radio Communications for Green Smart Environments) [12] and COST IC0905 "TERRA" (Techno-Economic Regulatory Framework for Radio Spectrum Access for Cognitive Radio/Software Defined Radio) [13].
The research conducted in the framework of the aforementioned projects has been of particular importance for this thesis and has already been disseminated in published papers, accepted for publication or submitted to conferences proceedings, journals or book chapters.
11 The characterization of applications and deployment scenarios for ubiquitous concatenated multiple mesh networks was addressed in the Ubiquimesh project framework. The proposed requirements for services and applications were defined upon the analysis and update of current ITU-T, 3GPP and EU-MESH European project recommendations. This proposal accounts for the parameters that most impact the user’s service quality and defines performance targets for each of those parameters according to the application type. This work was addressed in a technical report [19], the conference proceeding paper [20] and two COST actions communications, [21] and [22].
The model for the mapping between the QoS and experience for multimedia applications was developed within the Ubiquimesh project scope. This work proposes a function that characterizes the relation between a set of QoS parameters gathered within the wireless network and the corresponding QoE, which provides network and service providers a framework to evaluate user’s satisfaction for gaming, video, audio a web-browsing applications. This research was addressed in a technical report [23] and conference proceedings [20] and [24].
The research conducted on the planning and optimization of fixed WiMAX networks in the presence and absence of relays was performed in the context of PLANOPTI. This work introduces cell zooming and advanced DL and UL frame structures for cellular networks with relays as key enabling technologies for capacity performance. Besides PLANOPTI, Opportunistic-CR’s scope of research also included the cost/revenue trade-off and energy waste consumption reduction of the capacity performance technologies mentioned above. Within the scope of both projects field trials for the experimental characterisation of WiMAX propagation in different environments was addressed. This research activities resulted into the publication of three book chapters [25], [26] and [27], three journal papers [28], [29], [30], six conference proceeding papers [31], [32], [33], [34], [35], [36], two COST 2100 [37] and [38], and one COST IC 1004 [39] communications, and one journal paper submission [40].
Contributions given within Opportunistic-CR framework also include the transmitted power formulation for the optimization of carrier aggregation (CA) in LTE-Advanced (LTE-A) networks. This proposal accounts for a formulation to compute the transmitter power needed to cover cells of different sizes whilst maintaining the average signal to interference-plus-noise ratio (SINR) constant, and near the maximum. As such, small cell radii require lower transmitter power than their counterparts with larger radii to achieve similar average cell SINR and coverage. This research was published in conference proceeding [41], two COST communications [42] and [43], and submitted to a journal paper [47].
The proposal for an integrated CRRM entity that implements multi-band scheduling functionalities in the context of inter-band CA was addressed in the scope of the CREaTION project. The aim of the iCRRM entity is to satisfy user’s QoS and QoE requirements, as well as, improve spectral efficiency through optimized inter-band scheduling. The iCRRM performance is evaluated in terms of packet loss ratio, delay, QoE, goodput (application level throughput) and a cost/revenue analysis. This research has been published in a conference
12
proceeding paper [44], two COST action communications [45] and [46], and is part of the work accepted for journal paper publication with minor revisions in [47], and submitted to a journal paper in [48].
A list of the publications organized chronologically and by type is given in the following tables. Table 1.1 addresses the contributions given to COST actions. Table 1.2 presents the conference proceedings paper. Table 1.3 presents the published book chapters. Finally, Table 1.4 shows journal papers.
Table 1.1 Contributions to COST actions. Year Title
2010 Marina Barbiroli, Claudia Carciofi, Vitorio Esposti, Franco Fuschini, Paolo. Grazioso, Doriana Guiducci, Daniel Robalo, Velez, F. J., "Characterization of WiMAX Propagation in Microcellular and Picocellular Environments”, 11th Meeting of the Management Committee of COST2100 - Pervasive Mobile & Ambient Wireless Communications, TD(10)11007, Denmark, Aalborg, June 2010.
2010 Daniel Robalo, Valeria Petrini, João Oliveira, Fernando J. Velez, Marina Barbiroli, Claudia Carciofi, Paolo Grazioso, Franco Fuschini, “Experimental characterisation of WiMAX propagation in different environments”, 12th Meeting of the Management Committee of COST2100 – Pervasive Mobile & Ambient Wireless Communications, TD(10)12030, Bologna, Italy, Nov. 2010.
2011 Daniel Robalo, Fernando J. Velez, “Characterization of Parameters for Wireless Networks Services and Applications”, 3rd Meeting of the Management Committee of COST TERRA- Techno-Economic Regulatory Framework for Radio Spectrum Access for Cognitive Radio Software Defined Radio, WG1, Brussels, Belgium, June 2011.
2012 Fernando J. Velez, João Oliveira and Daniel Robalo, Oliver Holland and Hamid Aghvami, “Energy Saving in the Optimization of the Planning of Fixed WiMAX with Relays in Hilly Terrains: Impact of Sleep Modes and Cell Zooming”, 5th Meeting of the Management Committee of COST IC 1004 - Cooperative Radio Communications for Green Smart Environments, TD(12)05025, Bristol, UK, Sep. 2012.
2012 Jessica Acevedo, Daniel Robalo and Fernando J. Velez, “Transmitted Power Formulation for the Implementation of Spectrum Aggregation in LTE-Advanced over 800 MHz and 2 GHz Frequency Bands”, 6th Meeting of the Management Committee of COST TERRATechno- Economic Regulatory Framework for Radio Spectrum Access for Cognitive Radio Software Defined Radio, WG2, Brussels, Belgium, Nov,. 2012.
2013 Daniel Robalo and Fernando J. Velez, “Wireless Networks Services and Applications Parameters Characterization and Model for the mapping between the Quality of Service and Experience for multimedia applications”, 8th Meeting of the Management Committee of COST IC 1004 - Cooperative Radio Communications for Green Smart Environments, TD(13)08069, Ghent, Belgium, Sep. 2013.
2013 Jessica Acevedo, Daniel Robalo and Fernando J Velez, “Cost/Revenue Performance of LTE Employing Spectrum Aggregation with Multi-Band User Allocation over Two Frequency Bands”,.8th Meeting of the Management Committee of COST TERRA- Techno-Economic Regulatory Framework for Radio Spectrum Access for Cognitive Radio Software Defined Radio, WG2, Biel, Switzerland, Nov. 2013.
2014 Jessica Acevedo Flores, Daniel Robalo, Fernando J. Velez, “Transmitted Power Formulation for the Implementation of Spectrum Aggregation4in LTE-A over 800 MHz and 2 GHz Frequency Bands”, 9th Meeting of the Management Committee of COST IC 1004 - Cooperative Radio Communications for Green Smart Environments, TD(13)09079, Ferrara, Italy, Feb. 2014.
2014 Jessica Acevedo Flores, Fernando J. Velez, Orlando Cabral, Daniel Robalo, Oliver Holland, Hamid Aghvami, Filippo Meucci, Albena Mihovska, Neeli R. Prasad and Ramjee Prasad, “Cost/Revenue Performance in an IMT-Advanced Scenario with Spectrum Aggregation Over Non-Contiguous Frequency Bands”, 9th Meeting of the Management Committee of COST IC 1004 - Cooperative Radio Communications for Green Smart Environments, TD(13)09080, Ferrara, Italy, Feb. 2014.

![Figure 4.1 Co-channel interference in the worst-case for the DL (extracted from [94])](https://thumb-eu.123doks.com/thumbv2/123dok_br/18880954.932501/88.892.275.656.631.1051/figure-channel-interference-worst-case-dl-extracted.webp)


![Table 4.4 also presents the repeatability for a given number of samples [100]](https://thumb-eu.123doks.com/thumbv2/123dok_br/18880954.932501/108.892.165.775.697.1067/table-presents-repeatability-given-number-samples.webp)