ASSOCIAÇÃO DE POLITÉCNICOS DO NORTE
(APNOR)
INSTITUTO POLITÉCNICO DE BRAGANÇA
“Production Optimization Using Discrete Simulation”
Dmitrii Kharin
Final Dissertation submitted to
Instituto Politécnico de Bragança
To obtain the Master Degree in Management, Specialisation in Business
Management
Supervisors:
António J.S.T. Duarte
Tatiana Khvatova
ASSOCIAÇÃO DE POLITÉCNICOS DO NORTE
(APNOR)
INSTITUTO POLITÉCNICO DE BRAGANÇA
“Production Optimization Using Discrete Simulation”
Dmitrii Kharin
Supervisors:
António J.S.T. Duarte
Tatiana Khvatova
Abstract
Production and manufacturing setups involving lean solutions and customer driven “pull” logic (e.g.
kanban systems) are more and more common. Usually, these systems allow companies to increase
efficiency, quality levels, work force motivation and general productivity. Although these systems are
not too difficult to plan and operate, in complex situations, even small adjustments can produce some
unforeseen effects.
In this scenario, discrete simulation can provide the tools to model the underlying systems and test
the desired changes before implementation.
In this work we modelled typical pull production systems with more or less complexity using a
commercial discrete simulation software (SIMIO). Once the modelling phase was completed,
different adjustments in the number of Kanban cards in the system were tested and evaluated, in
order to optimize the system.
Also, the final simulation model was built generic enough to be used in classroom environment to
familiarize students with pull production concepts.
Resumo
As configurações de produção e fabricação envolvendo soluções lean e a lógica pull orientada ao
cliente (por exemplo, sistemas kanban) são cada vez mais comuns. Normalmente, estes sistemas
permitem que as empresas aumentem a eficiência, os níveis de qualidade, a motivação da força de
trabalho e a produtividade geral. Embora esses sistemas não sejam muito difíceis de planear e
operar, em situações complexas, mesmo pequenos ajustes podem produzir alguns efeitos
imprevistos.
Nesse cenário, a simulação discreta pode fornecer as ferramentas para modelar os sistemas
subjacentes e testar as alterações desejadas antes da implementação.
Neste trabalho modelamos sistemas típicos de produção puxada com maior ou menor complexidade
usando um software comercial para simulação discreta (SIMIO). Uma vez concluída a fase de
modelação, foram testados e avaliados diferentes ajustes no número de cartões kanban no sistema,
a fim de otimizar o sistema.
Além disso, o modelo de simulação final foi construído de forma suficientemente genérica para ser
usado em ambiente de sala de aula para familiarizar os alunos com conceitos de produção puxada
(pull).
Аннотация
Организация производства и технологическая наладка с применением концепций
«бережливого» и «вытягивающего» производства, ориентированных на нужды потребителя
(например, система канбан) получают все более широкое распространение. Обычно, данные
системы позволяют компаниям повышать эффективность, уровень качества, мотивацию
сотрудников и производительность в целом. И хотя реализация данных подходов не является
слишком трудоемкой, в сложных ситуациях даже малейшие корректировки могут привести к
непредвиденным последствиям.
В таком случае, дискретное моделирование может предоставить инструменты для создания
базовых моделей и их тестирования, до внесения изменений в реальную систему.
В данной работе было смоделировано типичное, более-менее сложное вытягивающее
производство с применением коммерческого программного средства дискретного
имитационного моделирования (SIMIO). После создания симуляции было протестировано и
оценено использование разного количества канбан карт в системе с целью ее оптимизации.
Также, финальная симуляция была создана достаточно общей, чтобы ее можно было
использовать во время аудиторных занятий для ознакомления студентов с концепцией
вытягивающего производства.
Table of Contents
List of Figures ... vii
List of Tables ... viii
Introduction ... 9
1. Literature Review ... 10
1.1. Simulation Applications ... 10
1.2. Simio ... 21
1.3. Arena ... 22
1.4. Kanban ... 24
2. Methodology ... 28
3. Computational Implementation ... 31
3.1. Simple Model ... 31
3.2. Complex Simulation Model ... 34
3.3. Experiments: An Example ... 36
3.3.1. Settings ... 36
3.3.2. Results ... 37
Conclusion ... 41
List of Figures
Figure 1. Simple model example... 32
Figure 2. Kanban block. ... 33
Figure 3. Results tab in Simio. ... 34
Figure 4. Complex simulation model. ... 35
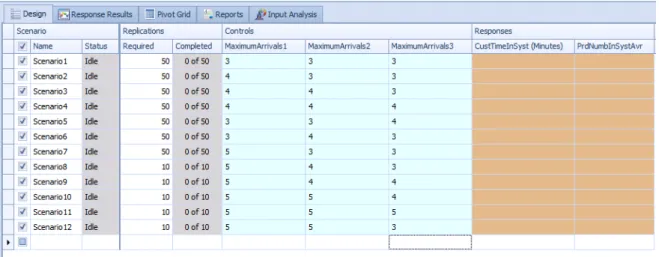
Figure 5. Experiment settings. ... 37
Figure 6. Results 1. ... 39
Figure 7. Results 2. ... 39
List of Tables
Table 1. Differences between push and pull systems. ... 26
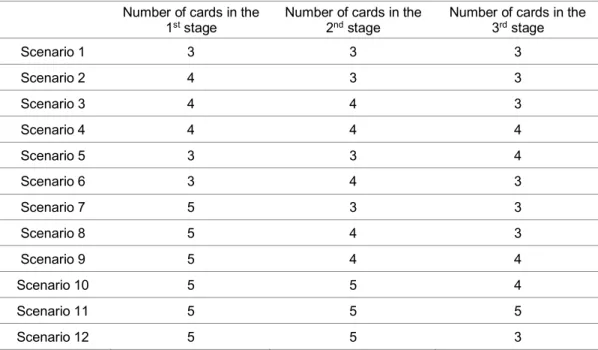
Table 2. Experiment scenarios. ... 36
Introduction
To complete the most global view of possible outcomes must be calculated a significant amount of
information and designed rather detailed simulation model. While modern computer facilities allow
calculating very complex simulation models, there is no need to simplify them to analytical solution
capability. Computers make it possible to solve complex mathematical tasks; the tasks can be
multivariate; in the process of solving it is possible to change parameters and to analyze the results.
Modeling helps to illustrate the objective in 2D and 3D, to see personally what is planned.
With the help of computer modeling, it is possible to make a qualitative and quantitative process
assessment, to calculate the possible results. But modeling is first of all an instrument to find the
most optimal solution. Basing on the model results it can be optimized, improved, the idea can be
corrected. That is the final goal of “creative” process for the implementation a new idea.
The motivation for this work was the implementation of a production environment using the pull
approach to production control, using the Kanban system. The simulation developed are a proof of
concept on the topic and can also be used to familiarize students or factory staff with the pull
approach and Kanban.
This work is divided into 3 parts. The first chapter is dedicated to simulation applications, Simio and
Arena software and kanban cards system. At first, it is described, what means the simulation, its
sphere of approach, and advantages of simulations use. Following is a description of Simio software.
There are mentioned the history of the software, its description, interface describing and the
advantages and benefits. Next are discussed the Simio’s competing software Arena. There also are
mentioned its background, description, and differences from the Simio software. In the end, the first
chapter emphasizes kanban cards system. It is described the concept itself, history of development,
sphere of application. Also, are mentioned differences from similar systems and finally advantages
and disadvantages of kanban system.
The second chapter covers the methodology of the research.
In the third chapter are presented models of kanban system in the Simio software. There is a simple
model, which represents a single stage kanban system as a proof of concept. It is described the
structure of the given simulation, how it is used. Following is a complex simulation model example,
its description and idea. The chapter then refers to the experiment, which allows to understand the
benefit of kanban system in context. There will be described possible scenarios, how they can be
1.
Literature Review
The first chapter of this work addresses:
• Simulation applications. Its meaning, sphere of approach, and advantages of simulations use;
• Simio Simulation and Scheduling Software. The story of its creation, description of program’s features and interface, its application, advantages and disadvantages, comparison with
competitors;
• Arena Simulation Software. Description and story of creation, advantages and
disadvantages, comparison with Simio;
• Kanban approach. The system description, history, field of application, advantages and disadvantages, ways of application and types.
1.1.
Simulation Applications
Discrete simulation is one of the most promising modeling methodologies, which is implemented
through the simulation software (Vaitechovich, & Franzeskevich, 2014). It allows analysing difficult
production systems, to optimize material and financial resources management and to predict the
system development dynamic. At present there is an active development of object-oriented visual
tools, modern PCs become highly productive, possessing powerful system and application software.
This contributes to an effective interaction of human and computer. A simulation model is a special
software, which allows imitating an activity of an object (Shannon, 1975). In addition, the simulation
also implies the maintaining of the process’s logical framework and sequence of events (Pedgen,
Sadowski, & Shannon, 1995). The simulation model should present a big number of parameters, a
structure, continuity, and patterns of modeling object’s behavior. A model gives detailed statistics on
the performance of a simulated system (Shelemeteva, & Guseva, 2016).
• Simulation of business processes;
• Simulation of manufacturing systems;
• Warehouse logistic;
• Integrated processes management on the base of simulation software;
• Supply chain management;
• Digital production.
A simulation model, unlike traditional CASE (computer-aided software engineering) tools giving static
images of business processes, is capable:
• To show the process in time development;
• To find out and to demonstrate latent tendencies;
• To give an opportunity to analyze the impact of decisions;
• To assess the influence of various accidental factors and a price risk;
• To make an extended ABC analysis (Selective Inventory Control).
The simulation concept becomes more popular as for tactical objectives of business analysis, so for
the strategical planning of managerial situations.
Simulation modeling increases the opportunities for traditional CASE tools and provides:
• Business processes visualization and analysis of weaknesses;
• Ability to collect and to analyze business processes efficiency indicators (time-cost);
• ABC analysis pegged to real-time processes;
• Reengineering implementation, comparison on quantitative indicators of variants “AS-IS” and “TO-BE”;
• Business processes optimization using advanced genetic algorithms.
Simulation models are always dynamic. It allows analysing the business process behavior as a
developing process at a certain trajectory over a modeling period time. This permits to predict the
future states, progress trends taking into account environmental factors under conditions of
uncertainty.
In industrial production simulation modeling is used widely, then in other spheres. There are many
reasons for:
• Modern computing production systems and equipment are very expensive and complex,
requiring the analysis through modeling;
• An animation visualizing the process flow, and an information derived from simulation model
contribute to a better understanding of the ongoing processes and of the consequences of
decisions.
The main opportunity for applying the simulation software is the understanding local changes
influences on the scale of entire production framework. If there is a change at some working station,
the influence on this working station will be quite predictable but it is rather difficult to predict how it
Simulation modeling is used for analysis, planning, and optimization of production systems. It
provides an opportunity to asses and to compare a large number of alternative production scenarios.
Discrete systems are production systems where processes and handling are performed on several
parts, semi-finished products, etc. May be considered production processes related both to the
production of piece-goods and flow line production. Discrete simulation is used to solve different
tasks on the strategic, tactic and operational level. In strategic planning, it is to face tasks in cases
of creation of new or modernization of an old production. The main goal is to evaluate the functioning
of the production system and to calculate the main production indicators. According to results is
taken a decision about:
• Types and quantity of equipment;
• The topology of a system;
• Material flow organization.
The simulation model is the basis for investment decisions, the choice of system modernization
variant, the assessing options for the system developing and the opportunity to implement
“Just-In-Time” and “Just-In-Sequence” approach. Furthermore, simulation is an instrument to run a “What If”
scenario without the interference in a real process.
Tactical planning means addressing the challenges of:
• Assessment of the current state and effectiveness of functioning of the current production
system;
• Analysis of weaknesses in production;
• Choice of rational organizational and technological structure.
Operational planning and scheduling are designed to build a production schedule for short periods
of time – from a few hours to a few days (Estremadoyro, Farrington, Schroer, & Swain, 1997).
Simulation model helps to:
• Carry out the current planning;
• Schedule a machine load;
• Make an indicative planning figure and shift-day plan-schedule;
• Schedule the materials delivery and to equip the workshop;
• Optimize the roadmap.
The base for each of the tasks can be the same simulation model, specified and built taking into
account the particularities of the task.
Except for the general opportunities of simulation modeling, there are a lot of potential benefits, not
only to measure the functioning system but also to improve the efficiency due to:
• Increase in productivity (number of product, manufactured per unit of time);
• Reduction of the residence time of units in the system;
• Ensure the timely delivery of accessories and equipment;
• Reduction in capital requirements and operating costs.
Simulation helps to solve several production problems and to assess managerial decisions, which
can be divided into three general categories:
• Estimation of resource requirements and their rational use:
o Quantity, type, and location of machines;
o Requirements for loading and unloading devices, and other auxiliary equipment;
o Storage location and number of stores;
o Assessment of the changes in the volume of production or in the assortment of goods;
o Assessment of the impact of new equipment installation;
o Estimation of investments and operating costs, decline in new production
investments;
o A number of shifts, elaboration of the regulations, etc.
• Performance evaluation:
o Productivity analysis;
o Analysis of time while on the system and non-productive time;
o Review of resources shortage.
• Technological operations, different strategies and scenarios assessment:
o Technological design and production planning;
o Material flow synchronization;
o Inventory management strategy;
o Transportation management strategy;
o Study of the reliability;
o Quality control policy.
The simulation model implementation includes 3 abstract operations. The processing operation is
related to product’s properties changes and to transportation. The assembly operation is a production
process action, resulting in a change of main in-process part by joining another detail. Management
operation is a supply of semi-processed goods to a machine, depending on the length and the queue.
In production systems are implemented the priority queue method and other actions to control the
progress of the proceedings. The important parameter of a production line is a process duration,
which can be:
• Determined – in this case, the implementation’s regularities of individual operations in the
production process are determined strictly;
• Random – it is given as a timing function with random deviation.
There are also processes with constant and variable duration.
The first step making production system simulation is to define its elements, their duration distribution
transportation or storage. May be considered the devices incidental to machine load with workpieces,
to processing, diagnostics, transportation and other, which perform the productive operations,
processing operation and are marked by time delays and operational costs. In describing the
production system, the following characteristics should be set:
• A quantity of machines;
• Individual characteristics (the operation number, the machine number);
• Timing function of the processing.
The main material flow characteristic is the flow intensity. In the simulation model are set:
• Batch workpieces arrival time;
• Quantitative data: size, weight, temperature, etc.;
• Qualitative data: color, flaw, expire date, etc.
The interoperation of material flows and equipment elements is described in the simulation model
based on several operational rules, defining:
• Path technologies;
• Rules for order processing sequence;
• Handling procedure of the same products: fixed means each operation is processed on the
specified machine; free means the operation can be processed on every available machine;
• Way to set the item for the processing: sequential, parallel, sequential-parallel, etc.
The whole production system includes all production activities, such as buffer store, material flow,
and structure.
Several performance indicators are used, obtained from examining the production system simulation:
• Performance;
• A quantity of goods produced, processed and the volume of the end product;
• Operational profit margin, work in process costs, material costs, including resources costs,
flaws, losses, and outage;
• Duration of manufacturing cycle;
• Order processing time, current costs for work implementation;
• In-process queue time, product’s duration time in a queue;
• Transportation time, timeliness of delivery, waiting time;
• Work in process volume and queue size;
• Time losses related to machines outage: the time when the machine waits for new items,
blocked or in service;
• Machine workload;
• A quantity of defective products.
In the general case, the production system is considered in simulation as a stochastic system. The
usually considered in a simulation model. The irregularity of timing – problems resulting in loss of
working hours, unforeseen immobilization of equipment. The peculiarities of production processes
can be related to:
• Downtime, a line at occupied machines;
• Lack or delays in the arrival of items;
• Transportation failures, late intermediate goods, and raw material delivery;
• Under-performance. If the real performance indicator doesn’t match to performance
standard, it can lead to production failure or to defective products.
Generally, the operational time is a random value given by cumulative distribution function.
Defective products involve time losses and material losses in production. In the simulation model
algorithm usually sets the flaw expectation. It is a random value to produce an acceptable or defective
product. In the general case, the probability of rejection depends on semi-finished product’s and
machine’s parameters.
Equipment dependability is an important source of accidents. It is linked to machines’ crashes and
unplanned downtime. Processes, which are connected to equipment revamping are also usually
simulated. In general terms in simulation model are set time-to-failure law and recovery time, and
are modeled breakdowns and equipment recoveries.
The main source of random values in production systems’ simulation models are:
• Products, orders and raw materials arrival time;
• Processing, assembly and control time;
• Time to system failure;
• Machine run time;
• Machine repair time;
• Loading and unloading time;
• Fitting time, necessary to equipment changeover
• Probability of reconstruction;
• Passing rate.
A unique element of a production system is a warehouse, which is not considered as a service
system and in general case is characterized by:
• Holding capacity, number of units of issue, amount of reserve stock;
• Inner status: running inventory at stock;
• Stores management strategy, which is described by:
o Critical stock level;
o Size of a batch of supplies;
o The time between supplies, etc.;
Management on a production scale means an effective inventory policy, which implements the
storage, transportation, warehouse rent, etc. Tasks under inventory policy include the determination
of (Vieira, Dias, Pereira, Oliveira, Carvalho, & Martins, 2015):
• Amount of storage;
• Volume of storage;
• Size of supplying batch;
• Allowed storage time.
The main rules and control values of a storage simulation model are:
• Supply policy: regular, dynamic, etc.;
• Supply batch size: fixed, depends on currents storage status, depends on vehicle capacity;
• Time between supplies;
• Critical stock level;
• Sizes of a warehouse;
• Allowed storage time.
Modern warehouse construction and equipage with necessary equipment and technic requires
substantial investments. That is why it is important to design it before the beginning of construction.
The designing requires to take into account a lot of parameters in collaboration with clients and
building organizations. Success work of warehouse depends on how well it is organized. This is
usually done by the companies that deal with logistic audit, consulting and engineering. The
simulation model is useful in reconstruction or building of a new storage both in logistic center
infrastructure and technological designing. Simulation helps to optimize investor’s expenditure. The
warehouse infrastructure projecting includes:
• Building the warehouse with maximum possible capacity and performance, basing on the analysis of topological map of the area;
• Choice the location and parking places sizes;
• Defining exchange area, packages selection, and storage area;
• Defining the necessary number of gates in the warehouse;
• Defining necessary resources, functional zones sizes, etc.
The simulation model with help of 2D and 3D animation allows to see and to analyze the future work
of warehouse before its construction and if necessary to make adjustments to the project. It helps to
be sure in the optimality of the chosen storage technology and declared resources. Moreover, it is
possible to simulate different strategies, to choose the best one of them and so to reduce the project
budget and operating costs.
The main goals of a warehouse technological designing are:
• Improving the warehouses’ utilization;
• Reducing the service time;
• Investments in the warehouse building and equipment reducing.
• Defining the number of men-machines resources, providing handling with external and internal material flows;
• Defining exchange area, packages selection, and storage area;
• Testing effectiveness of different variants of layout solutions for storing goods and order batching;
• Choice of most effective cargo flow processing technology:
o Search for efficient algorithms to manage cargo flow;
o Development of cargo flow technology;
o Development of algorithms for multiproduct storages (organization of pallet, box or piece selection);
• Planning of procedures and timetable for completing operations of incomes and
expenditures at the warehouse;
• Effective scheduling of works;
• Defining the level of stocks taking into account supplies and possible demand;
• Counting operating costs and their optimization.
Simulation helps to:
• Consider seasonality and peaks;
• Simulate flow in time, possible project characteristics on the big period of time;
• Evaluate the influence of stochastic and uncertainty factors;
• Play difficult technologies and algorithms in cargo flows processing and organization of storing;
• Choose the optimal decision.
Often simulation method is used also by designing and re-engineering logistic networks. Logistic
implies system approach to integrated and dynamic management of material, financial, informational
flows in the organization. Development of simulation modeling, and its use for logistic network
management today has become a necessity and reality alike. Simulation makes it possible to see
the process development to the plan and project realization, as well as visualizes varied and complex
processes and enhances the full-scale understanding of logistical processes, what makes the
simulation very important in the logistical audit. Further, the simulation demonstrates material flows
and their complex interaction with financial, transportation and informational flows. The model makes
able to automate the process of survey alternative options to choose and to provide optimal solutions
based on advanced heuristic genetic optimization algorithms, which are used in logistical networks
reengineering. The simulation allows not only to describe and to measure performance indicators by
all key and operational features of supply chain but also provides instruments to choose optimal
material sources, infrastructure of production and logistical capacities, characteristics of processes
and flows for the whole chain, taking into account future demand, costs, capacities and other internal
and external factors. The simulation allows assessing the consequences of several operations before
they are implemented in a system. Else it helps to conduct a comprehensive review of possible
the system work when it is necessary to compare different decisions and also reduces the duration
of the decision-making process. Proper use of such models provides accurate risk and profit
assessment in different possible future operating activities. Guided by complete and reliable
information relating to a wide range of possible future operational activities, managers can make
informed supply chain management decisions.
Benefits of using the simulation for logistics systems are:
• Comprehensive understanding of processes and characteristics of logistic chains with help
of charts and animation;
• Opportunity to take into account the stochastic nature and dynamic of several external and
internal factors. A user is able to simulate random events in specific areas and identify their
impact on the logistic network, using probability distribution;
• Opportunity to reproduce system dynamic, to reflect dynamic of logistic processes nature and abundance of time and cause-and-effect relationships (e.g. consumers demand is
usually stochastic and dynamic, running inventory is a dynamic parameter);
• Multistage design procedure allows to consider the complexity of decision making, a large
number of decisive rules and optimization parameters;
• Availability of several acceptable decisions;
• Risk minimization because of possible plan changing, due to initial analysis and possible scenario simulation;
Main tasks to design the logistics network are:
• Maximum integration of logistic functions all over the whole logistic network;
• Capacity planning;
• Material flows synchronization;
• Materials and capacities coordination;
• Increase in productivity;
• Prevent losses from outages;
• Weaknesses analysis;
• Production, storage and transportation costs reduction;
• Consumption demand assessment and planning;
• Improve purchase order compliance;
• Choice of rational variant of business organization;
• Supply chain optimization.
Supply chain optimization allows to implement:
• Effective meeting demand;
• “Just-In-Time” strategy realization;
• Costs minimization along the entire logistics network;
Hallmark of logistics networks is that many types of resources are mobile objects (means of
transporting). Such simulation model describes processes of movement and goods accumulation.
There are parameters, which define the model condition and which are changing in time according
to operational rules.
To create logistical network simulation, it is needed to fill it with some data. Production process and
its time intervals:
• Production process: process implementation duration, prioritization of processes and time
frames, amount of equipment in each process;
• Scheduling: data on shifts, weekends and holidays, prophylactic works;
• Equipment: its amount, mean time to failure, to repair, data on alternative resources, prophylactic works and its utility value;
• List of materials and material flows characteristics.
Inventory policy: guaranteed inventory level of stock and materials, fill rate.
Information on delivery:
• Delivery lead time;
• Drop Size;
• Supplier’s capabilities;
• Delivery forecasting time-frame;
• Delivery time.
Demand:
• Payment deadline;
• Priorities;
• Delivery initial and final time;
• Demand pattern and dynamic.
Policy and strategies:
• Alternative solutions and scenarios;
• Inventory policy;
• Marketing policy.
Simulation of the supply chain on strategical, tactical and operational levels is a traditional field of
using simulation instruments. Complex strategic simulation of relationships between production,
transport, and distributive chains allows companies to create optimal and resistant to market
fluctuations strategic model of transport chain, to determine chain development strategy.
Furthermore, the following tasks can be solved:
• Choice of best policy and parameters of supply chain administration;
• Most rational network objects utilization, taking into account business restrictions; supply chain safety buffer defining in case of jump in demand or problems in supplies;
• Carrying-out of “What-If” and risks analysis;
• Fixed and variable distributive network costs reduction with help of “What-If” analysis and
comparison of the result before and after;
• Service and customer experience improvement;
• Budget and timing data planning;
The simulation system of strategic optimization is used for new resources other strategic decisions
analysis, such as new factory building construction, estimating of breakeven prices for resources
purchase and supply chain for new product engineering. The goal of such system is net profit or
return on investments improving. Tactical optimization simulation model establishes an integrated
plan of stock supply, production and distribution for the whole distribution system for the following 12
months. Its goal is to reduce logistics meeting demand costs or to increase net income.
Simulations can be an important tool for managerial decision-making and have a number of benefits,
which are:
• Consistency in solving complex managerial situations on supply chain designing, including
a large number of requirements (supply patterns and channels, inventory strategy, planned
production capacities, distribution network structure and parameters under uncertainty of
external environment and demand);
• Mainstreaming uncertainty. Uncertain factors are future demand, competitors’ prices,
delivery time, consumers flow intensity, and interest rate change;
• Alternative solutions comparison according to simulation received and deferent policies
impact analysis;
• Multiple results monitoring. Complex simulations can be used for different factors dynamic
tracking, particularly for profit, sales volume, costs and client layer;
• Simulation model using doesn’t have any risks of its own accord. Moreover, without simulation different strategies would have to be tested in the real world, what can bear the
risks on the contrary. For example, simulation allows to change the good price and to watch
the impact on sales volume.
• Costs saving. Simulation models are relatively cheap. It is possible to check different situations and so to save money for small price of simulation and for small period of time.
To summarize, it can be repeated, that simulation modeling is going to be used for wide range of
management tasks both in big and medium-sized business. In purchasing management, it could be
a model, which provides a simulation of automated order for goods placement and which considers
different parameters such as prices, logistic endurance, goods quality, costs minimization, etc. The
model helps to analyze specific ordering policy and to understand if there could be some problems.
In distribution sphere simulation modeling can be used both on the stage of distribution network
building and on the operational stage, which includes defining an optimal place for distribution
simulation helps to choose types of vehicles and routes, transport operators, and logistics partners.
In stock management simulation is used to rate the service quality, to define safety and operational
stocks. In warehousing, it is appropriate to apply simulation for defining parameters of stocking
system, for evaluating and choice access point and warehouse complex variants, for evaluating
different technological solutions, etc.
The most effective use of simulation models is on pre-implementation stage and to design new or to
modernize the current system. On these stages is the highest risk to make wrong decisions, the price
of which is rather high.
1.2.
Simio
Simio Simulation and Scheduling Software was developed in 2006, by the Simio LLC, which was
founded in 2005. Founder and CEO of the company is Dr. C. Dennis Pegden. He has over 30 years
of experience in the field of simulation and scheduling. Before he founded Systems Modeling
Corporation, he had taken part in the development of such computer simulation software as SLAM,
SIMAN, and Arena. The system Arena is focused on business processes. That are any systematic
activities in a very broad sense. The Arena software has certain strengths but like any other products
it becomes outdated. Thus, it should be replaced with another software (Borshchev, 2015). The Simio
software worth particular attention at least because it was developed by the same people, who took
part in the development of the Arena software. While keeping the advantages of the Arena software,
the Simio software brought new opportunities with a view to compliance with the new requirements.
The company tagline is “Forward Thinking” (Yakimov, Kirpichnikov, & Rodina, 2016).
The perfect combination of modeling and planning makes Simio one of the most advanced products
on the market of simulation programs. The Simio system is a software with object-oriented processes
and objects, defined in a graphic form without requiring programming. The program allows “rapidly
build accurate 3D models and objectively analyze alternatives to reduce risk and improve
performance”. It makes possible not only to improve the efficiency of the business from the
perspective of object design but also to maximize the results of business processes by optimizing
the use of resources and by the ability of risk assessment, related to business solutions. Simio can
be used to model a wide range of systems, including manufacturing, healthcare, supply chain,
transportation, defense, and mining.
“Simio is a simulation modeling framework based on intelligent objects”. Objects can be borrowed
from other projects, stored in libraries and used in other projects and built by modelers themselves.
This is how is realized the opportunity to simulate without requiring programming. The objects can
be machines, vehicles, workers and different other elements. The Simio models look like the real
systems. It is possible to show the model in 2D and 3D, to change its view and to download models
from the 3D Warehouse. The apparent advantage of the system is the full support of both discrete
Simio contains 6 classes of intelligent objects:
1) Fixed objects, that can be used for submission of the whole modeled system or its parts,
which are not moving at launch (Source, Server, Sink).
2) Links define the motion path for Entities and Transporters. They also transfer Entities
between two Nodes (Connector, Path, TimePath, Conveyor).
3) Nodes are points of intersection between communication links and ways in and out of fixed
objects (BasicNode, TransferNode).
4) Agents are used for object’s behavior simulation, which can be dynamically created and
destroyed. They are able to move, recognize, pursue and capture other objects.
5) Entities are used for simulation of the behavior of objects, which can follow the working flow
in the system (ModelEntity).
6) Transporters are used to transfer Entities through communication links.
A user can switch between 2D and 3D views. 3D allows to change the view aspect, to enable the
camera rotation continuously around the model, to choose the ground color, to set time of day and
much more. 3D mode also allows to make changes in the model and to see immediate results.
Like most other simulation systems, Simio allows to see the results of the work of the model. The
system can provide the results in the form of the pivot table (PivotGrid) or the report. The pivot table
allows to group, sort or filter indicators and to export them in .csv format. The report makes possible
to show results in the form of a traditional report, which is convenient to use for the following printing,
or reporting.
Separately worth noting, that Simio developers provide a collection of free training videos for learning
the program, which it is easy to get directly through the program. Furthermore, there are plenty of
materials on the internet.
In summary, it can safely be said, that Simio is up-to-date, constantly improving system, which has
several undeniable strengths, making it one of the most promising products on the simulation
software market.
1.3.
Arena
Software “Arena” is created by Rockwell Software (before Systems Modeling Corporation), is a
software for discrete simulation, which allows creating dynamic system simulation, which can be
used to implement big amount of real systems. The first version of the Arena software was created
in 1993. It has easy-to-use object-oriented interface and can be adapted to all kinds of subject areas.
In general, the system is rather easy.
Arena software is a pack, which includes the Arena simulator, the Input Analyzer (for input analysis),
and the Process Analyzer (PAN) (for output analysis). The advantages of Arena could be:
• Its relatively small price;
• The software can be used for large projects.
The base of Arena software is simulation language SIMAN and the system Cinema Animation.
SIMAN was first created in 1982 (Shsherbakov, 2012). It is a “high-level language”. It means users
can develop their code by using built-in templates for entities, processes, and queues. It is always
being improved by adding new features. To show the result of the simulation is used animation
system Cinema Animation, which is known on the market since 1984. The simulation creating
process is following:
1. A user builds the model in Arena simulator;
2. The system is generating the appropriating SIMAN code;
3. The Cinema Animation starts.
Arena interface includes all kinds of tools to work with data, including spreadsheets, databases,
ODBC, OLE, DXF supporting. Arena includes Application Solution Templates. Each template
represents set of special modules, which make Arena task-oriented simulation environment. By
creating or changing these templates, it is possible to adapt Arena to address the challenges facing
users (Yakimov, Kirpichnikov, Mokshin, Kostukhina, & Shigaeva, 2014).
Arena software includes the following basic elements:
• Create and dispose;
• Process;
• Queue.
Models can be much complex. They can include hundreds of elements of different types. Elements,
working with entities (e.g. Server) can have different states, like “waiting” or “working”. Each state
can have its own image and so simulation model can be animated. Arena software has set of image
examples.
It is not always possible to create a simulation without preliminary business processes analysis.
That’s why functional and simulation models don’t replace but complement each other. In doing so
they can be closely linked. Simulation model gives more information for system analysis. The
analysis results, in turn, can lead to changes in the simulation model. Most appropriate is to build the
first functional model and then at its basis to build the simulation model. To support this the functional
simulation toolkit BPwin is able to convert IDEF3 (Integrated DEFinition for Process Description
Capture Method) diagrams to Arena simulation model. As simulation model has much more
parameters than IDEF3 diagram, BPwin can set these parameters.
Arena is used often in universities because it is relatively easier to teach Arena. But on the other
hand, due to alternative software, including SIMIO, has better animation and visualization
capabilities, Arena is less used in business projects. First of all, Simio is more intuitive, because it is
built around the concept of intelligent objects. Simio is based on the drag-and-drop placement of
objects, instead of logical modules. In their turn, objects represent physical components in the real
mainly two-dimensional software (2D), with limited post-processed three dimensional (3D) viewing
capabilities. Real-time, interactive 3D visualization provides a more visible advantage in verification
and validation. Perhaps, it engages stakeholders emotionally, makes them trust more (Theodore,
2011).
1.4.
Kanban
In the modern world, there is special attention paid to time and costs reduction. Firms try to minimize
inventory. The stock in today’s business becomes one of the basic management utilities, that provide
success of a company. Due to the broad implementation of flexible manufacturing systems there
appeared more opportunities to optimize a flow of goods and to create flexible workshops, where the
supply of required components and semifinished items are being implemented by robots, controlled
remotely. They are also aimed at minimizing an inventory.
Kanban is a system of planning and management of inventory and material flows between separate
operations with an aim to produce and supply parts and semifinished goods with zero defects at the
time what consumers need (Kniberg, & Skarin, 2009). The point of the system lies in the fact, that
the primary inventory in its amount suits the needs of the initial stage of a production process and is
not accumulated. The system was created and first time realized by the Japanese firm “Toyota”. In
the year 1959, this firm started experimenting with the kanban system (Monden, 1998; Welgama,
Mills, & Osmond, 1995). Since 1962 was started the global use of the system. The theoretical basis
of kanban system finds its start in the ideas of F. Taylor (1856-1915), who was one of the founders
of scientific management; of H. Ford (1863-1947), who started the mass production of the automobile
industry. The word kanban comes from two Japanese words: “KAN” – Signal and “BAN” – Card or
Board, hence kanban is considered to be actually a signal card. The system uses such cards as
signal cards to point out the need to add or to produce a certain number of items. The kanban system
organizes the production process so, that at all stages of the production cycle required components
are delivered to the place of the subsequent production operation “Just-In-Time”, what means when
it is necessary (Pisuchpen, 2012). And finished products are produced and shipped when there is a
demand for them in a distribution network. The kanban system provides the performance of
production orders not by weeks but by days or even hours. Whereby the production control is realized
by the workers.
Usually, kanban is a plastic card. There are two types of cards: card of selection and card of
production order. In the card of selection is identified the number of workpieces, which should be
taken at the previous step of processing. Meanwhile, in the card of production order it should be
specified the number of workpieces, which should be produced at the previous section of processing.
These cards are used both inside of the factory and between firms-suppliers. In the kanban system
there is no strict plan of production. There is the only general scheme for providing the calculation of
demand for inventory and workers at each production sector. The comparison between a scheduled
and actual volume of output at the end of each time cycle is not necessary, because the plan can be
The kanban system is based on:
• Strict quality control at all levels of the production process;
• High qualification of workers;
• Increased responsibility of workers;
• Close cooperation with suppliers.
The kanban system implies specific approach to the selection and evaluation of suppliers, based on
working with a narrow range of them, selected by their ability to guarantee the deliver “just-in-time”
and high-quality. Furthermore, the number of suppliers should be reduced and with the rest of the
suppliers should be set the long-term economic relations. The head office provides to the suppliers
their help, aimed primarily at the improving the quality.
The main principles for the functioning of the kanban system are the following:
• Providing all materials in the relevant quantity and quality to the moment and the place of
their use;
• Replacement of inventory with the information about the possibility of their rapid acquisition;
• Replacement of the selling policy for produced goods with the policy of producing saleable
goods. That means renunciation of surplus production;
• Providing the flexibility of production and rapid adaptability to the changing requirements of the market. That means the use of several cheap machines instead of one expensive but
all-purpose. That means also, that workers are allied professionals;
• Debureaucratization: avoiding of paperwork in favor of oral instructions. Refusal of unnecessary administrative workers;
• Reduce the number of suppliers;
• Implementation of all orders in the best possible way and as soon as possible.
If to use the permissive interpretation of kanban concept, considering that it refers to any system,
based on cards, then most of the companies can say, they use kanban system. For example, in
manufacturing industry, there is for a long time a standard operating procedure to supply the order
during the production process with a card, known as workflow chart. Such cards have nothing to do
with kanban system, because they are used in the system based on “push” principle, while kanban
uses “pull” principle. The difference between these two principles is described in Table 1 on the next
Table 1. Differences between push and pull systems.
Push Pull
Production
Maximum capacity utilization, continuous
production Production is oriented on changing demand
Production management
Centralized operational production management Decentralized operational production management
Production planning
Planning start from preparation sector Planning starts from assembly stage
Performance requirements
Single-functioned workers Allied professionals
Suppliers
Significant number of suppliers, irregular supply,
mainly large consignments Small number of suppliers
Inventory
Excessive material resources, availability of
finished goods Virtual absence of inventory and finished goods
Source: Author's own elaboration.
The vulnerability of the planning the demand for materials system lays in fact, that it is based on
guessing of certain trends. It is necessary to predict customers demand and product manufacturing
time. However, mistakes in forecasting lead to increasing of excess inventory. Until recently it was
considered, that “push” system would eventually be displaced with computer system of planning. But
the Japanese “pull” system, called kanban reject this prediction. Kanban provides the production of
details as the need for them arises. At the same time there is no need in guessing about future trends
in demand. But there is a serious restriction for use the system kanban. The system is only effective
in conditions of “Just-In-Time” system, especially in reduced time of equipment readjustment and
size reduction of product shipment. “Just-In-Time” system can be used without kanban system but
kanban cannot be used without “Just-In-Time” (Minovski, 2007).
According to the kanban system at “Toyota” every type of product has its own container, designed
for a strictly certain number of items (Schonberger, 1982). There are two types of cards, which show
the number of product, its number, and another information. One of the cards is a production card,
used for the sector, where the product is produced. Another card is a shipping card, which serves
the sector, where the product is used. Each container goes between the production sector and the
sector of product usage. During the process, one card is replaced by another.
Implementation of kanban system is used almost at all enterprises producing piece-goods and can’t
be used in nonstop production. But the system provides a benefit only in following cases:
appears at the companies producing batches and spending many hours on equipment
reconfiguration. The main point of “Just-In-Time” system is to reduce the set-up time and the
production batch’s size so that it becomes possible to reduce the time of pull.
• Workpieces in kanban system should be used in production every day. A worker should always have at least one full container with them, which will be used the same day. That is
why companies usually use kanban system in the production of mostly used products.
The kanban system is not used in the production of expensive or large-scale product. Maintenance
and storage of such product is very expensive.
It is very simple to use the kanban system. But it is not so easy to implement kanban. The system
needs the substantial reduction of changeover downtime and time of re-equipment. So, the system
implementation is very expensive (Monden, 1998). But after the implementation costs are paid off
and major economic impact is achieved through the rational use of materials, the productivity and
quality increases (Müller, Tolujew, & Kienzle, 2012).
The main advantages of the kanban system include the following:
• Production is oriented on the market – reduction of unnecessary inventory leads to reduction
of the entire production cycle, what leads to faster response on market changes; allows to
change production volumes faster; allows to predict more precisely;
• Building long-term partnership with suppliers;
• Reduction of equipment downtime;
• Inventory optimization;
• Decrease in processed batches;
• Reduction in defectives and improvement in quality.
There is a simple explanation of this advantage. Since the production is in small batches, if the worker
produces the object and gives it to the next worker immediately, he will be made aware at once if his
object is defective. As a result, defective items are identified immediately.
• Almost total elimination of work-in-progress production;
• Better use of production and storage spaces;
• Increased productivity.
The workers are encouraged when they solve some production problems. Generally, they respond
with approval to all process improvements.
However, the implementation of kanban system outside of Japan caused a lot of difficulties, from
lower supplier’s discipline to territorial disunity of suppliers and consumers. That is why in Japan the
distance between the factory and companies’ suppliers is much lower than in Europe or USA. So,
some not Japan firms use kanban system only partially, often in combination with other management
2.
Methodology
The second chapter will emphasize the problem, which is possible and convenient to solve with the
help of Simio software and kanban cards system.
The Simio software is used in production, and not just, to represent explicitly the functioning of the
system. The program is also useful for healthcare, military, airports, manufacturing, supply chain,
ports, mining, lean-six-sigma and other disciplines.
As was mentioned above, the point of use the kanban cards is that in the first stage of some process
the volume of inventory was not excessive but was consistent with the requirements (Hao & Shen,
2008). The material is delivered to each stage, whether it be production, or delivery, according to
“Just-In-Time” concept, what means, when it is really necessary.
Since the kanban system doesn’t have strict rules on the number of used cards, it should be
calculated an optimal number of cards for each situation.
Turning to production, there are two types. The first is normal production – to sell what is produced.
In this case, the price equals the sum of profit and losses. The second type is lean production. That
means, that the profit equals the difference between the selling price and the losses. In this case,
however, the selling price is defined by the market. And by reducing the losses there is an opportunity
to influence the profit. According to the lean production, the selling price, defined by the market,
depends on how appropriate customers expectation regarding to product or service quality and time
frames are. Meanwhile, losses are results of activity which customers don’t want to pay for, which
doesn’t have any value for them.
The kanban system suits the economical production as well as possible. It is aimed at reduction of
losses. At first, let’s see how it could be in general, and after in context.
First will be considered the types of losses, which it is possible to reduce with the help of kanban
• Overproduction;
• Transportation;
• Waiting time;
• Inventory;
• Defects.
The result of overproduction is an unnecessary product, which makes no profit. It has a negative
effect because it:
• Increases storage costs;
• Increases cost as a result of excessive use of materials and resources;
• Delays supply schedules;
• Possible is a cause of forced discounts.
To get rid of overproduction is possible if:
• To produce only Just-In-Time;
• When there is a demand for the product;
• To producing small parties;
• Being able to adapt the production for another product.
Costs for unnecessary transportation lead to losses too. Whereby transportation means not only from
one warehouse to another, or to consumer. In this case, it refers also to movements between
production stages. There the sources of losses can be poor logistics organization. In this way kanban
cards can help to organize the transportation more optimal, to reduce the distance, or to deliver the
product just when it is necessary.
The causes of losses, as a result of waiting time can be production planning not for consumer’s
needs but for equipment loading. Again here, kanban system can help to signalize, when it is
necessary to start the process.
If to talk about storage costs, about excessive inventory, kanban cards allow getting rid of
non-demanded production in the way, that it will not be produced ahead of time. Here it is also very
important to find the balance between production and distribution.
As it was already said in the first chapter, by using kanban cards system, usually it is produced a
much smaller amount of production. Therefore, when the product moves to the next stage of
production, it is easier to detect defective product and to react. Consequently, only small amount of
production will be defective, which will reduce losses from defects.
Above it was mainly mentioned about the use of kanban cards in production. However, they can be
used within different activities. For some time kanban cards are a lot used in IT sphere when
implementation of the plan is less important than the speed of response to changes. Furthermore,
kanban cards system can be found in the shops, cafes, and restaurants. There are used not physical
cards but services to make orders from suppliers automatically when it is necessary. One of the most
in supermarkets. They are recharged not when the supplier ships new party but at the moment when
the shelves become empty. So, the kanban cards system is applicable in a sufficiently large number
of activity fields.
In the third chapter, there will be a particular example of kanban cards use – the pick-up point place.
The problem lies in following. “Raw material” arrives at the warehouse. There are three stages of
processing and the final stage is the place of pick-up the product by the consumer. On each stage,
the raw material is marked with a kanban card. Before it travels to the next stage, the card is detached
and sent to the start of the stage. Meanwhile, the material moves to the next stage and is marked
there with new kanban card. To introduce greater clarity, let’s assume that the “raw material” is
furniture components:
• On the first stage of process items are captured from the warehouse;
• On the second stage they are checked for defects;
• On the third stage they are packed into boxes;
• On the last stage customer takes the box.
The idea of kanban cards, in that case, lies in the fact, that on each stage there will be:
• Optimal number of items: enough to assemble several units of furniture and at the same time
they were not lying stagnant for a long time.
• Necessary number of boxes for the following stage;
• Optimal number of already packed items so that clients were not detained for a long time in
pick-up point.
Simio software allows to do this as follows:
• Probable frequency of customer arrival is calculated;
• The time spent to deliver everything from the warehouse to pick-up point place is taking into
account;
• The simulation with received data is established;
• Empirically with the help of the tool “Experiment” is found the required number of kanban
cards (or other parameters) so that time of customers being in the system, the volume of
prepared production and number of cards will be balanced and optimal.
Therefore, we considered in theory, how the realization of kanban cards system is possible, how to
3.
Computational Implementation
In this chapter we will be developing two simulation models: a simple model representing a single
stage kanban system just as a proof of concept and as a possible building block for more complex
production setups. We then develop a more complex model (a multi stage kanban system) for
demonstrating the many possibilities of using simulation to fine tune kanban systems.
3.1.
Simple Model
This first model implements a single stage kanban system. There is one machine where some
processing is done in one product. After the processing finishes, the product is moved into a kanban
supermarket where it waits to be consumed by the costumer. The production and the amount of
inventory in the supermarket is controlled with kanban cards.
The kanban signals could be invisible, but we opted to model them visually in order for the simulation
to be appealing and easy to understand.
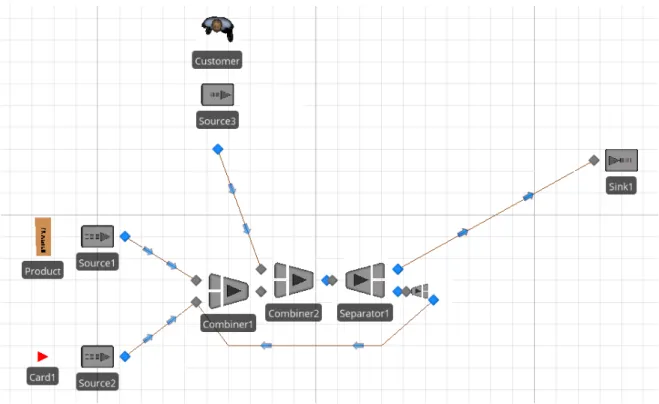
The Figure 1 demonstrates the simple model of how the kanban card system can be implemented
Figure 1. Simple model example.
Source: Author's own elaboration.
To create this product in Simio we need following objects:
• 3 sources;
• 3 entities: customer, product, card1;
• 2 combiners;
• 2 separators;
• Sink.
Sources create entities customer, product, and card1. The kanban system in the Simio software can
Figure 2. Kanban block.
Source: Author's own elaboration.
The entities Product and Card1 are combined in a batch with the help of object Combiner, what
represents the processing of product and the attachment of a kanban card. Moreover, combiner can
be configured to the simulation of some process for a set period of time. When the product is taken,
object Separator detaches the card from the product.
In more concrete terms, the Source2 creates in the beginning of the simulation and only ones a
number of cards. Each time one of the cards arrives to the combiner 1, the Source1 creates one
product. With some frequency the source 3 creates a customer, what represents the arrival of the
client. When the card is attached to the product, it waits for the customer. When the customer is
attached to the batch of product and card, the card is detached and is sent back to the first combiner,
meanwhile the entities Customer and Product leave the simulation. And the cycle continues with new
product and new customer.
The whole point of the process is that the production appears in the system in a certain limited optimal
quantity and only when the card signals about that, what means only when it is required. That is how
the Just-In-Time system is implemented and the number of product in system is controlled. And that
is kanban cards system.
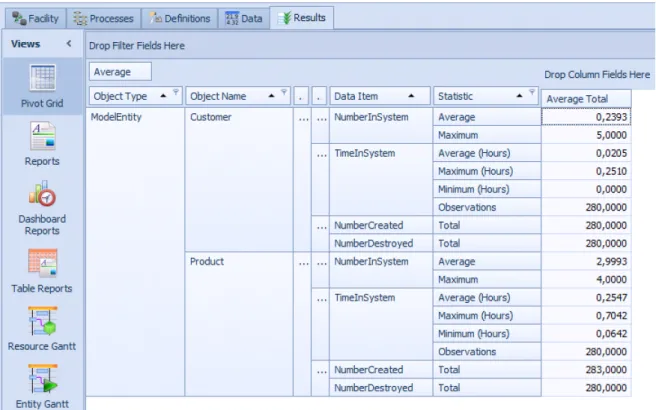
The Simio provides the possibility for analyzing the performance of the system. The option “Results”
provides access to the pivot grid, where required parameters can be visually evaluated, what is
illustrated on the Figure 3. For example, these can be the average client’s time in system or the
number of product in system. The information can be sorted and filtered. Further there is an option
to export the results in Excel. The software has a tool, called “Experiment”. This tool allows to
calculate different scenarios in the system with different parameters. As a result, after the analysis
For this simulation, all transportation times are 0, the processing time in taken from a Triangular
distribution with parameters 3, 4, and 5 minutes. The costumer arrives according to an Exponential
law with an average time of 5 minutes.
Figure 3. Results tab in Simio.
Source: Author's own elaboration
3.2.
Complex Simulation Model
We now model a more complex, multi-stage kanban system with intermediate storage between
stages. It is assumed that stages are physically near, so there is no need for implementing
transportation kanban.
The simple model from the previous section is used as a building block in this model. Using the block,
it is possible to create a more complex system. These blocks will mean some stages along the
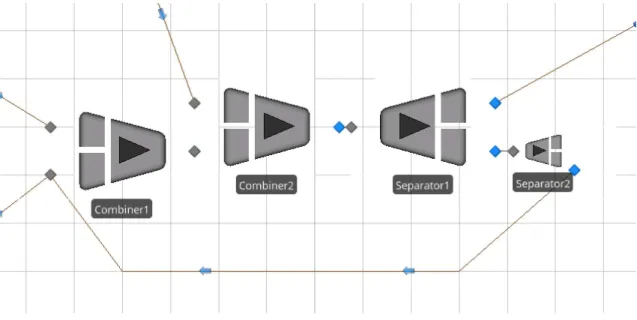
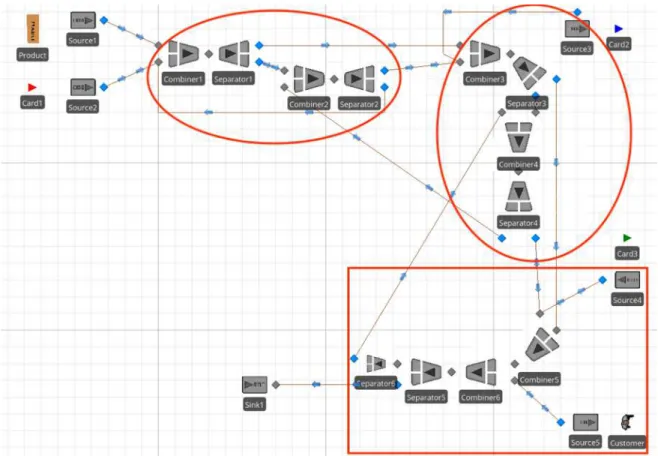
Figure 4. Complex simulation model.
Source: Author's own elaboration
On each stage the product is marked with a card. In the beginning of the simulation sources create
3 cards for each stage. Further, on the first stage product is attached to one card, processed and the
card stays at the next combiner, meanwhile the product travels to next stage where it is marked with
the new card. As on each stage there are only 3 cards, there are only 3 entities product on the last
stage. There they wait for customers. When the client takes one unit of production, the card is
detached from the product and travels on the previous stage. There it signals to send the card, which
was there to the previous stage, where it signals to send the new entity of product. Thus, the system
continues working, realizing the kanban cards system. Every time customer takes the product, it pulls
another product from the previous stage, what pulls one more product from the previous stage and
so on. That is the pull principle in kanban system.
The system can be modified in different ways. Blocks can be complemented by servers, which will
possibly model some more complex processes. There can be very different objects and entities. The
distance between the objects can be longer and more realistic to make the simulation more realistic
and illustrative. Or it can be used “TimePaths” to set the time of travel manually. The number of all
kinds of possible changes in the simulation is rather big. The number of ways implementing the
simulation is rather big as well. It can be used to build realistic systems. Or to create some schematic
simulations just to find out the possible results. It can be used to study in schools, universities, firms,
and so on. Students can visualize the required process, can explore the logic and concept of the
simulation process, of kanban cards, the Simio functions and after change and improve the