INTRODUCTION
Diffuse pollution of aquatic systems by agricultural land runoff and untreated domestic and industrial effluents has been an undisputed effect of anthro-pogenic activities related to intensive land use. This pollution has led to increases in nitrogen and phospho-rus inputs to estuarine and coastal waters (Officer & Ryther 1980, Smayda 1990). Conley et al. (1993) dist-inguished between 2 types of ecosystem-level changes
caused by eutrophication: (1) increased nutrient loading when N and P are added to aquatic systems through anthropogenic activities, resulting in increased phyto-plankton production, especially of diatoms, and (2) the permanent loss of some fraction of the diatoms pro-duced from the water column and their sequestration in the sediments.
While N and P are the 2 most important nutrients governing algal growth (Kilham & Hecky 1988, Som-mer 1989), the relative availability of resources in the aquatic environment may play a major role in struc-turing phytoplankton communities (Tilman et al. 1982, Sommer 1989, Egge & Aksnes 1992, Granéli et al.
© Inter-Research 2002 · www.int-res.com *E-mail: crocha@ualg.pt
Role of transient silicon limitation in the
development of cyanobacteria blooms in the
Guadiana estuary, south-western Iberia
C. Rocha*, H. Galvão, A. Barbosa
CIMA — Centre for Marine and Environmental Research, Universidade do Algarve, FCMA — Faculdade de Ciências do Mar e do Ambiente, Campus de Gambelas, 8000-810 Faro, Portugal
ABSTRACT: The Guadiana estuary, located between Portugal and Spain, has the fourth largest drainage basin of Iberian river systems. Up to 75% of the catchment area has been regulated by dams since the early 1970s. During the 1980s and 1990s, an increasing occurrence of summer cyanobacte-ria blooms dominated by the potentially toxic Microcystis spp. was reported. In an effort to under-stand the causes of recurrent noxious blooms in the Guadiana estuary, nutrients (phosphorus, nitro-gen [nitrate, nitrite and ammonium], and silicon [silicic acid], chlorophyll a and phytoplankton abundance, specific composition and biomass were evaluated during field surveys, from April 1997 to March 1998. A pattern of successive blooms of different phytoplankton assemblages was observed throughout this period. Diatoms (nano-sized, chain-forming) dominated an early spring bloom (max. 18 × 103cells ml–1) in March and April. Following the decrease in diatom abundance, a chlorophyte
bloom (max. 11 × 103cells ml–1) and then a cyanobacteria bloom (> 6 × 10⁴cells ml–1) quickly followed
during late spring through to early summer. From July to September, a major cyanobacteria bloom dominated by the potentially toxic Microcystis spp. (> 4 ×10⁵cells ml–1) developed in the freshwater
zone. The results indicate that high winter loads of nitrogen and phosphorus led to the depletion of silicate (down to as low as 0.2 µM) during the early spring diatom bloom, which conditioned the suc-cessive phytoplankton assemblages during the remaining productive period. Low monthly discharge rates during spring and summer further provided an environment with low Si:N and N:P relative availability which, coupled with high water-column temperature (> 21°C), seemed to favour the dominance of cyanobacteria over chlorophytes during the summer.
KEY WORDS: Southern Portugal · Estuaries · Harmful algal blooms · Eutrophication · Silicon · Nitrate · Cyanobacteria · Dams
1999). Officer & Ryther (1980) postulated that a change in nutrient composition, with increased availability of N and P but not of Si, would be expected to change phytoplankton composition. Because N and P recycle faster than Si in aquatic systems, increased silica reten-tion has been documented in sediments of artificial lakes (Conley et al. 1993). Concomitantly, a reduction in the water-column silica reservoir has been ob-served, resulting from man-induced modification of biogeochemical cycling: enhanced diatom production results in increased deposition and preservation of diatom silica, leading to a reduction in the water-column silicate availability (Schelske & Stoermer 1971). This second consequence of eutrophication is often linked with water-retention policies included in dam management (Humborg et al. 1997, Milliman 1997), and the process of eutrophication in artificial lakes has been likened to the process arising from reduced silicate loading into the sea (van Bennekom & Salomons 1981, Humborg et al. 1997).
According to Officer & Ryther (1980), phytoplankton communities can be separated into 2 basic categories: those dominated by diatoms and those that are not. Growth of diatoms depends on the availability of sili-cate, while growth of non-diatom phytoplankton usu-ally does not. It is therefore conceivable that a transi-tion between siliceous-based and non-siliceous-based phytoplankton foodwebs will be observed as a result of N and P enrichment (Turner & Rabalais 1994). This ‘cultural’ eutrophication of natural waters has been linked to episodic anoxia events, declining fish and shellfish stocks, and increased frequency of noxious algal blooms — flagellates and cyanobacteria (Turner & Rabalais 1994, Granéli et al. 1999). For instance, for the central North Sea, Smayda (1990) showed an increase in N and P, in contrast to unchanging or even decreas-ing dissolved reactive silicate (DSi) levels over the last few decades associated with increased noxious blooms and a concomitant decrease in the biomass of diatoms. Officer & Ryther (1980) and Ryther & Officer (1981) suggested that the diatom foodweb contributes di-rectly to large fish and shellfish populations, while foodwebs based on flagellates or cyanobacteria are undesirable food sources, with these species remain-ing ungrazed or fuellremain-ing foodwebs that are economi-cally undesirable. Moreover, cyanobacteria blooms have been associated with deleterious health effects on local human populations (Chorus & Bartram 1999).
The present work focuses on the nutritional status of the Guadiana estuary (southern Iberia) and its rela-tionship to the summer dominance of cyanobacteria. The Guadiana has the fourth largest drainage basin of Iberian rivers (67 840 km2), but since the 1960s, dams
have been regulating up to 75% of the freshwater flow (Morales 1997). The recently built Alqueva dam,
in-tended to provide irrigation to the largest agricultural area of Portugal, will soon surpass this, regulating 81% of the total catchment area (55 000 km2) from 2002
onwards. Previous studies (1980 to 1985) in the Guadi-ana estuary revealed the past occurrence of cyanobac-teria blooms in association with high nitrogen and phosphorus levels, particularly in years of low fresh-water-loading (Cabeçadas & Brogueira 1981, Oliveira 1985). There is evidence that cyanobacteria blooms have been increasingly frequent since the 1980s (Oliveira 1991, Vasconcelos 1993, INTERREG-II 2000). Monitoring studies of the Guadiana River during the 1990s detected blooms every year from 1996 to 2000, even though a large range of annual freshwater dis-charge rates was observed during this period (INTER-REG-II 2000). Results from these studies are included herein, in an effort to relate transient silicate limitation to the dominance of summer cyanobacteria.
MATERIALS AND METHODS
Study site. The Guadiana is a mesotidal fluvial-marine system located on the south-western Iberian Penin-sula, with the fourth largest drainage basin of Iberian rivers (67 840 km2). The total river length is 810 km, of
which 550 km is in Spanish territory and 180 km in Por-tuguese territory, with a section of 110 km serving as the border between eastern Portugal and south-western Spain (Fig. 1). The maximum upstream extent of saltwater penetration coincides approximately with the town of Alcoutim (35 km from the river mouth), while the tidal influence extends an extra 25 km up-stream to the town of Mértola. The drainage basin is located in a temperate climate-zone, characterized by humid, moderate winters and hot, dry summers. The main activities in the catchment area are agriculture and agro-industry. The annual river-flow regime de-pends on rainfall, with years of very high flow inter-calated with long periods of drought. Since the 1960s, the Guadiana’s natural flow regime has been strongly constrained by more than 40 dams, which regulate approximately 75% of the freshwater input into the estuary (Morales 1997), a figure which will soon be greatly surpassed by the recently built Alqueva dam, which will irrigate the largest agricultural area of Portugal, constituting 81% of the total catchment area (55 000 km2). In addition, rainfall and water retention
by the dams contributes to the already sharp seasonal and interannual differences in freshwater inputs. This contrasts with the previous dominant ‘rainfall regime’, which supplied a more even freshwater inflow through-out the year (Fig. 2a). During the last 2 decades, the mean monthly freshwater flow at Pulo do Lobo (Fig. 1) has varied abruptly between wet and dry seasons, with
peak winter flows ranging from 200 to 600 m3s–1and a
minimum of 0.1 to 20 m3s–1in summer, depending on
rainfall and dam management.
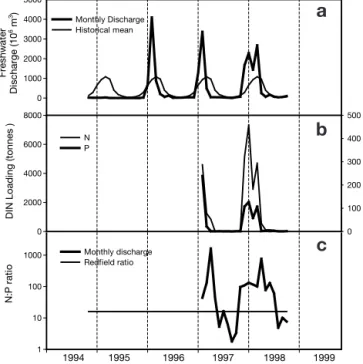
Nutrient loading (calculated from publicly accessible data of the National Water Institute, INAG, Portugal) derived primarily from drainage of agricultural catch-ment areas paralleled the freshwater flow regime from 1996 to 1998 (Fig. 2b), with up to 8000 t of dissolved inorganic nitrogen being introduced at Pulo do Lobo in December 1997, and a maximum of 300 t of phospho-rus the previous winter (1996). The dissolved N:P ratio of freshwater input during 1997/98 favoured nitrogen during periods of high flow, but was markedly N-defi-cient during low flow periods in summer and autumn (Fig. 2c). Apart from the input at Pulo do Lobo, the
estuary is subject to other minor mid-estuarine fresh-water-loading from tributaries (particularly the Ode-leite stream), while other major inputs include sewage, mainly near the mouth, where the population density is highest, with the cities of Ayamonte and Vila Real de Santo António.
Sampling. Sampling stations (Fig. 1) were estab-lished along a longitudinal transect covering the salt intrusion zone along the lower Guadiana from the river plume (Stn P) to Alcoutim (Stn 10). Field campaigns started in October and November 1996, as part of a preliminary study, and extended throughout March, April, May, June, July, September and December 1997, ending in March 1998. The primary objective was to characterize the nutritional status of the Guadiana during high-productivity periods. Field surveys were timed to cover the period around high tide (± 2 h). They started at the seaward end (Stn P) 1 to 2 h before high water. The objective was to sample freshwater at the time of high tide. This strategy accomplished the double objective of sampling when tidal velocities
Fig. 1. Location of sampling stations in the Guadiana River and estuary during sampling surveys in 1996 to 1998
Fr eshw ater Di schar ge ( 1 0 6 m 3) 0 1000 2000 3000 4000 5000 Monthly Discharge Historical mean DIN Loadi n g (tonnes ) 0 2000 4000 6000 8000 DRP Loadi n g (tonnes) 0 100 200 300 400 500 N P N: P r a ti o 1 10 100 1000 Monthly discharge Redfield ratio 1999 1997 1998 1996 1995 1994
Fig. 2. Data from the hydrological station of Pulo do Lobo (main freshwater input into the Guadiana estuary). (a) Com-parison between mean monthly discharges from 1994 to 1998 with historical mean, derived from data taken since begin-ning of the 20th century. (b) Total dissolved load of DIN (dis-solved inorganic nitrogen, NO3–+ NO2–+ NH4+) and DRP (dis-solved reactive phosphorus, measured as orthophosphate) introduced with the freshwater input at Pulo do Lobo in the biennium 1997 onto 1998. (c) Aggregate mean monthly load-ing of nitrogen and phosphorus at Pulo do Lobo in the bien-nium 1997 to 1998, plotted as the ratio of availability in the water column and compared with the Redfield ratio (N:P = 16)
a
b
were lower, thus reducing the possibility of sample streaming.
All surveys were undertaken from small boats; con-ductivity and temperature measurements were made at every station with Field CT meters (YSI-30 and WTW LF196) calibrated with seawater standard solu-tions. At every station, a van Dorn 8 l sampling bottle was used to sample water at 1 m depth for subsequent determination of dissolved oxygen, ammonium, nitrate (occasionally nitrite), phosphorus, silicate and sus-pended solids. Dissolved oxygen samples were col-lected, preserved and analysed by the Winkler method (Parsons et al. 1984). On board ship, samples for nutri-ent concnutri-entration were pre-filtered through cellulose acetate filters (porosity = 0.45 µm). Filtered samples were treated with mercuric chloride to a final concen-tration of 20 mg l–1(Oremland & Capone 1988,
Kirk-wood 1992) and chilled (4°C) until analysis by a SKALAR 4-channel seawater segmented flow analyser with routine spectrophotometric methods, modified for variable salinity.
Filtration for chlorophyll determination was also per-formed on board: 200 ml of water was filtered under low pressure (<100 mm Hg) in the dark (to avoid photo-degradation of pigments) through Whatman GF/F fil-ters. The filters were then folded, frozen and subse-quently extracted with aqueous ethanol (96%) for 24 h. Pigment concentration was determined by spectrofluo-rometry at 664 nm with excitation at 425 nm (Baltic Sea Environmental Proceedings 1988).
Water samples for the enumeration of picophyto-plankton, nanophytoplankton and microflagellates other than dinoflagellates were preserved with glu-taraldeyde (2% v/v final concentration), stained with proflavine (1% v/v), and gently filtered (< 50 mm Hg) onto 0.4 µm black Nuclepore filters. Filters were mounted in glass slides with immersion oil (Cargille Type A). All preparations were made within 24 h of sampling and stored at –10°C to mimimize the loss of autofluorescence. A minimum of 50 random fields or 200 cells was counted at 600×to 1250×magnification with a Leitz Laborlux epifluorescence microscope equipped with blue light illumination (Haas 1982). Samples for the enumeration of micro (> 20 µm) diatoms and dinoflagellates were preserved with acid Lugol, sedimented in sedimentation chambers for 24 to 48 h, and observed at 200×to 400×magnification with a Wild inverted microscope (Utermöhl 1958). More than 100 cells of the most common taxa were counted (Lund et al. 1958). The dimensions of a minimum of 50 randomly selected individuals of each species/group were mea-sured using a calibrated ocular micrometer, and bio-volume estimates were calculated from linear dimen-sions using appropriate geometric configurations (Edler 1979). The cell volumes of diatoms and dinoflagellates
were subsequently converted to carbon biomass using the allometric relations of Strathmann (1967). The bio-mass of freshwater chlorophytes and cyanobacteria was calculated according to Rocha & Duncan (1985), and the biomass of the remaining phytoplanktonic cells according to Verity et al. (1992).
RESULTS
Temperature and salinity
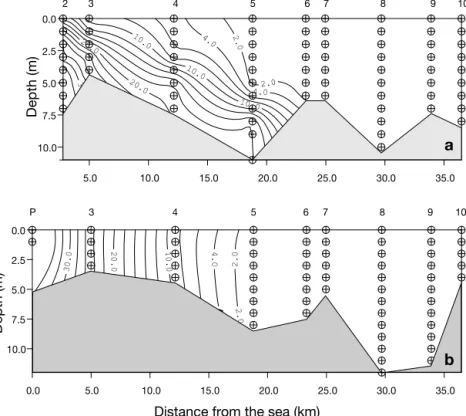
The freshwater temperature data showed a pre-dictable seasonal pattern, with lowest temperatures (11 to 14°C) in December and highest temperatures in summer (25 to 28°C), at which time coastal waters where colder (vice-versa in winter). The vertical tem-perature structure was always homogeneous, with little or no vertical gradient observed in the dilution zone. The extent of saltwater penetration into the estu-ary (Fig. 3) was relatively stable during the spring-autumn period, corresponding to low freshwater dis-charge (March to October: see Fig. 2a). However, in winter during high discharge periods, virtually no salinity structure was observed within the estuary, with values as low as 14 PSU measured in the estuar-ine plume zone in December. Therefore, the Guadiana is a freshwater-dominated estuary only in periods of very high flow in winter, while for the spring-autumn period the salinity distribution is controlled by the tides, with strong vertical mixing during spring tides (Fig. 3b) and a salt-wedge forming only during neap tides (Fig. 3a). The maximum extent of the dilution zone was always less than 40 km, never extending further than the town of Alcoutim.
Phytoplankton
Seasonal trends in chlorophylla concentrations in the estuary followed a clear pattern, with maxima dur-ing sprdur-ing and late summer and minima in winter and late spring. A clear freshwater chlorophyll maximum was observed throughout the year (Table 1), with recorded levels surpassing 40 mg m– 3 during early
spring; minimum concentrations were observed at the saline water influence zone in winter and late spring.
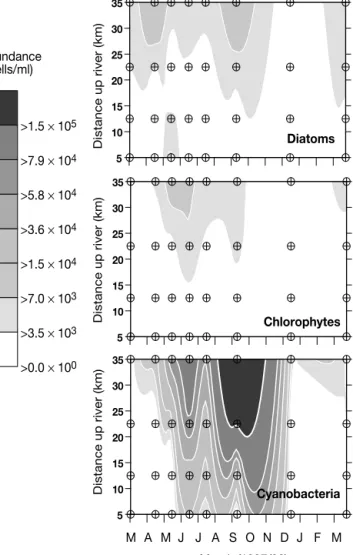
Longitudinal distributions of abundance, plotted to highlight the succession of 3 major groups (diatoms, chlorophytes and cyanobacteria), combined with sea-sonal variability, revealed a pattern of successive blooms of different phytoplankton assemblages was evidenced throughout 1997 (Fig. 4). Diatoms dominated an early spring bloom in March and April. Following the de-crease in diatom abundance, a chlorophyte and then a
cyanobacteria bloom quickly followed during late spring through to early summer. From July to September, a major cyano-bacteria bloom developed in the freshwater zone. By late summer, a secondary diatom bloom had also developed in the higher reaches of the estuary. In terms of abun-dance, chain-forming nanodiatoms domi-nated the early spring diatom bloom in the low-salinity regions (max. 18 ×103cells
ml–1), while the subsequent chlorophyte
bloom (max. 11 ×103cells ml–1) comprised
mainly the freshwater species Mono-raphidium contortum, Micractinium pusi-lum, Scenedesmus spp. and Pediastrum spp. The first cyanobacteria bloom (> 6 × 10⁴ cells ml–1) in mid-June was
domi-nated by the filamentous Oscillatoria spp. and unicellular colony-formingMicrocystis spp. However, the potentially toxic Micro-cystis spp. dominated the ensuing summer and fall cyanobacteria bloom, with a total abundance higher than 4 ×10⁵cells ml–1
at Alcoutim (Stn 10). The secondary di-atom and chlorophyte blooms of late summer (September) were small compared to the cyanobacteria proliferation, with abundances 2 and 3 orders of magnitude lower than that of cyanobacteria, respec-tively.
Nutrient status
Table 1 shows nutrient concentrations at selected sampling stations during the survey period, representing a geographi-cal gradient from the freshwater end-member (Stn 10) through the mid-salinity range (Stn 5) to the saline end-member of the estuary (Stn 2). Dissolved reactive sili-cate (DSi, measured as silisili-cate, H4SiO4)
peaked at all stations during winter flush-ing of the estuary by freshwater dis-charge, with levels occasionally surpass-ing 200 µmol dm– 3. However, during the
productive period (spring-fall) DSi con-centrations were usually less than 5 µmol dm– 3, except in September, when
dis-solved levels started to recover. Con-centrations below 1 µmol dm– 3were
mea-sured during early summer in June, oc-curring in the low-salinity regions of the estuary (Stns 10 through 6). Although a pulse input at Stn 6 (Odeleite stream) was
0.0 5.0 10.0 15.0 20.0 25.0 30.0 35.0
Distance from the sea (km)
10.0 7.5 5.0 2.5 0.0 Depth (m) Depth (m) 5 6 7 8 9 10 4 3 P 5.0 10.0 15.0 20.0 25.0 30.0 35.0 10.0 7.5 5.0 2.5 0.0 2 3 4 5 6 7 8 9 10
a
b
Fig. 3. Interpolation plot showing salinity structure along the surveyed sec-tion of the Guadiana estuary, during neap tide (a) and spring tide (b) in March 1997. ( ) Sampling depths; numbers on top abscissas: sampling
stations
Table 1. Nutrient concentrations at selected sampling stations during the survey period, representing a geographical gradient from the freshwater end-member (Stn 10), through the mid-salinity range (Stn 5) to the saline end-member of the estuary (Stn 2). Samples collected at 1 m depth. Sal: sal-inity; DSi: dissolved reactive silicate; DRP: dissolved reactive phosphorus;
DIN: dissolved inorganic nitrogen; nd: not determined
Apr May Jun Jul Sep Dec Mar
97 97 97 97 97 97 98 High-estuary (Stn 10) Sal (PSU) 0.004 0.005 0.004 0.005 0.52 nd 0.10 DSi (µM) 3.85 3.46 0.21 4.81 28.4 176 1.00 DRP (µM) 1.21 8.72 1.81 2.78 0.92 0.37 0.02 DIN (µM) 61.2 26.4 4.09 2.37 11.7 67.3 86.4 Chla (µg l–1) 14.9 4.08 7.63 22.5 30.5 2.10 35.6 Mid-estuary (Stn 5) Sal (PSU) 3.16 1.74 0.94 1.17 2.01 nd 0.10 DSi (µM) 9.04 1.07 0.21 1.86 9.52 215 6.40 DRP (µM) 1.27 5.48 0.50 0.31 1.78 2.80 0.02 DIN (µM) 54.3 41.8 2.79 0.73 0.56 91.5 84.2 Chla (µg l–1) 5.78 1.11 1.34 15.6 19.4 1.88 30.6 Low-estuary (Stn 2) Sal (PSU) 16.35 15.9 10.73 12.44 22.73 6.50 12.30 DSi (µM) 6.88 0.50 0.45 1.36 5.77 124 1.40 DRP (µM) 0.53 22.7 0.13 0.13 1.00 1.94 0.10 DIN (µM) 35.0 26.4 1.20 2.53 5.92 62.4 110 Chla (µg l–1) 5.96 0.93 2.15 9.33 8.21 1.92 15.7
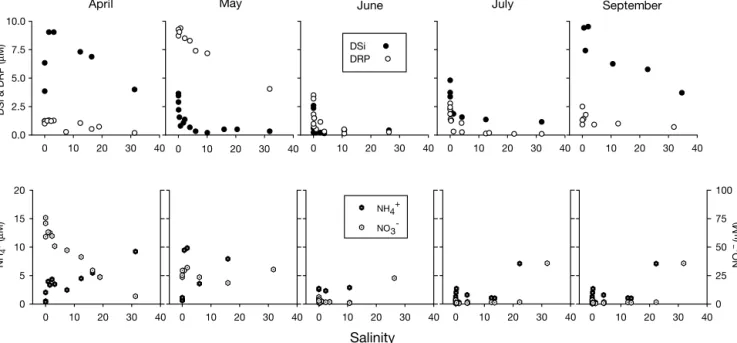
evidenced by the nutrient-salinity relationships for April (Fig. 5), which affect the dilution gradient down-stream, DSi concentrations were extremely low in the dilution zone throughout the spring-fall period, when the most important algal blooms developed (Fig. 4). From May to July, the measured gradient (compared to theoretical dilution lines: Liss 1976) evidenced heavy water-column removal of DSi starting in the low-salinity zone. DSi in the water column evidenced mild recovery in September, probably due to the remineralisation of sedimented diatom frustules from the early spring bloom. The removal of DSi from the water column revealed by the nutrient-salinity plots (Fig. 5), in parallel with the observed development of a secondary diatom bloom in late summer (Fig. 4), indicated that diatoms grew in response to this new input.
Concentrations of dissolved reactive phosphate (DRP, measured as orthophosphate) were quite high (> 5 µmol dm– 3) during late spring in the whole estuary,
while during the rest of the year they remained below 2 µmol dm– 3. Concentrations ranged from minima close
to detection levels (0.02 µmol dm– 3) in early spring in
1998 in the low-salinity areas to maxima of over 8 µmol dm– 3in the freshwater-influenced zone in May 1997.
The increase in phosphorus availability in the water column in May (Fig. 5) was an effect of the relatively high phosphorus loading at Pulo do Lobo (Fig. 2c) dur-ing this month. Blooms of both green and blue-green algae during June (Fig. 4) seemed to benefit from this additional P availability, as evidenced by its removal from the water column (evident from the nutrient salin-ity plots in Fig. 5). Furthermore, the significant positive correlations between phosphorus availability and bio-mass of both chlorophytes and cyanobacteria (Table 2), suggest that growth of these 2 groups was phosphorus-limited before May/June. Evidence of heavy imbal-ance in favour of N enrichment (highest N:P ratio of the year) at the loading point (Fig. 2c) during winter 1997 corroborates this interpretation of the data.
Dissolved inorganic nitrogen (DIN, representing the summation of NO3–, NO2–and NH4+) followed the
vari-ation in nitrogen freshwater-loading (Fig. 2b,c), as evidenced by a strong positive correlation between nitrate and discharge at Alcoutim (Stn 10), with mini-mum concentrations in summer, during periods of low freshwater flow, and maximum concentrations in win-ter, when discharge was highest (Fig. 2a,c). Concentra-tions ranged from a minimum of 0.56 µmol dm– 3 in
mid-estuarine regions and maxima of 110 µmol dm– 3
near the estuarine mouth. The high DIN concentra-tions near the estuarine mouth (Fig. 5) were heavily influenced by high ammonium concentrations, proba-bly linked to the anthropogenic effect of the markedly seasonal sewage-effluent plumes from the towns of Vila Real and Ayamonte (Fig. 1).
Table 2. Spearman’s rank-correlation coefficient of biological and chemical variables at Stn 10 (Alcoutim) during the survey period. ***p < 0.001, *p < 0.05. DRP: dissolved reactive
phos-phorus; chloro: chlorophytes; cyano: cyanobacteria
DRP Nitrate Biomass Biomass
chloro cyano Discharge –0.620* –0.874*** –0.700* –0.550– (n = 10) (n = 8) (n = 9) (n = 9) DRP –0.452 –0.750* –0.683* (n = 8) (n = 9) (n = 9) Nitrate –0.786* –0.571– (n = 7) (n = 7) Biomass chloro – ––0.900*** (n = 9) Month (1997/98) 5 10 15 20 25 30 35 Distance up river (km) Distance up river (km) Distance up river (km) Cyanobacteria M A M J J A S O N D J F M 5 10 15 20 25 30 35 Chlorophytes 5 10 15 20 25 30 35 Diatoms >0.0 × 100 >3.5 × 10³ >7.0 × 10³ >1.5 × 10⁴ >3.6 × 10⁴ >5.8 × 10⁴ >7.9 × 10⁴ >1.5 × 10⁵ Abundance (cells/ml)
Fig. 4. Interpolation plots aggregating longitudinal and sea-sonal distribution of phytoplankton abundances of specific groups (diatoms, chlorophytes and cyanobacteria) at selected sampling stations, representing a salinity gradient within the
DISCUSSION
Spring transition: diatom to non-diatom assemblages
During 1997, the phytoplankton succession in the Guadiana estuary showed a clear transition from a diatom-dominated early spring bloom to absolute dom-inance of cyanobacteria in summer. Although there was a secondary diatom bloom by September (Fig. 4), as a result of a fresh input of dissolved silicate (Fig. 5), cell densities were quite low compared to those of the cyanobacteria. The enrichment of catchment areas in N and P (but not Si) caused by human activities (cul-tural eutrophication) has been hypothesised as leading to a shift from diatom-based to non-diatom-based phy-toplankton foodwebs (Officer & Ryther 1980, Ryther & Officer 1981). This transition has been frequently attributed to enhanced growth of diatoms in response to increased N and P availability and a resultant ex-haustion of DSi supplies (Schelske & Stoermer 1971, Smayda 1990, Egge & Asknes 1992).
Very high freshwater inputs of N and P (Fig. 2b,c), and even DSi (Table 1) were observed during winter, with a subsequent high freshwater discharge, deple-tion of dissolved silicate from May to July, and the col-lapse of the spring diatom bloom, suggesting that spe-cific nutrient availability during the productive period exerted a tight control over the phytoplankton succes-sion in the estuary. Since transition of ecosystems from siliceous-based to non-siliceous-based phytoplanktonic communities has been associated with a deleterious effect on water quality (Smayda 1990, Turner &
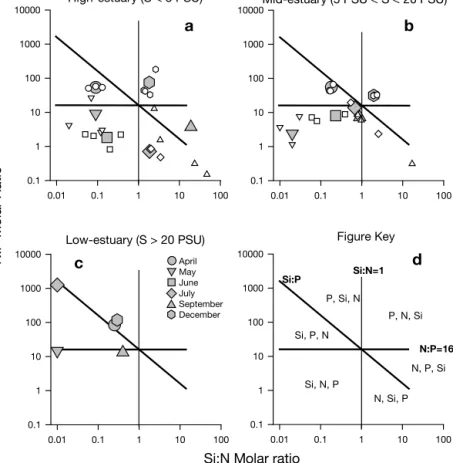
Raba-lais 1994), the potential resource limitation effect on phytoplankton growth will be discussed in regard to the composition of diatomaceous organic matter. The accepted standard molar ratios between DIN, DSi and DRP for marine diatom biomass growth is Si:N:P = 16:16:1 (Redfield et al. 1963, Brzezinski 1985). These ratios are within the minimum-scale range for fresh-water phytoplankton, since it has been shown that dis-solved silicate demand by freshwater diatoms is higher than that by marine species (Paasche 1980). In Fig. 6, molar quotients between the in situ concentrations of potentially limiting nutrients are delimited by the Si:N = 1, N:P = 16 and Si:P = 16 lines. These define 6 different areas within Fig. 6, with each characterized by the potentially limiting nutrients in order of priority (see Fig. 6d). It should be emphasized that no sugges-tion is being made that nutrient ratios per se were the defining environmental variable conditioning bloom succession (Bulgakov & Levitch 1999, Smith & Bennett 1999). These ratios are merely used to define resource availability (Sommer 1993, del Amo et al. 1997) as the consequence of loading and biotic activity (Reynolds 1999, Sommer 1999).
The relative proportion of available nutrients evi-dences a clear cycle during the productive period in the low-salinity zone (Fig. 6a). As a consequence of the di-atom bloom in March and April (Fig. 4), DSi depletion occurred in the whole estuary in May (Fig. 5), with avail-able concentrations falling below reported half-satura-tion constants for DSi incorporahalf-satura-tion by diatoms (marine and coastal diatoms: Km= 1 to 5 µM [Fisher et al. 1988]
and 0.03 to 3.37 µM [Dortch & Whitledge 1992]; fresh-Salinity 0 10 20 30 40 0 10 20 30 40 NH 4 + ( µ M) NO 3 – (µ M) 0 5 10 15 20 NH4+ NO3 -0 10 20 30 40 0 10 20 30 40 0 10 20 30 40 0 10 20 30 40 DSi & DRP ( µ M) 0.0 2.5 5.0 7.5 10.0 DSi DRP
April May June July September
0 10 20 30 40 0 25 50 75 100 0 10 20 30 40 0 10 20 30 40 0 10 20 30 40
water diatoms: Km= 0.12 to 1.5 µM for centric diatoms
and 1.5 to 19.5 µM for other species; Tilman et al. 1982). This is clear from Fig. 6a, where resource ratios fall into the region in which DSi limitation is most likely to occur.
In short, water-column consumption by phytoplank-ton in the low-salinity zone conditioned nutrient con-centrations downriver from Alcoutim (Fig. 5). DSi was the nutrient most likely to be limiting after the March/ April bloom in brackish (Fig. 6b) and saline areas (Fig. 6c) of the estuary, with very low Si:N and Si:P availability ratios (0.01 < Si:N < 0.13; 0.001 < Si:P < 0.04). The results indicate, therefore, that phytoplankton consumption, as well as low nutrient-loading, condi-tioned the succession of phytoplankton species in the Guadiana estuary on both a temporal and a spatial scale, as reported for other similar systems (Fisher et al. 1988, 1992, Cloern 1991, 1996). Clearly, low relative DSi availability in early spring in the Guadiana
con-tributed to the observed succession in spe-cies domination, when diatoms exhausted the resource, influencing the subsequent species composition in the estuary. This observation is similar to those in Lake Michigan by Schelske & Stoermer (1971), the North Sea by Smayda (1990), and in the Mississippi River delta by Turner & Rabalais (1994).
Summer dominance: greens or blue-greens?
During the spring-summer transition, after the collapse of the early spring diatom population, a chlorophyte bloom devel-oped (Fig. 4). Higher phosphorus concen-trations in May (Fig. 5), probably because of delayed availability (Fig. 2b,c), could ex-plain (chlorophyte biomass correlates posi-tively with phosphorus availability: Table 2) the enhanced growth of this phytoplank-ton assemblage (Fig. 4). The question that arises for the Guadiana estuary is there-fore, once low DSi restricts diatoms, why do the cyanobacteria dominate summer populations, and not green algae?
The sequence of summer dominance is generally accepted to be the result of graz-ing selectivity and multispecies competi-tion for available nutrients (Sommer 1989), occasionally modulated by temperature (Tilman et al. 1981, Tilman & Kiesling 1984, Paerl 1988, Grover et al. 1999). Dur-ing May and June, the relative nutrient availability in the Guadiana estuary falls within the N limiting area (Fig. 6), with low N:P ratios (0.82 to 7.6). Freshwater blue-green and green algae have relatively low P requirements (Km= 0.03 to 1.89
µM: Tilman et al. 1982), and phosphorus is available above these concentrations during the spring-summer transition (Fig. 5, Table 1). However, literature evi-dence suggests that green algae are the poorest N competitors, but dominate over cyanobacteria in P competition (Sommer 1989). As a consequence, they tend have a competitive advantage in ecosystems with low Si:P, but high N:P availability ratios. Even at non-steady state (Sommer 1985), under pulsed conditions, green algae are specially adapted to scavenge avail-able phosphorus both for rapid growth (Scenedesmus spp. and Chlorella spp. are r-strategists) and P storage (Pediastrum spp. is a K-strategist). Conversely, cyano-bacteria have other advantages, especially in condi-tions favouring P over N availability (Fig. 6). During
0.01 0.1 1 10 100 0.1 1 10 100 1000 10000
Si:N Molar ratio
0.01 0.1 1 10 100 0.1 1 10 100 1000 10000 0.01 0.1 1 10 100 N:P M o lar Ratio 0.1 1 10 100 1000 10000
High-estuary (S < 5 PSU) Mid-estuary (5 PSU < S < 20 PSU)
Low-estuary (S > 20 PSU) 0.01 0.1 1 10 100 0.1 1 10 100 1000 10000 N:P=16 Si:N=1 Si:P Figure Key P, Si, N Si, P, N Si, N, P N, Si, P N, P, Si P, N, Si
a
b
c
Aprild
May June July September DecemberFig. 6. Si:N:P molar ratios in the water column of the Guadiana estuary in 1997. Grey symbols: average values from representative stations during a specific month; smaller, white symbols: individual measurements at a spe-cific station. (a) Sampling stations located within low salinity zone (Stns 6, 7, 8 and 10); (b) sampling stations located within the average salinity zone (Stns 5, 4 and 3 and occasionally Stn 2); (c) estuarine plume zone (Stn P). Horizontal and vertical lines: Redfield et al. (1963) ratio (N:P) and Brzezinski (1985) ratio (N:Si), respectively. Diagonal line: aggregate ratio (Si:N:P = 16:16:1). (d) Figure key. For further details and explanation, see ‘Discussion’
the spring-summer transition, and up until early fall, nitrogen was increasingly scarce in the higher reaches of the Guadiana estuary (Figs. 2c, 5 & 6), water tem-peratures were quite high (> 21°C, occasionally > 25°C), and light availability in the water column quite low (extinction coefficient = 2.5 to 3 m–1, based on Secchi
depth).
Cyanobacteria have been described as the favoured taxa under high (> 21°C) temperatures, both in labo-ratory experiments (Tilman & Kiesling 1984) and in field conditions (Paerl 1988). In the resource environ-ment described above for the Guadiana estuary, although the spring-summer transition can be domi-nated by chlorophytes, eventually cyanobacteria pre-dominate (see Grover et al. 1999 and references therein). In fact, apart from being favoured by low N:P ratios and high temperatures, cyanobacteria pos-sess the advantage over chlorophytes of being less affected by loss factors due to grazing (Sterner 1989) and sedimentation (Sommer 1989). Cyanobacteria, especially colony-forming species (Microcystis spp.), are nearly impervious to sedimentation losses, and are excellent light competitors in turbid water columns because of their capacity to regulate buoy-ancy (Sommer 1989). In addition, they constitute a poor food source for zooplankton in regard to nutri-tious value and toxin defensiveness (DeMott & Muller-Navarra 1997, DeMott 1998), and are able to form large, bulky colonies (Fulton & Paerl 1987). Con-sequently, reduced grazing and sedimentation losses, as well as low light availability, will benefit cyano-bacteria over other taxa in a multispecies assem-blage. In addition, Microcystis spp. appears to be a ‘storage specialist’ of nitrogen (K-strategist), which would confer higher long-term survivability over chlorophytes under conditions of low N:P resource availability (Sakshaug & Olsen 1986, Kilham & Hecky 1988). In this way, environmental conditions in the Guadiana estuary in the spring-fall of 1997 favoured cyanobacteria predominance in the summer, espe-cially in the upper reaches of the estuary.
Concluding remarks
Earlier studies (1980 to 1985) in the Guadiana estu-ary revealed the occurrence of cyanobacteria blooms in association with high nitrogen and phosphorus levels, particularly in years of low freshwater-loading (Cabeçadas & Brogueira 1981, Oliveira 1985). Since the 1980s, cyanobacteria blooms have been increas-ingly frequent (Oliveira 1991, Vasconcelos 1993, INTERREG-II 2000), despite a large range of annual freshwater-discharge rates during this period (INTER-REG-II 2000).
Apart from the deleterious effect of the observed transition to a non-siliceous, phytoplankton-dominated ecosystem (Smayda 1990), with its long-term effects on water quality and on the economical value of this re-source, noxious summer blooms present a more direct and serious health hazard (Chorus & Bartram 1999) to local human populations. This study confirms the con-clusions of previous work (Cabeçadas & Brogueira 1981, Oliveira 1985, 1991) indicating that the majority of cyanobacteria comprising the summer blooms in the Guadiana estuary are potential toxin producers (Micro-cystis spp. and Anabaena spp.). Their presence has been related to fish mortality (Oliveira 1991), and to outbreaks of gastroenteritis in the local population (Vasconcelos 1993). The association between low rela-tive DSi-loading and summer cyanobacteria blooms de-scribed in this paper cannot be dissociated from 2 possi-ble causal agents: cultural eutrophication, represented by the enrichment in DIN and DRP through agricultural activities in the catchment areas (Officer & Ryther 1980, Smayda 1990), and water retention by the cascading effect of more than 40 dams in the Guadiana drainage basin, which regulate approximately 75% of the water flow (Morales 1997). In fact, the trapping of water and sediments by dams, among other effects (Milliman 1997), has been shown to reduce nutrient-loadings through the removal of reservoir sediments (van Ben-nekom & Salomons 1981), specifically affecting the dis-solved-silicate-loading (due to enhanced retention of Si) into receiving estuaries and coastal seas (Humborg et al. 1997), and thereby disturbing the ecosystem structure by conditioning diatom growth (Officer & Ryther 1980, Smayda 1990, Turner & Rabalais 1994, Humborg et al. 1997). In view of the ongoing construc-tion of the Alqueva dam complex, which will further increase the regulation of water flow in the Guadiana drainage basin to a disturbing 81%, the results pre-sented here are particularly important, and should be carefully considered in overall environmental and socio-economical impact estimates.
Acknowledgements. Research for this paper was co-financed
by INTERREG-II (Study of Cyanobacteria Blooms in Response to Discharge Variability in the Guadiana, contract number 16/REGII/6/96; General Characterization of the Guadiana Estuary as Basis for the Evaluation of Environmental Change, contract number 15/REGII/6/96). Technical support during the fieldwork by Rita Baptista, Sandra Caetano, Raquel Coim-bra, Claudia Miguel, Pedro Mendes, Sandra Mesquita and Pedro Morais is gratefully acknowledged. Special thanks are due to Sandra Caetano for carrying out the epifluores-cence work and to Claudia Miguel for the inverse microscopy. The Portuguese National Foundation for Science and Tech-nology (FCT) provided funding for C.R. through contract PRAXIS XXI/BPD/18849/98. Thanks are due to 3 anonymous reviewers, whose comments helped to improve the original manuscript.
LITERATURE CITED
Baltic Sea Environmental Proceedings (1988) Guidelines for the Baltic Monitoring program for the Third Stage. Biolog-ical Determinands No. 27. D: Baltic Marine Environment Protection Commission, Helsinki
Brzezinski MA (1985) The Si:C:N ratio of marine diatoms: interspecific variability and the effect of some environ-mental variables. J Phycol 21:347–357
Bulgakov NG, Levitch AP (1999) The nitrogen:phosphorus ratio as a factor regulating phytoplankton community struc-ture. Arch Hydrobiol 146:3–22
Cabeçadas G, Brogueira MJ (1981) Notas sobre a qualidade da água do Rio Guadiana. Internal report No. 42, IPIMAR, National Institute for Fisheries and Marine Research, Lisbon (in Portuguese)
Chorus I, Bartram J (1999) Toxic cyanobacteria in water — a guide to their public health consequences, monitoring and management. Published on behalf of the World Health Organization, E & FN Spon, London
Cloern JE (1991) Annual variations in river flow and primary production in the South San Francisco Bay estuary. In: Elliot M, Ducrotoy JP (eds) Estuaries and coasts: spatial and temporal intercomparisions. Olsen & Olsen, Fredens-borg, p 91–96
Cloern JE (1996) Phytoplankton bloom dynamics in coastal ecosystems: a review of some general lessons from sus-tained investigation of San Francisco Bay, California. Rev Geophys 34:127–168
Conley DJ, Schelske CL, Stoermer EF (1993) Modification of the biogeochemical cycle of silica with eutrophication. Mar Ecol Prog Ser 101:179–192
del Amo Y, Le Pape O, Tréguer P, Quéguiner B, Ménesguen A, Aminot A (1997) Impacts of high-nitrate freshwater inputs on macrotidal ecosystems. I. Seasonal evolution of nutrient limitation for the diatom dominated phytoplankton of the Bay of Brest (France). Mar Ecol Prog Ser 161:213–224 DeMott WR (1998) Utilization of a cyanobacterium and a
phosphorus-defficient green alga as complementary re-sources by daphnids. Ecology 79:2463–2481
DeMott WR, Muller-Navarra DC (1997) The importance of highly unsaturated fatty acids in zooplankton nutrition: evidence from experiments with Daphnia, a
cyanobac-terium and lipid emulsions. Freshw Biol 38:649–664 Dortch Q, Whitledge TE (1992) Does nitrogen or silicon limit
phytoplankton production in the Mississippi River plume and nearby regions? Cont Shelf Res 12:1293–1309 Edler L (1979) Recommendations on methods for marine
bio-logical studies on the Baltic Sea. Phytoplankton and chlorophyll. Publ Baltic Mar Biol 5:1–38
Egge JK, Aksnes DL (1992) Silicate as regulating nutrient in phytoplankton competition. Mar Ecol Prog Ser 83:281–289 Fisher TR, Harding LW Jr, Stanley DW, Ward LG (1988) Phyto-plankton, nutrients and turbidity in the Chesapeake, Dela-ware and Hudson estuaries. Estuar Coast Shelf Sci 27:61–93 Fisher TR, Peel ER, Ammerman JW, Harding LW Jr (1992) Nutrient limitation of phytoplankton in Chesapeake Bay. Mar Ecol Prog Ser 82:51–63
Fulton RS III, Paerl HW (1987) Effects of colonial morpho-logy on zooplankton utilization of algal resources during blue-green algal (Microcystis aeruginosa) blooms. Limnol
Oceanogr 32:634–644
Granéli E, Carlsson P, Turner JF, Tester PA, Béchemin C, Daw-son R, Funari E (1999) Effects of N:P:Si ratios and zooplank-ton grazing on phytoplankzooplank-ton communities in the northern Adriatic Sea. I. Nutrients, phytoplankton biomass, and poly-saccharide production. Aquat Microb Ecol 18:37–54
Grover JP, Sterner RW, Robinson JL (1999) Algal growth in warm temperate reservoirs: nutrient-dependent kinetics of individual taxa and seasonal patterns of dominance. Arch Hydrobiol 145:1–23
Haas LW (1982) Improved epifluorescence microscopy for observing planktonic microorganisms. Ann Inst Océanogr 58(Suppl):261–266
Humborg C, Ittekkot V, Cociasu A, von Bodungen B (1997) Effect of the Danube River dam on Black Sea biogeo-chemistry and ecosystem structure. Nature 386:385–388 INTERREG-II (2000) Estudo dos ‘blooms’ de cianobactérias
associados a variações de caudal no Rio Guadiana (Study of cyanobacteria blooms associated with discharge varia-tions in the Guadiana River). Contract No. 16/REG II/6/96, Final report University of Algarve, Faro (in Portuguese) Kilham P, Hecky RE (1988) Comparative ecology of marine and
freshwater phytoplankton. Limnol Oceanogr 33(4, Part 2): 776–795
Kirkwood DS (1992) Stability of solutions of nutrients salts during storage. Mar Chem 38:151–164
Liss PS (1976) Conservative and non-conservative behaviour of dissolved constituents during estuarine mixing. In: Burton JD, Liss PS (eds) Estuarine chemistry. Academic Press, London, p 93–127
Lund JWG, Kipling C, Le Cren ED (1958) The inverted micro-scope method of estimating algal numbers and the statisti-cal basis of estimations made by counting. Hydrobiologia 11:143–170
Milliman JD (1997) Blessed dams or damned dams? Nature 386:325–327
Morales JA (1997) Evolution and facies architecture of the mesotidal Guadiana River delta (S.W. Spain-Portugal). Mar Geol 138:127–148
Officer CB, Ryther JH (1980) The possible importance of sili-con in marine eutrophication. Mar Ecol Prog Ser 3:83–91 Oliveira MRL (1985) Relatório dos estudos biológicos realiza-dos no rio Guadiana e na estação de tratamento de águas da Vila de Mértola. Internal report No. 103, IPIMAR, National Institute for Fisheries and Marine Research, Lis-bon (in Portuguese)
Oliveira MRL (1991) Eutrofização do Rio Guadiana — ‘blooms’ de Cyanophyceae e influência na ictiofauna; techn Sci Rep 42. IPIMAR, National Institute for Fisheries and Marine Research, Lisbon (in Portuguese)
Oremland RS, Capone DS (1988) Use of ‘specific’ inhibitors in biogeochemistry and microbial ecology. Adv Microb Ecol 10:286–383
Paasche E (1980) Silicon. In: Morris I (ed) The physiological ecology of phytoplankton. Blackwell, Oxford, p 258–284 Paerl HW (1988) Growth and reproductive strategies of
fresh-water blue-green algae (cyanobacteria). In: Sandgren CD (ed) Growth and reproductive strategies of freshwater phytoplankton. Cambridge University Press, Cambridge, p 261–315
Parsons TR, Maita Y, Lalli CM (1984) A manual of chemical and biological methods for seawater analysis. Pergamon Press, Oxford
Redfield AC, Ketchum BH, Richards FA (1963) The influence of organisms in the composition of seawater. In: Hill MN (ed) The sea, Vol II. Wiley, New York, p 26–77
Reynolds CS (1999) Non-determinism to probability, or N:P in the community ecology of phytoplankton. Arch Hydrobiol 146:23–35
Rocha O, Duncan A (1985) The relationship between cell car-bon and cell volume in freshwater algal species used in zooplankton studies. J Plankton Res 7:279–294
water uses. In: Neilson, BJ, Cronin LE (eds) Estuaries and nutrients. Humana Press, Clifton, NJ, p 247–261
Sakshaug E, Olsen Y (1986) Nutrient status of phytoplankton blooms in norwegian waters and algal strategies for nutri-ent competition. Can J Fish Aquat Sci 43:389–396 Schelske CL, Stoermer EF (1971) Eutrophication, silica
deple-tion and predicted changes in algal quality in Lake Michi-gan. Science 173:423–424
Smayda TJ (1990) Novel and nuisance phytoplankton blooms in the sea: evidence of a global epidemic. In: Granéli E, Sundstrom B, Edler L, Anderson D (eds) Toxic marine phytoplankton. Elsevier, New York, p 29–40
Smith VH, Bennett SJ (1999) Nitrogen: phosphorus supply ratios and phytoplankton community structure in lakes. Arch Hydrobiol 146:37–53
Sommer U (1985) Comparison between steady-state and and non steadystate competition: experiments with natural phytoplankton. Limnol Oceanogr 30:335–346
Sommer U (1989) The role of Competition for Resources in Phytoplankton succession. In: Sommer U (ed) Plankton ecology — succession in plankton communities. Brock/ Springer Series in Contemporary Bioscience, Springer-Verlag, Berlin, p 57–106
Sommer U (1993) Phytoplankton competition in Plußsee: a field test of the resource ratio hypothesis. Limnol Ocean-ogr 38:838–845
Sommer U (1999) A comment on the proper use of nutrient ratios in microalgal ecology. Arch Hydrobiol 146:23–35 Sterner RW (1989) The role of grazers in phytoplankton
suc-cession. In: Sommer U (ed) Plankton ecology — succession in plankton communities. Brock/Springer Series in Con-temporary Bioscience. Springer-Verlag, Berlin, p 107–170
Strathmann RR (1967) Estimating the organic carbon content of phytoplankton from cell volume or plasma volume. Limnol Oceanogr 12:411–418
Tilman D (1981) Test of resource competition theory using four species of Lake Michigan algae. Ecology 62:802–815 Tilman D, Kiesling RL (1984) Freshwater algal taxonomy: taxonomic tradeoffs in the temperature dependence of nutrient competitive abilities. In: Klug MJ, Reddy CA (eds) Current perspectives in microbial ecology. American So-ciety of Microbiology, Washington, DC, p 314–319 Tilman D, Matston M, Langer S (1981) Competition and
nutri-ent kinetics along a temperature gradinutri-ent: an experi-mental test of mechanistic approach to niche theory. Lim-nol Oceanogr 26:1020–1033
Tilman D, Kilham SS, Kilham P (1982) Phytoplankton commu-nity ecology: the role of limiting nutrients. Annu Rev Ecol Syst 13:349–372
Turner RE, Rabalais NN (1994) Coastal eutrophication near the Mississippi river delta. Nature 368:619–621
Utermöhl H (1958) Zur Vervollkommnung der quantitativen Phytoplankton-Methodik. Mitt Int Ver Theor Angew Limnol 9:1–38
van Bennekom AJ, Salomons W (1981) In: Martin JM, Burton JD, Eisma D (eds) River inputs to ocean systems. UNEP, IOC, SCOR, United Nations, New York, p 33–51
Vasconcelos VM (1993) Toxicity of cyanobacteria in Lakes of North Central Portugal. Ecological implications. Verh Int Verein Limnol 25:694–697
Verity PG, Robertson CY, Tronzo CR, Andrews MG, Nelson JR, Sieracki ME (1992) Relationships between cell volume and the carbon and nitrogen content of marine photosyn-thetic nanoplankton. Limnol Oceanogr 37:1434–1446
Editorial responsibility: Otto Kinne (Editor), Oldendorf/Luhe, Germany
Submitted: February 13, 2001, Accepted: May 31, 2001 Proofs received from author(s): February 12, 2002