PPGE – EP/FEA/IEE/IF
ANDRÉ GAETA BERNARDI
ORGANIC MUNICIPAL SOLID WASTE (MSW) AS FEEDSTOCK FOR
BIODIESEL PRODUCTION:
A FINANCIAL FEASIBILITY ANALYSIS
ANDRÉ GAETA BERNARDI
ORGANIC MUNICIPAL SOLID WASTE (MSW) AS FEEDSTOCK FOR BIODIESEL
PRODUCTION: A FINANCIAL FEASIBILITY ANALYSIS
Dissertação apresentada ao Programa de Pós-Graduação em Energia – Escola Politécnica / Faculdade de Economia, Administração e Contabilidade / Instituto de Eletrotécnica e Energia / Instituto de Física – da Universidade de São Paulo como parte dos requisitos para obtenção do título de Mestre em Ciências.
Orientação: Profa. Dra. Virginia Parente
Versão Corrigida
(versão original disponível na Biblioteca da Unidade que aloja o Programa e na Biblioteca Digital de Teses e Dissertações da USP)
São Paulo
AUTORIZO A REPRODUÇÃO E DIVULGAÇÃO TOTAL OU PARCIAL DESTE
TRABALHO, POR QUALQUER MEIO CONVENCIONAL OU ELETRÔNICO,
PARA FINS DE ESTUDO E PESQUISA, DESDE QUE CITADA A FONTE.
FICHA CATALOGRÁFICA
Gaeta-Bernardi, André.
Organic municipal solid waste (MSW) as feedstock for biodiesel production: a financial feasibility analysis./ André Gaeta Bernardi; orientadora Virginia Parente. – São Paulo, 2014.
129 f.: il.; 30 cm.
ACKNOWLEDGEMENTS
First, I would like to express my deepest gratitude to Professor Virginia Parente, my research supervisor, at the Universidade de São Paulo – USP, for her time, support and encouragement.
I am very thankful to Professor Gregory Stephanopolous, who hosted me as a graduate visiting student in the Chemical Engineering Department at the Massachusetts Institute of Technology – MIT, to conclude this dissertation.
I am also grateful to Devin Currie and Sagar Chackraborty, for overseeing this project and for many helpful discussions, and to Mark Keibler, Lidiane Andrade and Carissa Young for the generous and knowledgeable suggestions to this dissertation.
I sincerely acknowledge all the professors, classmates and post-docs at USP, PUBBoston and MIT for the wonderful time we spent together, for making this experience very unique and for the valuable insights concerning my research.
“The energy industry is a multi-trillion dollars per year, highly capitalized, commodity business, with exquisite supply
chains, providing essential services at all levels of society. This leads to a system with
considerable inertia, aversion to risk, extensive regulation and complex politics”
ABSTRACT
GAETA-BERNARDI, André. Organic municipal solid waste (MSW) as feedstock for biodiesel production: a financial feasibility analysis. . 2014. 129f .Master´s Dissertation - Graduate Program on Energy, Universidade de São Paulo, São Paulo, 2014.
The pursuit towards an alternative solution to fossil fuel has facilitated science investigation initiatives that compare various options leading to biodiesel production. Besides conventional feedstock derived from vegetable oils, alternative sources that could be produced in large scale at competitive costs are the main scope of research in this field. This dissertation investigates the financial feasibility using organic solid waste as a feedstock, which results in the production of biodiesel through the conversion of volatile fatty acids (VFA) into lipids. As a result, based on existing references of: (i) capital and operating costs; (ii) internal rate of return; (iii) production and extraction yields for volatile fatty acids and lipids, we concluded that biodiesel production is competitive compared to subsidized biodiesel traded in regions of Europe and the United States. The sensitivity analysis took into consideration independent variables associated with: (i) investments in the plant; (ii) selling price of the biodiesel; (iii) costs of feedstock; and (iv) production yield. The results of such analysis showed the feasibility of using organic solid waste as a feedstock in 86.4% of the total 10,000 simulations, at the required internal rate of return. These results encourage research aims to examine this technology at a larger scale. The adoption of public policies for the urban waste’s disposal and collection is also important for the implementation of such technologies.
RESUMO
GAETA-BERNARDI, André. Organic municipal solid waste (MSW) as feedstock for biodiesel production: a financial feasibility analysis. . 2014. 129f .Master´s Dissertation - Graduate Program on Energy, Universidade de São Paulo, São Paulo, 2014.
A busca por soluções alternativas aos combustíveis fósseis tem impulsionado as iniciativas de pesquisa científica que comparam várias opções para a produção de biodiesel. Além das tradicionais fontes de matéria-prima provenientes de óleos vegetais, fontes alternativas, que possam ser produzidas em grande escala a custo competitivo, figuram como o principal escopo nesse campo de pesquisa. Essa dissertação investiga a viabilidade financeira da utilização de resíduo sólido orgânico como matéria-prima para a produção de biodiesel, através da conversão de ácidos graxos voláteis em lipídios. Como resultado, baseando-se em dados sobre: (i) investimentos e custos de operação; (ii) taxa interna de retorno requerida; (iii) taxas de extração e produção de ácidos graxos voláteis e de lipídios, conclui-se que a produção de biodiesel é competitiva quando comparada ao biodiesel subsidiado, que é negociado em regiões dos Estados Unidos e da Europa. A análise de sensibilidade realizada levou em consideração variáveis independentes tais como: (i) investimentos na planta; (ii) preço de venda do biodiesel, (iii) custos da matéria-prima e (iv) produtividade. O resultado de tal análise mostrou a viabilidade da utilização de ácidos graxos voláteis para a produção de biodiesel em 86,4% das 10.000 simulações, assumindo a taxa interna de retorno requerida. Esses resultados encorajam pesquisas adicionais para teste da tecnologia em maior escala. A adoção de políticas públicas para o descarte e coleta adequados dos resíduos sólidos urbanos também é importante para o desenvolvimento dessa tecnologia.
LIST OF ABBREVIATIONS
AACE Association for the Advancement of Cost Estimating International AGA American Gas Association
ANP Agência Nacional do Petróleo, Gás Natural e Biocombustíveis
API American Petroleum Institute APV Adjusted Preset Value
BTU British Thermal Unit
BVS Biodegradable Volatile Solids CAGR Compound Annual Growth Rate CAPM Capital Asset Pricing Model
DIN Deutsches Institut für Normung
EIA Energy Information Administration
EPA United States Environmental Protection Agency EPC Engineering Procurement Contract
FAME Fatty Acids Methyl Ester FCFE Free Cash Flow to Equity FCFF Free Cash Flow to Firm FOB Free On Board
FRN Fachagentur Nachwachsende Rohstoffe
IEA International Energy Agency
IICA Instituto Internamericano de Cooperación para la Agricultura
IRR Internal Rate of Return ISBL Inside Battery Limits LCA Life Cycle Analysis MSW Municipal Solid Waste NPV Net Present Value
OECD Organisation for Economic Co-operation and Development OPEC Organization of Petroleum Export Countries
OSBL Offsite Battery Limits
P Production
R Reserves
RFS Renewable Fuel Standard RME Rapeseed Methyl Ester ROIC Return on Investment RVS Refractory Volatile Solids SME Soy Methyl Esters
SPE Society of Petroleum Engineers TC Total Carbons
TS Total Solids
TOPO Trioctyl-Phosphine Oxide TVS Total Volatile Solids U.S. United States of America UCOME Used Cooked Oil Methyl Esters ULSD Ultra Low Sulfur Diesel
USDA United States Department of Agriculture VFA Volatile Fatty Acid
LIST OF TABLES
Table 1 Biodiesel raw material cost and equivalent biodiesel price ……….……19
Table 2 Elemental composition of crude oil in % of total ………24
Table 3 Fraction, boiling rate and ultimate product oil refining ………...25
Table 4 Refining yield for different API° and sulfur oil ………...27
Table 5 Energy consumption by source in quadrillion BTU ………29
Table 6 Energy consumption in the transportation sector by source ………30
Table 7 Liquids consumption by sector in quadrillion BTU ………30
Table 8 Estimates for world reserves versus production ………..31
Table 9 Historical perspective of total reserves and R/P ratio ………..32
Table 10 Breakdown existing reserves by region ………...32
Table 11 Fatty acid % composition of vegetable oils ……….36
Table 12 Biofuel production by country in thousand barrels per day ……….39
Table 13 Fuel properties of vegetable oils and diesel ……….41
Table 14 MSW generation by group of countries ………...44
Table 15 MSW profile by group of countries ……….46
Table 16 MSW destination by group of countries ………..48
Table 17 Estimated MSW management cost by income country in $/ton ………..49
Table 18 Material profile by higher heating value ………..52
Table 19 Ultimate composition of dry MSW and moisture ………60
Table 20 MSW sorted by high nitrogen content ……….61
Table 21 MSW sorted by high moisture content ………61
Table 22 Biodegradable fraction as % of volatile solids ………...….61
Table 23 VFA yields from MSW experiments ………...62
Table 24 Detailed VFA yields ………...….63
Table 25 Lipid yields ……….…….65
Table 26 Parameters for financial and real options value ………...…77
Table 27 Capital cost references for anaerobic fermentation phase ………...83
Table 28 Estimated capital costs ………...86
Table 29 Organic MSW composition ……….………92
CONTENTS
1. Introduction ……….13
1.1Objective ………..……….16
1.2Hypothesis ……….17
1.3Methodology ……….19
1.4Dissertation Structure ………20
2. Liquid Fuels ……….22
2.1Petroleum – A Historical Perspective………...….22
2.1.1 Production and Refining ………....23
2.1.2 Consumption and Reserves ………...28
2.1.3 Oil Supply ……….……….…32
2.2Biodiesel ………33
2.2.1 Overview ………..….33
2.2.2 Production ……….……36
2.2.3 Fossil Fuel Comparison .………....40
2.3Public Policies for Biofuels ………...41
3. Municipal Solid Waste ………43
3.1Overview ………...43
3.2Waste Treatment ………46
3.2.1Landfill ……….47
3.2.2Recycling ………..49
3.2.3Incineration ………...50
3.2.4Dumping ………...52
3.2.5Composting ………..53
3.3Environmental Issues ………53
4. Conversion of Organic Matter to Biodiesel ………56
4.1Overview ………...56
4.2Municipal Solid Waste to Volatile Fatty Acids ……….57
4.3Volatile Fatty Acids to Fatty Acid Methyl Ester ………...…64
5. Project Appraisal ……….67
5.1Financial Methods ……….67
5.1.2 Real Option ……….………...…76
5.2Assumptions and Results ………...78
5.2.1 Yields ……….………80
5.2.2 Capital Costs …...……….82
5.2.3 Financial Costs and Leverage ………86
5.2.4 Revenues and Operating Costs ………..88
5.2.5 Results ……… ………..…94
5.3Sensitivity Analysis ………...94
5.3.1 Monte Carlo Simulation……….…94
5.3.2 Assumptions………...96
5.3.3 Results ……….………..97
1. Introduction
The increased generation of solid urban waste combined with the utilization of non-renewable fuels as the main energy source for transportation, specifically the negative consequences thereof, may be considered the main concerns of today’s society. This dissertation investigates the financial feasibility of biodiesel production from municipal solid waste (MSW) by an integrated solution, which addresses the challenges associated with waste generation and our dependency on a limited supply of fossil fuels.
Urban waste, or municipal solid waste (MSW), has led to environmental pollution and high costs to the municipality (MADU; KUEI, 2012). The World Bank (2012) expects MSW generation to attain 2.2 billion tons by 2025. When compared to the current estimate of MSW generation at 1.3 billion tons per year, many policies have suggested investments, especially in low income countries, where most of this waste is deposited in dumps and landfills. The improper management of MSW has severe environmental consequences, such as contaminants polluting water sources, as well as the emission of large amounts of greenhouse gases (GHG) that contribute to global warming1(MADU; KUEI, 2012).
The disposal of MSW is a serious concern facing societies around the world. Despite recent technological improvements to optimize waste management procedures and reduce negative externalities2, MSW generation per capita continues to escalate. Furthermore, the commonly used methodologies for waste treatment to mitigate environmental risks are costly (CHEREMISINOFF, 2003). For example, the cost of landfill disposal varies from $10 per ton to $30 per ton, but the disposal in more advanced engineered landfills could reach up to $100 per ton (The World Bank, 2012).
1
Greenhouse gases (GHG) contribute to global warming. The physical characteristics of greenhouse gases are the potential to absorb infra-red radiation via a specific vibrational modes and its lifetime in the earth’s atmosphere. The main contributors to global warming are carbon dioxide (CO2) and methane (CH4) (LECTHER; 2009).
2
The detrimental effects associated with oil utilization comprise energy security risks. Supply is concentrated to politically instable regions, and, as such, energy affordability during peak and volatile price periods are negative to economies. Furthermore, environmental problems associated with oil production, GHG emissions from fossil fuel consumption (PASCUAL; ELKIND, 2010) and petroleum’s non-renewable nature (GROSH; PRELAS, 2009) also represent intrinsic problems in fossil fuel utilization.
Concerns about petroleum’s non-renewable nature are not new. At the beginning of 1970, the Club of Rome raised awareness and potential consequences of exponentially growing population combined with finite hydrocarbon-based energy sources like petroleum (DIETER; WITZEL, 2010). In regards to energy security, Arab and Israel war conflicts, Iran-Arab and Arab-Arab conflicts, US-Gulf war conflicts of Kuwait and Iraq, radicalism and terrorist attacks have affected the region and the world’s oil supply since the Middle East holds 65% to 70% of world’s oil reserves (ŞEN; BABALI, 2007).
Although the diesel engine was invented in 1900s, the commercial-scale exploration of biodiesel surged only many decades later in the 1970s as an increased interest to alleviate the depletion of fossil fuel resources, mitigating oil shocks risks and reducing greenhouse gas emissions became apparent (JANAUN; ELLIS, 2010). Governments are determined to promote an alternative to fossil fuels by implementing policy that supports biofuel technology and production, mostly with respect to biodiesel and ethanol. Nevertheless, “green” business models could be further fostered by policy makers (NAIR; PAULOSE, 2014). The governments of the United States, Brazil, Colombia, European Union Member States and Australia have promoted these public policies (CHARLES; RYAN; RYAN; OLORUNTOBA, 2007).
The cost of feedstock corresponds to 75% of the total cost of biodiesel produced from edible and non-edible vegetable oils. As a consequence, the world’s average cost of producing biodiesel is usually $0.50 per liter versus $0.35 per liter of fuel diesel (ATABANI; SILITONGA; BADRUDDIN; MAHLIA; MASJUKI; MEKHILEF, 2012).
The cost of producing biodiesel in developed countries could be 1.5 – 3.0 times more expensive than producing diesel. Consequently, biodiesel is not feasible economically and policies that support advancements leading to competitive prices with fossil fuels are required (ATABANI; SILITONGA; BADRUDDIN; MAHLIA; MASJUKI; MEKHILEF, 2012).
In spite of the use of vegetable oils to produce biodiesel, initiatives that analyze the economic competitiveness of other sources are found in literature. For example, Dufreche et al. (2007) concluded that the cost of producing biodiesel from municipal sewage sludge was $3.11 per gallon ($0.88 per liter), due to low yields. As such, these results are not competitive when compared to the production cost at $2.5 per gallon ($0.66 per liter) when soy is used as a feedstock. Research on biodiesel production from microalgae has showed the advantages of this source in terms of the high oil content, later converted in biodiesel. The rapid biomass production from microalgae and the maintenance of agricultural land for food production are additional benefits. However, production cost remains $20 to $30 per gallon ($5.3 to $ 8.0 per liter), thus not economically feasible (BALAT, 2011).
The IEA (International Energy Agency, 2012) predicts that biofuels, which comprise biodiesel and ethanol, will receive $46 billion in subsidies3 by 2020 and $59 billion by 2035 versus $24 billion received in 2011 – an increase in 92% and 146% respectively. Biofuel subsidies are largely concentrated in the European Union, which allocated $11 billion to biofuels in 2011, mostly in biodiesel. In the same year, the U.S. allocated $8 billion to biofuels that targeted ethanol production.
The production of biofuels on an agricultural scale raises additional concerns among environmental and conservation groups, including the use of fertile land to produce fuel products instead of food production, as well as potential deforestations of tropical regions.
3
These aspects have weakened the political support for biofuels’ subsidies (CHAPMAN, 2013).
Continuous efforts to develop and produce biofuels, as part of governments’ environmental and energy policies, should continue to increase demand, yet a growing global population and limited availability of cultivated land limit the production of biodiesel from agricultural crops (ATABANI; SILITONGA; BADRUDDIN; MAHLIA; MASJUKI; MEKHILEF, 2012). As a result, the use of alternative feedstock for biodiesel production, such as organic residues from municipal solid waste (MSW), rather than vegetable oils may facilitate the development of a sustainable fuel source (SATYANARAYANA; JOHRI; PRAKASH, 2012).
Additional to the cost advantages due to using a less expensive carbon feedstock include the utilization of organic waste as an alternative feedstock. As a result, the production of biodiesel eliminates the controversial debate of using edible carbons to produce fuel as opposed to food, as well as the need for additional agricultural land to increase biodiesel production (SATYANARAYANA; JOHRI; PRAKASH, 2012). Notably, solar radiation is the most abundant energy source available (MARSHALL; KAUFMAN, 2013). Organic waste conversion to biofuels, not only addresses environmental problems, but also maximizes the energy utilization from solar radiation, by recycling organic matter.
1.1Objective
This dissertation’s primary objective is to evaluate the financial feasibility of organic municipal solid waste (MSW) conversion, through industrial biotechnology4, in fatty acids methyl esters (FAME), the primary molecule in biodiesel (BISEN; DEBNACHT; PRASAD, 2012).
Existing literature about this research field is limited and generally focused on the segmented parts of the process to convert organic MSW in biodiesel. D’Addario et al (1993) and Sans et al (1995) published the results of several experiments on VFA production from organic MSW. Alkaya et al (2009) and Mostafa (1999) published results on VFA extraction from
4
fermentation broth and Fontainelle et al (2012) and Fei et al (2010) on VFA conversion to lipids.
Secondary objectives in this dissertation are:
1. To assess existing literature about the MSW composition and its main characteristics from a physical-chemical and economic standpoint, as well as, to analyze existing methods for MSW’s collection, disposal and treatment. MSW increase in volume over the decades and its toxicity represent the main challenges to modern society (KREITH; TCHOBANOGLOUS, 2002).
2. To estimate the amount of potential organic MSW that could be degradable by acidogenesis, such as waste food, leaves and grass trimming, which will be the main feedstock for FAME production.
3. To revise existing methods to convert organic matter from different sources to volatile fatty acids (VFA), which will later converted to FAME. Most studies on FAME production have been carried out with oleaginous as the carbon source, but alternative sources, such as starch and ethanol, pectin and lactose, waste and glycerol have also been tested (FEI; CHANG; SHANG; CHOI; KIM; KANG, 2011).
4. To review main methods for evaluating investments and the decision making process, with particular focus on net present value (NPV) from a stream of cash flow and internal rate of return (IRR) methodology. These methodologies and tools incorporate the concept of the time value of money, which has been known and evolved since the early 1800s (CRUNDWELL, 2008).
1.2Central Question and Hypothesis
The central question to be pursued in this dissertation is:
The hypothesis is to be investigated is that petroleum prices above $100 per barrel and existing subsidies would make biodiesel produced from organic MSW competitive to diesel and conventional biodiesel.
While raw material costs correspond to 80% to 90% of the cash cost production in chemicals and petrochemical processes that use vegetable oils (TOWLER; SINNOT, 2013), MSW feedstock cost should be significantly lower, if not positive. Municipalities disburse $5/ton to $200/ton (The World Bank, 2012) in MSW treatment, depending on the selected treatment method. Thus, the use of MSW as a feedstock should have a significant lower cost compared to other biodiesel feedstock.
Petroleum prices have been escalating over the past two decades with extraordinary volatile in recent years. Literature describing the “third oil price shock” attributes the recent increase in petroleum prices to increase in demand from emerging market countries, expansionary monetary policies, flat petroleum production and increase in futures market’s speculations (MORANA, 2013).
Research has also been conducted to describe the potential impact of a “peak oil”5 scenario, which could be associated to political disruptions, military conflicts or terrorist attacks. The conclusion is higher volatility for only small changes in supply and higher petroleum prices, connected to negative economic impacts (LUTZ; LEHR; WIEBE, 2012).
Chapman (2013) argues the discussions about a factual “peak oil” overshadows the debate on the decreasing long-term supply of petroleum, which should focus on the acknowledgment that cheap fuel is no longer available. The debate should conduct to serious discussions about ways to reduce energy utilization at production, distribution and consumption phases of the economy.
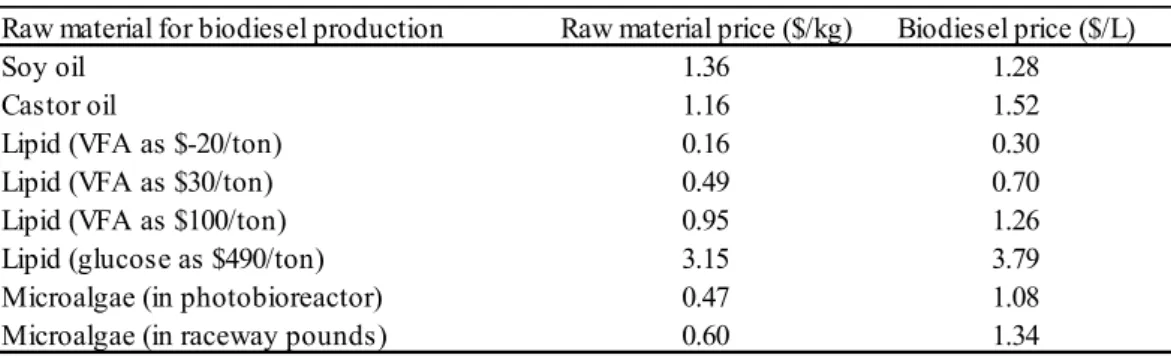
Research experiments aimed to present an economic analysis of biodiesel prices by using different raw material as a feedstock for production and indicate that VFA could be financially feasible under certain feedstock cost scenarios. The conclusion is based on the fact
5
that the biodiesel price is higher than the raw material price, as depicted in Table 1 (FEI; CHANG; SHANG; CHOI; KIM; KANG, 2011).
Table 1 – Biodiesel raw material cost and equivalent biodiesel price
Source: FEI; CHANG; SHANG; CHOI; KIM; KANG, 2011.
Although this analysis suggests a potential financial feasibility, results lack of an integrated analysis in terms of the internal rate of return (IRR) and net present value (NPV) associated to the project. These concepts are further discussed in the methodology section.
1.3Methodology
The adopted methodology could be divided in two central parts, which aims to answer the central question of this dissertation.
The first part comprises the analysis and definition of the necessary structure and costs to produce biodiesel from MSW, based on existing literature and operating units with the same or similar physical and chemical characteristics. The information defines basic standards for cost and size in a theoretical facility.
The last part consists of building a financial model to evaluate the facility’s financial feasibility by incorporating the information previously collected. The financial model allows the assessment of the profitability of the plant through the interpretation of financial indicators used in this type of analysis, which are the net present value (NPV) method and the internal rate of return (IRR) method.
Raw material for biodiesel production Raw material price ($/kg) Biodiesel price ($/L)
Soy oil 1.36 1.28
Castor oil 1.16 1.52
Lipid (VFA as $-20/ton) 0.16 0.30
Lipid (VFA as $30/ton) 0.49 0.70
Lipid (VFA as $100/ton) 0.95 1.26
Lipid (glucose as $490/ton) 3.15 3.79
Microalgae (in photobioreactor) 0.47 1.08
Together with the NPV method, the internal rate of return (IRR) method is widely used in investments’ decisions as a measure of profitability expressed as percentage rate of return. NPV and IRR are consistent with a company’s goal to maximize shareholder’s wealth; therefore most firms largely use NPV and IRR (BESLEY; BRIGHAM, 2009).
The IRR serves as a fixed and minimum parameter to define the implicit biodiesel’s selling price of the facility, which compared to the equivalent diesel prices and biodiesel prices available, will provide the answer to the dissertation’s central question and deny or confirm the proposed hypotheses.
Although there is limited consensus in the required IRR to equity in real terms for a project and terminology is imprecise in detailing real or nominal return, Birgisson (2011) defined a required real IRR to equity of 15% when calculating the feasibility of producing biodiesel from rapessed.
Pandey et. al (2011) also describe another example of economic feasibility studies for ethanol plant suggesting am IRR of 15%. Schmidt (2012) also suggests, in another microalgae-biofuel project, that the IRR has to be above 15% for the investment to be profitable. Therefore, this dissertation assumes a 15% real IRR as a minimum level to defined the feasibility of the study.
1.4 Dissertation structure
The first part of the dissertation introduces the general theme, with considerations about MSW and fuel energy. This section also narrows the scope of the research, as well as defines a methodology in order to accept or reject the proposed central question
The third part discusses MSW from a feedstock perspective to biodiesel production. In this section, the dissertation explores the nature of MSW in different countries according to their income generation, as well as, analyses the methods for MSW treatment and MSW composition. This understanding of the MSW generation and composition are crucial to understand the feedstock availability for biodiesel production.
The fourth part analysis the conversion processes required to convert MSW to FAME, from a chemical perspective, using existing literature to base the incorporation of conversion rates and yields. This output serves as an input to define the biodiesel production and the feedstock needed.
In the fifth part, the dissertation presents a review of existing literature regarding project evaluation in order to define the methods for the biodiesel plant project evaluation. In this section, the NPV and the IRR for the project are calculated using existing literature for estimating yields, operating costs, financial costs and capital costs. A sensitivity analysis is conducted to contribute to the final conclusions.
2. Liquid Fuels
This chapter aims to describe and analyze the main characteristics of the petroleum and biodiesel as an energy source. The first part of this chapter investigates the production and refining of petroleum, the supply-demand drivers of oil and its supply concerns. The second part analyzes the historical development of the biodiesel industry, as well as its production methods and feedstock, supply-demand characteristics and similarities to diesel. The last part investigates public policies aiming to foster the development of the biodiesel industry.
2.1 Petroleum – A Historical Perspective
The Petroleum Age was established by 1859 in Pennsylvania, a state located in the northeast region of the United States of America. Edwin Drake and George Bissell were pioneers in petroleum production and their intention was to produce an illuminant to replace difficult to obtain whale oil (SPEIGHT, 2011). Whale oil production was already declining when petroleum started to be explored. The peak production in whale oil was 15 million gallons in 1840, which was reduced to 10 million in 1860 due to intensity in competition for supply and increase in the cost of expeditions (VACTOR; 2010).
The essential insight of Bissel was to adapt drilling techniques generally used within salt production to oil and transfer this technology to produce oil. Given that the techniques for kerosene production were known, with Abraham Gesner applying for the first patented by in 1854 to produce kerosene from asphalt, and the right type of lamp for it was available, production increased significantly (YERGIN; 2008).
The progress towards electric generation by coal and the development of light bulbs favored the replacement of kerosene as an illuminant. Nevertheless, the decline in petroleum consumption as source of light was replaced by the technological advancement of internal combustion engines for transportation. By 1905, the gasoline power engines had surpassed steam and electricity in the automotive industry (YERGIN; 2008).
2.1.1 Production and Refining
Even after the spectacular technological advancements used to explore oil over the past 150 years, the unpredictability profile of exploration should not be neglected. For example, oil resources are now becoming increasingly difficult to discover, requiring sophisticated technology and capital. The challenges to explore oil reflect the remote locations of new resources, at a depth of 5,000 or 6,000 meters in the oceans (DOS SANTOS, 2011).
In spite of increasing difficulty to explore oil, chances of success in drilling exploratory campaigns increased over the last 50 years. The world’s average success rate per well is 33% compared to a lower success rate per well of 17% in 1960. Even with new technological advancements in the exploratory research, which provides the potential localization of oil reservoirs, the only way to determine the presence of oil is by drilling. Thus making oil exploration a high risk business activity by definition (TORDO; JOHNSTON; JOHNSTON; 2010).
Over the years, many different theories about the formation of oil have emerged. Among them, the organic theory is the most accredited. The organic theory states that the carbonization of organic matter by bacteria, in the absence of oxygen and over millions of years, produces oil (CLÔ, 2000).
Several conditions should be present for kerogen6 to be converted in oil. The first is the sedimentary base, which is the area where rocks accumulated through geological processes. Another condition is the presence of organic matter, algae or marine fauna, and in specific
6
elevated temperature and pressure for chemical reaction. A favorable impermeable shaped formation to trap the generated oil is also required (JAHN; COOK; GRAHAM, 2008)
Temperature is an important factor in the oil generation process, given that it affects the final outcome in different products other than oil. If temperature rises above 100°C, kerogen will be cracked and gas will start to be produced. Kerogen turns into oil in temperatures from 50°C to 100°C, with peak conversion at 100°C, into condensate or wet gas 130°C and into methane or dry gas when temperature is above 130°C (JAHN; COOK; GRAHAM, 2008).
In chemical terms, oil is composed largely by carbon and hydrogen, with traces or residual elements of sulfur, vanadium, nickel, among others, as depicted in Table 2. Besides of its basic chemical composition, oil generated in different sedimentary basins are not identical and will be different in terms of the chemical composition, as well as in the proportion of the chemical elements present (SELLEY, 1998).
Table 2 – Elemental composition of crude oil in % of total
Source: FREEMAN et. al 1967 apud SELLY 1998.
After explored and produced, oil is refined to generate a variety of different products, including fuels. Refining is the key link in the oil supply-demand organization, as this activity transforms oil into products that can be used in transport and industrial fuels, and as feedstock to chemical and petrochemical industries (FAVENNEC, 1998).
The refining process starts by fractional distillation of oil into three principal products, according to their boiling point, which are the straight-run gasoline, kerosene, heating oil or diesel fuel. In addition, under reduced pressure and higher temperature, distillation also produces lubricating oils and waxes. The residue that cannot be distilled is asphalt (MCMURRY, 2011).
Element Minium Maximum
Carbon 82.2 87.1
Hydrogen 11.8 14.7
Sulfur 0.1 5.5
Oxygen 0.1 4.5
Nitrogen 0.1 1.5
Table 3 represents the fraction generated in the distillation tower, as oil is exposed to specific temperature and pressure conditions. The ultimate product becomes available after a variety of different process, which includes including cracking, hydrocracking and catalytic reforming.
Table 3 – Fraction, boiling rate and ultimate product oil refining
Source: HSU; ROBINSON, 2006.
According to EIA (2013), total oil refined in the U.S. during 2012 yielded to 44.1% in finished motor gasoline, and 22.8% in distillate fuel oil, which includes diesel for transportation, heating and electric power generation. This percentage refers to the refinery yield in the U.S. Nevertheless, the output from oil refining depends on the quality of oil input and on the configuration of the refinery facility. One of the methods to define oil quality is calculating its density and sulfur content. Oil density’s indication provides the potential gasoline and kerosene output that could be generated during oil refining and is largely used by the refining industry (SPEIGHT, 2011).
The oil industry widely uses the density measure API (American Petroleum Institute) gravity scale or API° as an indication for oil quality. This measure was first introduced by the American Petroleum Institute in 1921 as a methodology to calculate the specific gravity of liquids less dense than water (HUC, 2011).
According to Selley (1998), the general formula of API° is
API° =
141.5
sp 60/60°F - 131.5
ᵒC ᵒF
Liquefied Petroleum Gas -40 to 0 -40 yo 31 Propane fuel
Light Naphta 39 - 85 80 - 185 Gasoline
Heavy Naphta 85 - 200 185 - 390 Gasoline and aromatics
Kerosene 170 - 270 340 - 515 Jet fuel and diesel
Gas Oil 180 - 340 350 - 650 Heating oil and diesel
Vaccum Gas Oil 340 - 566 650 - 1,050 Gasoline, fuel oil, diesel and others Vaccum Residue > 540 > 1,000 Coke, asphalt and others
Boiling range
Where:
sp = specific gravity is the relationship or the ratio between the mass of volume of a given substance to the mass of an equal volume of water, at a given temperature.
60/60°F = standard temperature used in North America by the oil industry, which is
equivalent to 15.6/15.6°C.
The API scale categorizes different types of oil in light crude oil, medium crude oil and heavy crude oil. Light crude oil has an API° greater than 31.1 and specific gravity less than 0.87. Medium crude oil has an API° ranging from 22.3 and 31.1 and specific gravity between 0.87 and 0.92. Heavy crude oil shows API° less than 22.3 and specific gravity higher than 0.92 (HUC, 2011).
Hence, an oil sample with high API° will yield to high value refined products, such as gasoline, jet fuel and diesel, whereas an oil sample with low API° will yield to low value products, such as heavy gas oil (DOS SANTOS, 2011). As a result of different yields, light oil is generally more expensive than heavy oil (SPEIGHT, 2011).
In regards to sulfur content, an oil sample can be defined as “sweet”, if it has less than 0.5% of sulfur in total composition, or “sour”, if sulfur content is above 0.5% (ANTUNES, 2007). Low sulfur level oil preferable as it yields to better quality refined products and is less expensive to refine than high sulfur oil (DOS SANTOS, 2001).
Table 4 - Refining yield for different API° and sulfur oil
Source: HSU; ROBINSON, 2006.
The diesel output depends on the oil properties used as feedstock and the refining operations. In terms of quality, it is desirable a short delay between injection and ignition, which is measured by the cetane number7 (ONURSAL; GAUTMAN, 1997). Physical characteristics of diesel, such as viscosity, gravity and mid-boiling point, have an impact on ignition, and; therefore, will have an impact in the cetane number (RANDY, 2003).
A higher cetane number results in higher energy efficiency and power output, reduces noise and greenhouse effect emission due to improved fuel combustion. The cetane number for diesel fuel ranges from 43 to 57 and numbers below 45 increase black smoke and gas emissions (ONURSAL; GAUTMAN, 1997).
Besides from refined petroleum, diesel can be produced from coal or natural gas. The conversion of synthesis gas or syngas derived from these sources has been considered as an alternative to oil-based fuels. The processes are known as coal-to-liquids and gas-to-liquids (MOULIJN; MAKKEE; DIEPEN, 2013).
7
Cetane number is the percentage of cetane, which ignites easily, present in a mixture of cetane and 2-methyl naphthalene (SENAPATI, 2006).
Source field Brent Bonny Lt. Green Canyon Ratawi
Country Norway Nigeria USA Mid East
API gravity 38.3 35.4 30.1 24.6
Specific gravity 0.8333 0.8478 0.8752 0.9065
Sulfur % 0.37 0.14 2.00 3.90
% Yields
Light ends 2.3 1.5 1.5 1.1
Light naphtha 6.3 3.9 2.8 2.8
Medium naphata 14.4 14.4 8.5 8.0
Heavy naphtha 9.4 9.4 5.6 5.0
Kerosene 9.9 12.5 8.5 7.4
Atmospheric gas oil 15.1 21.6 14.1 10.6
Light gas oil 17.6 20.7 18.3 17.2
Heavy gas oil 12.7 10.5 14.6 15.0
Residue 12.3 5.5 26.1 32.9
Total 100.0 100.0 100.0 100.0
Total naphthas 30.1 27.7 16.9 15.8
Syngas or synthesis gas is a gas mixture of predominantly carbon monoxide (CO) and hydrogen (H2) and carbon dioxide (CO2) (BROWN, 2011). Syngas is produced by gasification, which is a thermal process that uses any carbonaceous fuel, such as coal, natural gas or biomass, to gas using heat (HIGMAN; BURGT, 2008).
In the case of coal, the gasification occurs with steam and oxygen (O) and steam. The gas is cleaned to extract CO2, ash and sulphur dioxide (SO2) as these components undermine an optimal performance of the Fischer-Tropsch process8. After cleaned, CO and H2 react in the presence of an iron-based catalyst to form various hydrocarbons at 200-250°C or 320-350°C. The share of middle-distillates produced can reach 75%, with 80% diesel production and 20% kerosene production (VALLENTIN, 2008).
The Fischer-Tropsch synthesis is capable of producing synthetic products like liquid fuels, such as high cetane diesel, and petrochemical products that are free from all major contaminants as sulfur, and heavy metal, and; therefore, present very high quality (SERRANO; AGUADO, ESCOLA; 2011).
2.1.2 Consumption and Reserves
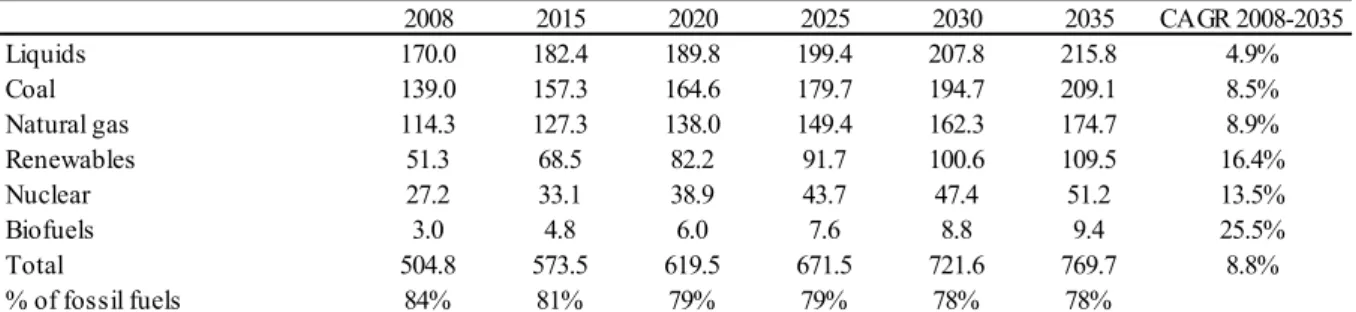
In spite of society’s concerns, fossil fuels such as oil9, natural gas and coal should continue to be the most important energy sources in the world, although renewables’ participation should increase in relative terms (Energy Information Administration - EIA, 2011).
These three sources combined are expected to supply 81% of world’s energy needs in 2015 and 78% in 2035, which is illustrated in Table 5. This percentage decline in relative terms reflects the expected increase in renewable, nuclear and biofuels sources in absolute terms at a higher rate than petroleum, coal and natural gas.
8
The best known process to convert solid and gas into liquids is Fischer-Tropsch. German coal researchers Fischer and Tropsch discovered in 1923 that syngas could be converted catalytic into hydrocarbons. The process was extensively used before and during World War II (MOULIJN, MAKKEE, DIEPEN, 2013).
9
Table 5 – Energy consumption by source in quadrillion BTU10
Compound annual growth rate (CAGR)
Source: Energy Information Administration - EIA, 2011
The landscape for transportation and for the automobile changed significantly with the development of fuel-fired internal combustion engine during the 20th Century. Steam engines were inefficient in terms of energy conversion and not portable, which made this technology unsuitable for fast transport (SOLOMON; KRISHNA, 2011).
The automotive industry also benefited from the oil availability at low prices by the early 20th Century and from a shift in the relationship between production and consumption into the age of mass production. Changes in production methods aiming to increase automobiles efficiency and affordability continue to develop until later 20th Century (SOLOMON; KRISHNA, 2011).
Automotive transportation largely developed on internal combustion engines. Gasoline spark-ignition and diesel compression-spark-ignition engines are types of internal combustion engines largely used in converting chemical energy into mechanical energy. Diesel compression-ignition engines can develop more power in a more efficient way than gasoline, although at a higher cost (LAKSHMINARAYANAN; AGVAH, 2010).
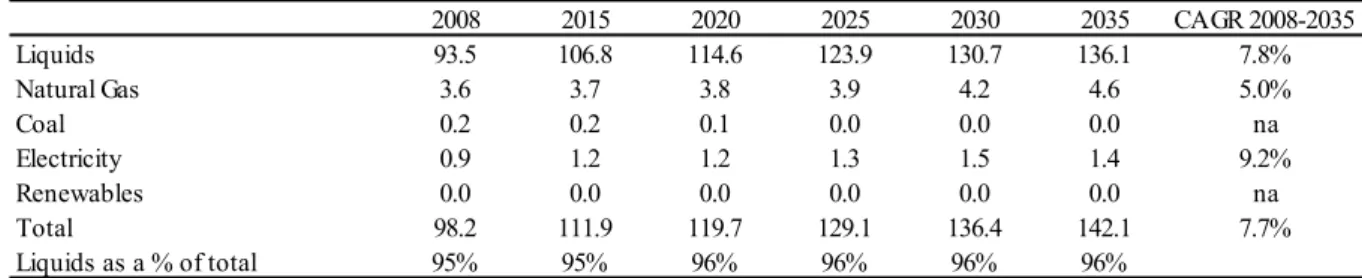
Therefore, the development of the automotive industry and the abundance of liquid fossil fuels shifted society’s organization for transports. The energy consumption in the transportation sector should continue to be significantly based on liquid fuels, which are expected to correspond to more than 95% of the total energy source deployed in the sector as Table 6 depicts.
10
British Thermal Unit (BTU) is the amount of heat necessary to raise one pound of water by one Fahrenheit degree (KIRTLEY, 2010).
2008 2015 2020 2025 2030 2035 CAGR 2008-2035
Liquids 170.0 182.4 189.8 199.4 207.8 215.8 4.9%
Coal 139.0 157.3 164.6 179.7 194.7 209.1 8.5%
Natural gas 114.3 127.3 138.0 149.4 162.3 174.7 8.9%
Renewables 51.3 68.5 82.2 91.7 100.6 109.5 16.4%
Nuclear 27.2 33.1 38.9 43.7 47.4 51.2 13.5%
Biofuels 3.0 4.8 6.0 7.6 8.8 9.4 25.5%
Total 504.8 573.5 619.5 671.5 721.6 769.7 8.8%
Table 6 – Energy consumption in the transportation sector by source in quadrillion BTU
Source: Energy Information Administration - EIA, 2011
In terms of total liquids consumption, the transportation sector corresponds to the majority of the end-consumption for this energy type, followed by the industrial segment, as Table 7 illustrates. Five energy-intensive industries represent more than 60% of all industrial energy consumption, which includes the chemical (33% of total), iron and steel (14%), non-metallic minerals (7%), pulp and paper (4%) and nonferrous metals (3%) (EIA, 2011).
Table 7 – Liquids consumption by sector in quadrillion BTU
Source: Energy Information Administration - EIA, 2011
Although petroleum, natural gas and coal are finite energy sources, the availability of reserves still remains high, with proved reserves above 50 years (BP, 2013), as illustrated on Table 8. Therefore, despite fossil fuels’ non-renewable profile and geopolitical supply instability, it is the environmental concern that should stimulate the shifting towards renewable energy sources (GOLDEMBERG et al. 1998 apud BOTELHO, 2012).
2008 2015 2020 2025 2030 2035 CAGR 2008-2035
Liquids 93.5 106.8 114.6 123.9 130.7 136.1 7.8%
Natural Gas 3.6 3.7 3.8 3.9 4.2 4.6 5.0%
Coal 0.2 0.2 0.1 0.0 0.0 0.0 na
Electricity 0.9 1.2 1.2 1.3 1.5 1.4 9.2%
Renewables 0.0 0.0 0.0 0.0 0.0 0.0 na
Total 98.2 111.9 119.7 129.1 136.4 142.1 7.7%
Liquids as a % of total 95% 95% 96% 96% 96% 96%
2008 2015 2020 2025 2030 2035 CAGR 2008-2035
Transportation 93.5 106.8 114.6 123.9 130.7 136.1 7.8%
Industrial 55.3 57.5 59.2 61.9 65.1 68.6 4.4%
Residential 9.8 9.7 9.1 8.9 8.8 8.8 -2.1%
Electric power 9.7 9.0 8.6 8.2 7.8 7.5 -5.0%
Commercial 4.6 4.3 4.2 4.1 4.1 4.1 -2.3%
Total 173.0 187.3 195.8 207.0 216.6 225.2 5.4%
Table 8 – Estimates for world reserves versus production
(a) thousand million barrels, (b) trillion of cubic feet, (c) billions of tons. Source: BP, 2013.
In oil exploration and production, reserve and resource have a different meaning. According to SPE (Society of Petroleum Engineers, 2011), the initial efforts for a definition of reserves started in 1937 by API in the U.S. In 1946, AGA (American Gas Association) also proposed a similar definition for natural gas. In 1962, SPE (2011) was involved in additional discussions to define a methodological concept for reserves. The demand was brought by financial and insurance institutions and investors that received oil reserves as collateral for financial operations and; therefore, needed to be defined based on uniformed concepts and methodology.
As a consequence, in 1965, SPE (2011) established new criteria for the definition of oil reserves, which through the following decades converge to definitions of other important sector associations. According to SPE’s (2011) last revision, the potential oil quantities of an exploration and production project could be categorized as reserves, contingent resources and prospective resources, which carry an increasing risk of exploration and production.
Oil reserves are discovered and economically feasible, which require clear evidences of oil existence by at least one drill and positive net present value (NPV) under certain assumptions. Contingent resources are discovered, but not feasible at the time of the evaluation, which means these resources could or could not be feasible in the future. Finally, prospective resources were not discovered (SPE, 2011).
Table 9 depicts that in spite of growing demand, R/P ratio increase for oil and natural gas, reflecting the escalation in reserves absolute figures over the past 20 years. Coal is an exception as global reserves depleted faster than reserve’s increased. Nevertheless, coal reserves remain at the highest R/P ratio, and above 100 years, when compared to oil and coal (BP, 2013).
Reserves (R) Production (P) R/P ratio
(2012) (2012) (years)
Oilᵃ 1,690 31.9 52.9
Gasᵇ 187 3.4 55.7
Coalᶜ 861 7.9 109.5
Table 9 – Historical perspective of total reserves and R/P ratio
Source: BP, 2013.
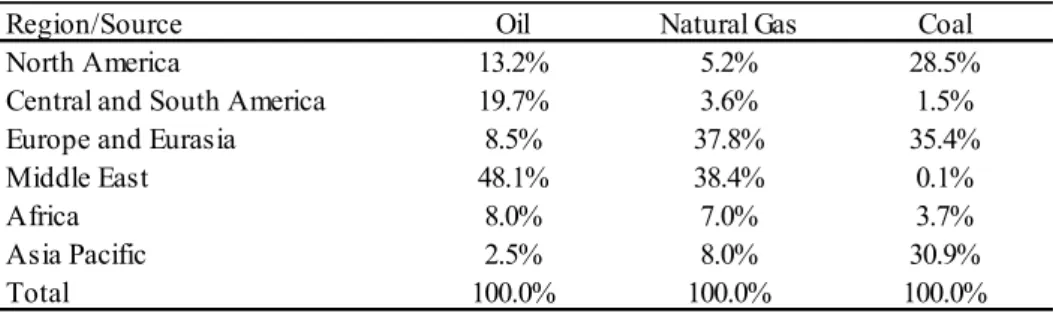
2.1.3 Oil Supply
In terms of fossil fuel supply, Table 10 shows that Middle East countries hold a substantial amount of reserves, which represent 48.1% of oil and 38.4% of natural gas’ total available reserves, which makes political conflicts in the region potentially negative for oil supply and oil prices.
Table 10 – Breakdown existing reserves by region
Source: BP, 2013.
Conflicts in Middle East and consequences to oil supply are well explored in the literature, from the oil discovery in Saudi Arabia, the reasons and consequences of the first and the second oil shocks (SIMMONS, 2005), the details about conflicts in the region (ŞEN; BABALI, 2007 and YERGIN, 2011) and the quantitative analysis of supply interruption on intrastate conflicts (TOFT, 2011).
Şen et al (2007) listed security elements affecting the Gulf region. According to them, international competition for oil, Arab and Israel war conflicts, Iran-Arab and Arab-Arab conflicts, US-Gulf war conflicts of Kuwait and Iraq and radicalism and terrorist attacks affected the region and world’s oil supply. Based on historical disputes, Toft (2011) supports
Reserves (R) Reserves (R) % Change R/P ratio R/P ratio (1992) (2012) (1992-2012) (1992) (2012)
Oil 1,039 1,690 63% 43.2 52.9
Gas 118 187 59% 58.3 55.7
Coal 1,273 861 -32% 230.0 109.5
Source
Region/Source Oil Natural Gas Coal
North America 13.2% 5.2% 28.5%
Central and South America 19.7% 3.6% 1.5%
Europe and Eurasia 8.5% 37.8% 35.4%
Middle East 48.1% 38.4% 0.1%
Africa 8.0% 7.0% 3.7%
Asia Pacific 2.5% 8.0% 30.9%
the idea that less than 50% of intrastate conflicts in the Middle East region result in production decline in the region. Therefore, the author concludes that risk perception from financial markets, policy analysts might be anticipating unrealistic fears of a drop in production.
Abrupt changes in oil prices are referred to as oil shocks because of the quick and unforeseen nature of occurrences (FAFOLA, 2005). The first oil shock increased oil price from $3.29 per barrel to $11.58 per barrel in 1973 as a result of Arab members of OPEC11 (Organization of Petroleum Export Countries) decision to cut supply to countries supporting Israel in their conflict with Egypt and Syria in the Yom Kippur War (ARAVOSSIS, 2006).
The second oil shock increased oil price doublet to $31.61 per barrel from 1978 to 1979. The popular uprising in Iran has significantly reduced oil output in the country. This caused major dislocations in the country’s oil industry resulting in a decline in production from 5.7 million barrels of oil per day to 0.7 million barrels of oil per day (VASSOLIOU, 2009). Although net supply fell less than 5%, worldwide panic drove prices higher (ARAVOSSIS, 2006).
In the third oil shock price reached record $40.42 per barrel from $15 per barrel in 1990 on the Gulf War, following Saddam Hussein retreat from Kuwait setting oil fields on fire. Contrary to the other oil shocks, this shock last only for six months (ARAVOSSIS, 2006).
2.2 Biodiesel
2.2.1 Overview
Biofuels, such as biodiesel, are one of the several different energy sources that can be produced with biomass. Biomass is the organic matter available on renewable basis, which includes agricultural crops, wood, residues, animal wastes, municipal waste and aquatic plants (FAN, 2010). The definition of biofuels is wide and comprises liquid, gaseous and
11
solid fuels produced from renewable feedstock, which is the key difference when compared to fossil fuels (DEMIRBAS, 2010).
Besides biofuels, biomass can produce energy though direct combustion to generate heat or electricity. It can also be gasified to produce syngas for power generation and liquid fuel synthesis and digested anaerobically to generate biogas for heat and electricity (FAN, 2010). Please refer to Appendix A for a schematic view of biogas production.
Biomass can also be defined as material of recent biological origin, which can be divided in three categories according to the stage of production in which are generated as feedstock (SPEIGHT, 2011).
1. Primary biomass feedstock is collected from the field or forest, which includes grains and oilseed crops, as well as the residues and waste from harvesting.
2. Secondary biomass feedstock is a by-product of primary biomass processing, which includes physical and chemical breakdown, producing black liquor in paper making, cheese way in cheese making or animal manure.
3. Tertiary biomass feedstock comprises residues and wastes from post-consumption, which includes municipal solid waste (MSW), packaging wastes, fats, greases and oils, yard trimming, among others.
The use of biomass as a fuel source dates back the 1800’s. The initial development of internal combustion vehicles’ industry precedes the development of oil-based fossil fuels’ industry. In 1826, the first internal combustion engine was patented by Samuel Morey and used a combination of ethanol and pine tree oil as fuel in boats (TOMES; LAKSHMANAN; SONGSTAD, 2011). Eugene Langen, who owned a sugar refinery and mostly likely had association with ethanol production, funded the development of Nicholas Otto’s internal combustion engine in 1860. Later, in 1900, the world’s first diesel engine would be presented in Paris World’s Fair in ran on peanut oil (TOMES; LAKSHMANAN; SONGSTAD, 2011).
entered in a partnership with Standard Oil Company to distribute and sell corn-based fuel at service stations, which was unsuccessful due to low oil prices (PAHL, 2008). The development of new energy technologies and fuels also appear to be part of society’s efforts to search for a solution to supply crisis. For example, a blend of ethanol and pine tree oil was was used as a replacement for whale oil used in lamp oil in late 1830 (TOMES; LAKSHMANAN; SONGSTAD, 2011).
The boost in world’s ethanol production to supply fuel needs during World War I (LIU; ROSENTRATER, 2012) and the use of direct coal-liquefaction technology to replace oil-based fuels during World War II (THE NATIONAL ACADEMY OS SCIENCES, 2009) are also examples of initiatives to develop new energy alternatives and technology in response to a supply crisis.
Liquid fuels are also called biofuels can be divided, according to their feedstock and production technology, in four generations (DERMIBAS, 2010). The most common biofuel is ethanol (SPEIGHT, 2011), which is obtained from the fermentation of starch or sugar. Together with ethanol, biodiesel based on lipids from plants are the main biofuels used in transportation (REJINDERS; HUIJBREGTS, 2009).
1. First generation biofuels are produced through well understood techniques and for mature commercial markets (IEA, 2008), which includes ethanol produced from the fermentation of crops such as sugarcane, sugar beet, wheat, potatoes or maize (SCRAGG, 2009) and biodiesel produced from the vegetable oil extracted from seeds and plants, such as rapessed, soybean, palm and sunflower (DERMIBAS, 2010).
2. Second generation biofuels involve more sophisticated technology and comprise ethanol and biodiesel produced directly from lignocellulose, which is available in non-food crops, agricultural residues and organic waste (SCRAGG, 2009). Lignocellulose is a structural material of plants, which contains lignin, (REJINDERS; HUIJBREGTS, 2009) whose degradation is complex and requires enzymatic systems (NIGAM; PANDEY, 2009).
transgenic crops (IICA – Instituto Interamericano de Cooperación para la
Agricultura, 2009). Biofuel from algae is considered a third generation biofuel
(DERMIBAS, 2010).
4. Fourth generation biofuels would represent a revolutionary advance on environmental concern regarding energy production. The aim of fourth generation biofuels is to reach a negative carbon production balance, which includes generation biofuels from trees or plants with greater capacity of carbon dioxide (CO2) storage (IICA, 2009).
From a chemical perspective, biodiesel is a monoalkyl esters of a long-chain fatty acids derived from renewable biolipids (DERMIBAS, 2010). Biodiesel could also be defined as a mixture of fatty acid esters, normally methyl esters (SCRAGG, 2009). The major fatty acids present in vegetable oils are the oleic acid (C18H34O2), linoleic acid (C18H32O2) and palmitic acid (C16H32O), which can be observed in table 11, for different vegetable oils (DERMIBAS, 2007).
Table 11 – Fatty acid % composition of vegetable oils
Source: GUPTA; DEMIRBAS, 2010.
2.2.2 Production
Liquid fuels can be produced by three main routes, according to FRN (2010), the thermochemical route, the physical-chemical route and the biochemical route, as illustrated on Appendix A. The existing technologies to produce biodiesel include the transesterification (physical-chemical), pyrolysis (thermochemical), dilution with hydrocarbons blending and
Fatty acid Pamitic Palmitoleic Stearic Oleic Linoleic Linolenic Others
Carbon : Double bonds 16:0 16:1 18:0 18:1 18:2 18:3
-Palm 42.6 0.3 4.4 40.5 10.1 0.2 1.9
Soybeans 11.9 0.3 4.1 23.2 54.2 6.3 0.0
Rapessed 3.8 0.0 2.0 62.2 22.0 9.0 1.0
Sunflower seed 6.4 0.1 2.9 17.7 72.9 0.0 0.0
Peanut 11.5 0.0 2.4 48.3 32.0 0.9 4.9
Cottonseed 28.7 0.0 0.9 13.0 57.4 0.0 0.0
Coconut 7.8 0.1 3.0 4.4 0.8 0.0 83.9
micro emulsion (ATABANI; SILITONGA; BADRUDDIN; MAHLIA; MASJUKI; MEKHILEF, 2012).
The transesterification method is the current method of choice to produce biodiesel. The advantages of this process are the low temperature and pressure of the reaction, the high conversion yield with minimal side reactions and time required, the direct conversion with no intermediate products and the simple construction of the facility (DERMIBAS, 2007). Transesterification is also regarded as the best method compared to other approaches due to its low cost and simplicity (ATABANI; SILITONGA; BADRUDDIN; MAHLIA; MASJUKI; MEKHILEF, 2012).
The typical production of biodiesel occurs in the reaction of lipids from vegetable oil crushed from oil seeds or animal fat with methanol or ethanol, in the presence of a catalyst, which yields to methyl or ethyl esters (biodiesel) and glycerin. This reaction is denominated transesterification12 and its purpose is to reduce the viscosity of the vegetable oil or animal fat (DERMIBAS, 2010). Biodiesel’s high viscosity, low volatility and polyunsaturated characteristics are the main challenges to produce a similar fuel compared to diesel (ATABANI; SILITONGA; BADRUDDIN; MAHLIA; MASJUKI; MEKHILEF, 2012). Appendix B provides a schematic view of the biodiesel production.
The generic transesterification reaction for biodiesel production, expressed as shown in the following formula, should be carried out between 50°C and 60°C at atmospheric pressure (ROMANO; SORICHETTI, 2011).
RCOOR'+ R''OH ↔ R'OH + RCOOR''
Where:
RCOOR' = triglyceride
R''OH = methanol13 or ethanol R'OH = glycerol
12
The first patent for producing fatty acids was awarded in 1937 to powering buses in Belgium (KNOTHE el at.2001 apud REJINDERS; HUIJBREGTS, 2009).
13
RCOOR'' = ester mixture or volatile fatty acid methyl esters (FAME), which needs to be purified to become biodiesel.
The transesterification reaction can be catalyzed by alkalis, acids or enzymes, from which, alkalis such as sodium hydroxide (NaOH), potassium hydroxide (KOH) and sodium methoxide (CH3NaO) are the most commonly used. The increase in the amount of alkali catalyst, from the usual 0.1% to 1% of oil weight, reduces FAME yield and increases glycerol (WANG, 2009).
In terms of reaction time, the comparison of various transesterification methods using methanol as a solvent show that the reaction could take from half a minute to two hours, depending on the method and reaction temperature. In acid or alkali catalytic process, the reaction takes 60 to 360 minutes at a temperature of 30 to 35 °C. The use of the catalytic supercritical methanol method significantly reduces the reaction time to 30 seconds to 1.5 minute, but needs a higher reaction temperature of 250 to 300 °C (DERMIBAS, 2009).
The stoichiometric ratio for the transesterification reactions demands three moles of alcohol and one mole of triglyceride to form three moles of fatty acid ester (FAME) and one mole of glycerol (DERMIBAS, 2007). Glycerol is a by-product of the biodiesel production and represents 10% of the quantities of oil used (SCRAGG; 2009).
A stoichiometric material balance of the transesterification yields to the simplified equation (GRABOSKI; MCCORMIK, 1998):
Fat or Oil + 3Methanol → 3Methylester + Glycerol
1,000 kg + 107.5 kg → 1,004.5 kg + 103 kg
Pyrolysis or thermal cracking of vegetable oils can produce fuels with high cetane, low viscosity and acceptable sulfur, water and sediment contents. However, ash contents, carbon residues and pour points remain the main problem of this method (ATABANI; SILITONGA; BADRUDDIN; MAHLIA; MASJUKI; MEKHILEF, 2012).
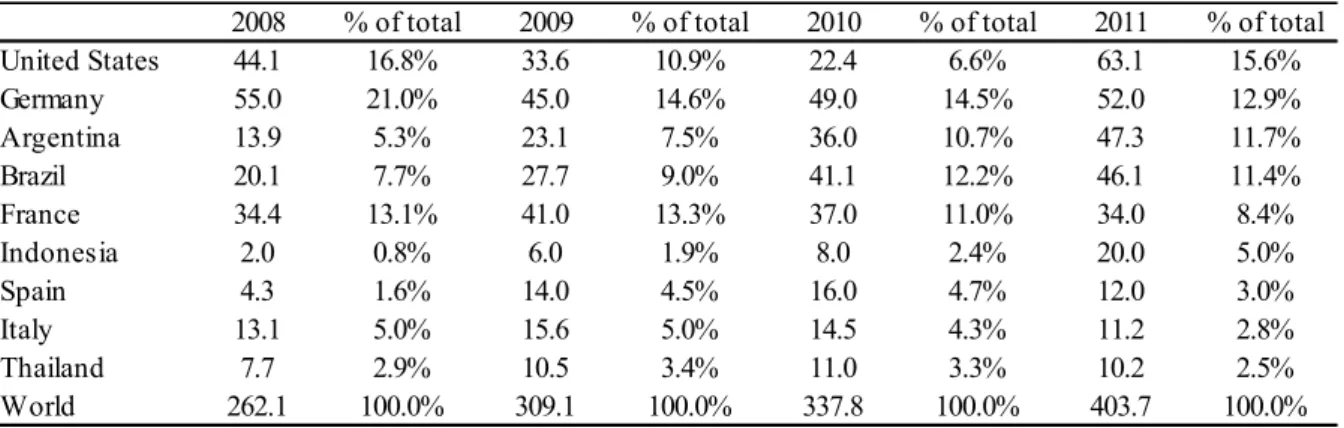
Biodiesel production is relative concentrated in the U.S, Germany, Argentina, Brazil, France and Indonesia. These countries together corresponded to 65% of total biodiesel produced in the globe (Biodiesel Production - EIA, 2013). Biodiesel is mostly produced from edible vegetable oils corresponding to 95% of the feedstock for 95% of global production (GUI et. al 2008 apud SPEIGHT 2011). In the U.S. and Argentina biodiesel is mostly produced by using soybean as a feedstock, in Europe, Canada and Northern U.S. is rapeseed and sunflower, in Malaysia and Indonesia is oil palm and in India is jatropha (SPEIGHT, 2011).
Besides soybean, the U.S., also use canola oil, tallow animal fat and poultry fat to produce biodiesel. In 2012, 4,023 million pounds of soybean oil were consumed exclusively to produce biodiesel, 787 million pounds of canola oil, 571 million pounds of corn oil, and 382 million pounds of tallow animal fat and 170 million pounds of poultry fat (U.S. Inputs to Biodiesel Productions - EIA, 2013).
Table 12 – Biofuel production by country in thousand barrels per day
Source: EIA, 2013.
In terms of biodiesel’s global trading, Europe is the main importer of biodiesel produced in the U.S., Argentina, Asia and Canada, as illustrated in Appendix C. This suggests that the majority of biodiesel produced by Germany, France, Spain and Italy is not sufficient to match
2008 % of total 2009 % of total 2010 % of total 2011 % of total United States 44.1 16.8% 33.6 10.9% 22.4 6.6% 63.1 15.6% Germany 55.0 21.0% 45.0 14.6% 49.0 14.5% 52.0 12.9% Argentina 13.9 5.3% 23.1 7.5% 36.0 10.7% 47.3 11.7%
Brazil 20.1 7.7% 27.7 9.0% 41.1 12.2% 46.1 11.4%
France 34.4 13.1% 41.0 13.3% 37.0 11.0% 34.0 8.4%
Indonesia 2.0 0.8% 6.0 1.9% 8.0 2.4% 20.0 5.0%
Spain 4.3 1.6% 14.0 4.5% 16.0 4.7% 12.0 3.0%
Italy 13.1 5.0% 15.6 5.0% 14.5 4.3% 11.2 2.8%
Thailand 7.7 2.9% 10.5 3.4% 11.0 3.3% 10.2 2.5%
existing demand in the region; consequently, requiring additional supply from other large producers (EDENHOFER; MADRUGA; SOKANA, 2012).
2.2.3 Fossil Fuel Comparison
According to Romano et al (2011), there are environmental, safety and healthy advantages of biodiesel use as a replacement for diesel fuel. Some of benefits are:
• Renewable source from vegetable oil or animal fats;
• Lower toxicity and reduced carcinogenic substances than diesel; • Lower carbon monoxide (CO) emission and particulate matter; • Degrades faster than diesel, which is positive on spills;
• No sulfur dioxide (SO2) emissions;
• Higher flash point (100°C minimum) or less flammable than diesel.
On the other hand, for Romano et al (2011) there are also disadvantages in the use of, which are mostly related to efficiency and practical use. Some of the weaknesses are:
• Lower calorific value of biodiesel, which results in higher fuel consumption; • Inconvenient in cold climates due to its higher freezing point;
• Long-term storage is not recommended;
• May degrade plastics and natural rubber gaskets and hoses in the engine; • Higher nitrous oxide (NOₓ) emissions;
• Dissolves sediments in the storage tank potentially damaging the injection system.
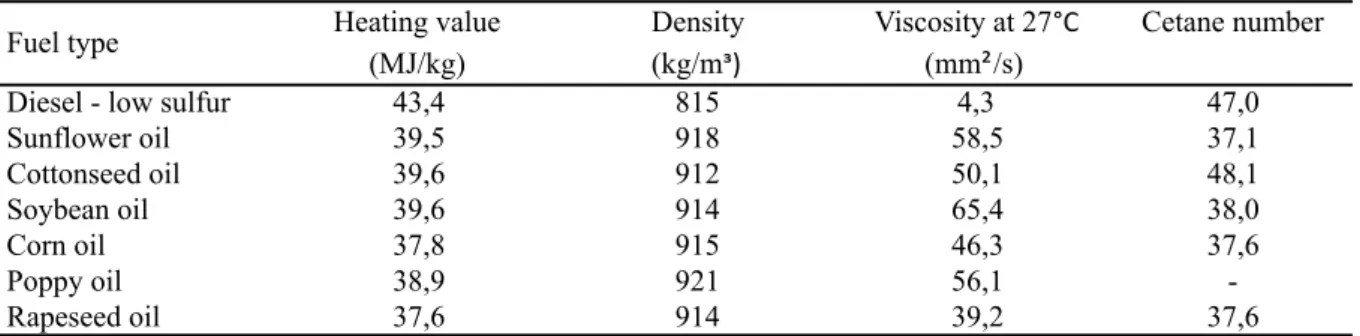
Gupta et al (2010), as depicted in Table 13, show that diesel fossil fuel has one of the highest heating values compared to biodiesel from different vegetable oil sources. In addition, diesel has a relatively high cetane number, but viscosity is much lower compared to biodiesel.
fuel price is the high price of the later, reflecting the high cost of food (GUPTA; DERMIBAS, 2010).
Table 13 – Fuel properties of vegetable oils and diesel
Source: GUPTA; DEMIRBAS, 2010.
2.3 Public Policies for Biofuels
Public policies are conscious choices that result from government’s decision. Public policies are composed of two interrelated elements: policy goals and policy means. Policy goals are the aims and expectations that result in a course of action or not, while policy refers to the techniques that could be used to achieve those goals (HOWLETT, 2011).
The means of techniques to achieve public policy goals could specific government tools such as regulation, information campaigns, public enterprises or government subsidies to change a behavior (HOWLETT, 2011).
Energy policy covers issues related to the production, distribution and consumption of energy, including international treaties. The manner that a government decides to address these issues could be over specific legislation, incentives to invest, guidelines for energy production and consumption, taxations, among others (GUPTA; DERMIBAS, 2010).
Further developments in biofuels production will largely continue to rely on public policy support. The limited GHG emission savings from some biofuel alternatives limits the argument for including this energy conversion method in climate mitigation policies. Nevertheless, the reduction in dependence from imported oil remains an important argument for continue policy support (EIA, 2012).
Heating value Density Viscosity at 27°C Cetane number (MJ/kg) (kg/mᶟ) (mm²/s)
Diesel - low sulfur 43,4 815 4,3 47,0
Sunflower oil 39,5 918 58,5 37,1
Cottonseed oil 39,6 912 50,1 48,1
Soybean oil 39,6 914 65,4 38,0
Corn oil 37,8 915 46,3 37,6
Poppy oil 38,9 921 56,1
-Rapeseed oil 37,6 914 39,2 37,6
Biofuels, which includes biodiesel and ethanol, should receive $46 billion in subsidies by 2020 and $59 billion by 2035 versus $24 billion received in 2011. Subsidies to biofuels are largely concentrated in the European Union, which allocated $11 billion to biofuels in 2011, mostly in biodiesel. In the same year, the U.S. allocated $8 billion to biofuels, mostly to ethanol (EIA, 2012).
With new standards defined in 2010, the full implementation of Renewable Fuel Standards (RFS) in the U.S. should increase annual tax credits subsidies for biofuels to $27 billion in 2022. The total liability from 2008 through 2022 is estimated to achieve $200 billion (SCHNEPF; YACOBUCCI, 2010).
The American Taxpayer Relief Act of 2012 defined the U.S. federal tax credits available for biofuels during the fiscal year of 2013. For biodiesel and renewable diesel the tax credit is $1.0 per gallon. Small agri-biodiesel producer is entitling to $0.10 per gallon for the initial 15 million gallon production with production capacity below 60 million gallons (KPMG, 2013).