Glass Phase Expelling During Liquid Phase Sintering of YSZ
Milton Ferreira de Souzaa, Dulcina Pinatti Ferreira de Souzab
a
Departamento de Física e Ciência de Materiais, Universidade de São Paulo,
C.P. 369, 13.560-970 São Carlos - SP, Brazil;
e-mail: [email protected]
bDepartamento de Engenharia de Materiais,
Universidade Federal de São Carlos,
C.P. 676, 13.565-905 São Carlos - SP, Brazil; e-mail: [email protected]
Received: July 2, 1998; Revised: August 20, 1998
Expelling of the liquid phase during sintering of ZrO2-6.5 mol% Y2O3- 0.5 mol% Pr2O3 ceramic
was observed as a result of grain coarsening. ZrO2- 7.0 mol% Y2O3 samples, without Pr2O3 addition,
do not show this effect under the same sintering conditions. The expelling process is caused by surface tension forces and attracting van der Waals forces between the grains, coupled with the existence of two glass phases on the grain boundaries. The amount of expelled glass phase increases with grain growth, but saturates above 16 µm average grain size.
Keywords:liquid phase sintering, glass expelling, zirconia
1. Introduction
Glass phase expelling during ceramic liquid phase sin-tering at atmospheric pressure is an uncommon phenome-non. Expelling must be distinguished from superficial grain wetting, a very common process. Large liquid masses are involved in the expelling process, resulting in the formation of glass drops of up to 30.0 µm on the external ceramic surface. Ceramic liquid phase sintering was discussed for the first time by Kingery1. An analysis of the capillary forces during liquid phase sintering was given by Cahn and Heady2. Expelling of the liquid phase from the grain bound-ary under the action of external forces was discussed by Lange3. Liquid phase expelling during ceramic sintering under atmospheric pressure, however, has not been treated in the literature, to our knowledge.
This paper discusses the conditions necessary for glass expelling in order to understand the experimental results on silicate liquid phase sintering of Yttria stabilised Zirconia with a small addition of Praseodymia.
1.1. Theoretical background
For the purpose of clear and comprehensive considera-tions, a short review of surface tension and the resulting
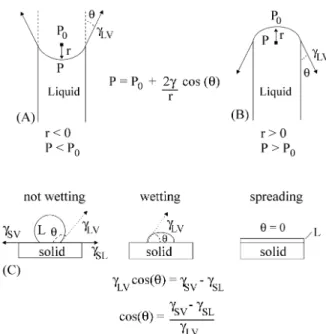
forces on ceramic grains is presented. Let us consider a wetting liquid phase inside a solid tube, as indicated in Figs. 1A and 1B. The difference in pressure between the two faces of the surface exposed to air is expressed by
P − P0 = γLV cos θ ( 1
r1 +
1
r2 ) (1)
where r1 and r2 are the principal curvature radii of the
liquid-vapour interface and γLV the liquid-vapour
interfacial tension4. Another representation for the interfacial tension is to consider the associated forces, as illustrated in Fig. 1C, where the contact between a solid, S, and a liquid, L, and their vapours, V, is shown. In this case γSL, γLV, and γSV are the interfacial tensions between
solid-liquid, liquid-vapour, and solid-vapour, respectively, in a vector representation.
Let us take the grain boundary of a polycrystalline liquid phase sintered material as being the region of thick-ness δgb between two plane surfaces of length d, and width
in this paper, but internal forces between grains and exter-nally applied forces will be considered.
In applying Eq. 1 to Fig. 2A, the principal curvature radii are -r and ∞. The maximum absolute value for r is r = δgb / 2 corresponding to cos θ = 1. Therefore, according
to Eq. 1, although the pressure decreases in the liquid relative to Po, surface tension forces will cause the plates
to approach each other. It is a well-known fact that this process occurs during the first stage of ceramic liquid phase sintering. The grains get closer to each other until the repulsive forces between the two grains equilibrate the difference in pressure1. In the absence of other forces, the grain boundary thickness, δgb, will become thinner and full
of the liquid phase. In this situation, the contact angle, π, will become θ = π/2 , reaching equilibrium because the internal and external pressures become equal, as shown in Fig. 2B. Figure 2C shows the opposite situation: the
inter-nal pressure between the plates is larger than the exterinter-nal pressure. According to Eq. 1,
PC = Po + γLVcosθ
rc (2)
In this case, the capillary forces would pull apart the plates. The maximum pressure between the plates is given by
PC max = Po + 2γLV
δgb (3)
Therefore, the maximum force that can be applied to the plates, other than the isostatic external pressure, is limited to the over pressure in the liquid phase, as expressed by Eq. 3. Without the application of forces on the plates, the capillary forces will separate the grains until θ becomes θ = π/2, the equilibrium configuration.
Let us now consider grain coarsening during the liquid phase sintering process of a ceramic body under atmos-pheric pressure. Grain growth results in a decrease of the total grain surface area, causing an increase of the grain boundary liquid phase thickness. Under the imposed con-ditions shown in Fig. 2C, considering Eq. 3 and the absence of forces other than the capillary ones, no liquid phase can be expelled because the capillary forces change the con-figuration to equilibrium, as shown in Fig. 2B. Penetration of ceramic bodies by liquid glass phase5,6 is a similar case. The liquid phase can penetrate the sintered ceramic body, increasing the ceramic body’s volume by as much as 40%. Large amounts of liquid can penetrate the solid body if the liquid phase fully separates the grains, the ceramic grains remaining in suspension in the liquid glass and the solid shape tending to be spherical.
In the above-described situations, it has been assumed that ceramic grains are fully separated by the liquid phase. This may, however, not be the case if attractive forces between the grains are taken in account. Attractive van der Waals forces and repulsive forces resulting from the dis-torted chemical bonds in the solid-liquid interface deter-mine the limiting thickness of the glass phase in the grain boundary. According to Clarke7, the equilibrium between these forces is reached when the thickness is near 2.0 nm. Therefore, full penetration implies that the internal pressure must be sufficient to overcome these attractive forces. It may be that parts of the grain boundary are thin while other parts are thicker in ceramic bodies sintered by liquid phase sintering. Attractive forces allow the internal pressure dur-ing grain growth to increase, stabilisdur-ing the situation shown in Fig. 2C. If the attractive forces are sufficiently strong to allow the internal pressure to be higher than the pressure given by Eq. 3, then the wetting liquid glass phase will be expelled from the ceramic and will spread over its external surface. At intermediate stages, only part of the grain
Figure 2. Two plane plates simulating two grains with a grain boundary liquid phase. A- Plates are kept apart by applied external forces; B- null external forces; C- compressing external forces.
boundary will be expanded to make room for the liquid glass phase, producing a grain boundary microstructure showing thick and thin regions.
2. Experimental
Ceramic discs, whose composition is given in Table 1, were isostatically pressed at 200 MPa and sintered at 1610 and 1550 °C for several different time intervals inside alumina crucibles, with the plane face in the vertical posi-tion. A reference composition, free of the rare earth doping, was also prepared where the Pr2O3 concentration in Table
1 wassubstituted by Y2O3. Cooling rates were of 1000 °C/h.
Microstructural observations were done using SEM (Zeiss 9600, Germany) and optical microscopy (Leica DMRX, Germany) on both polished and unpolished samples. Grain size was measured by the interception method along several directions in the micrographs. Quantitative EDS analysis (Link Analytical QX 2000, England) of the glass phases and ceramic grains are shown in Table 2. The data pre-sented in this table represents the average of ten measure-ments in different parts of the sample. The mass of expelled glass was measured as follows. The sintered ceramic discs were weighed, observed under the optical microscope and carefully sanded on a 600 grit silicon carbide emery paper. This sequence was repeated until the glass drops on the surface of the disc surface disappeared. A second process was used on a few samples for purposes of control. The number of large glass droplets was counted and their aver-age diameter and height measured with the help of sensitive thickness measuring equipment for thin films (Talistep, England). The maximum observed height was 35.0 µm and the contact angle of the glass droplets with the ceramic
surface was 25°. The rounded shape of the upper part of the glass surface was observed in an inverted optical mi-croscope through circular Newton rings. Sample densities were measured by the water immersion technique. The infiltration experiments were done as follows. A small pellet with G1 composition was placed on the surface of an already sintered ceramic pellet, infiltrated at 1610 °C for 6.0 h and cooled at 1000 °C/h rate. The pellets were cut in the transversal direction by a diamond saw and polished.
3. Results
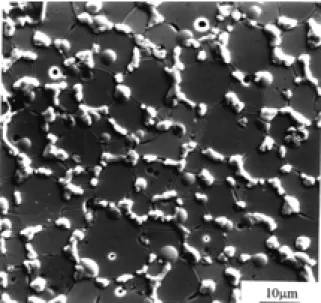
The density of sintered discs was found to be 5.7 g/cm3, with 1% standard deviation during the entire sintering time of 0.5 to 16.0 h. The expelled glass phase around the grain boundaries of a ceramic disc sintered at 1550 °C is clearly shown in the micrograph of Fig. 3. Spreading is low when compared with sintering at higher temperatures, probably due to the high viscosity of the expelled glass. Figure 4 shows the optical micrograph of the expelled glass phase
Table 1. Chemical compositions of the samples (mol%).
ZrO2 Y2O3 Pr2O3 Al2O3 TiO2 CaO SiO2
89,5 6,5 0,5 0,5 0,12 0,12 2,5
Table 2. Average compositions of grains and glass phase (mol %).
Expelled glass (G1)
Grain boundary glass (G2)
Grain
Al2O3 9,0 9,0 Trace
CaO 1,8 2,1 Trace
SiO2 74,6 69,0 0,5
ZrO2 2,0 7,2 92,4
TiO2 1,0 1,1 Trace
Y2O3 5,5 6,7 6,5
Pr2O3 6,0 5,0 0,3
Figure 4. Optical micrograph of expelled glass phase on YSZ ceramic after 8.0 h of sintering at 1610 °C.
on the surface of a ceramic disc sintered at 1610 °C during 8.0 h. In this case, the expelled glass coalesces into large glass droplets owing to its lower viscosity. It does not, however, spread over the ceramic surface. The reference sample, free of Praseodymium, and sintered at 1610 °C for 16.0 h did not show an expelled glass phase. Two glass phases are present in the ceramic discs with different com-positions: the one that remains inside the grain boundaries and the expelled phase, G2 and G1, respectively. Table 2 shows the composition of these two phases as well as that of the ceramic grains. The G2 phase and the EDS grain analysis were done after polishing and thermal etching of the ceramic discs, while the G1 phase was analysed in the discs after sintering without polishing.
Although EDS analyses were done on the thicker part of the G1 droplets, its measured zirconium concentration may be excessive due to the ceramic substrate’s XR emis-sion. Table 2 shows that Praseodymium is strongly segre-gated to the liquid phase while the Yttrium segregation coefficient is close to 1.0, with almost no segregation. The G2 phase composition has a higher zirconia and lower silica
concentration than the G1 phase. The grain boundary glass composition was also analysed in the transversal plane of the pellet and the same G2 composition was found. Figure 5 shows the expelled mass for several sintering times. Maximum deviation on the expelled mass was 15%.
Expelled mass increases with the sintering time with saturation for times over 8.0 h. Average grain size was measured with a standard deviation of 10% and its growth with sintering time is shown in Fig. 6.
The kinetic of grain growth agrees well with the char-acteristic of grain coarsening in liquid phase sintering, Eq. 4:
D3− D3
o= K t (4)
where D is the average grain size, t is the sintering time and K a constant1. The microstructures of the ceramic discs sintered at 1610 °C for 16.0 h and polished are shown in Fig. 7. Two types of microstructures are shown. One of these - the one most frequently found in the discs - has its grain boundary characterised by very thin and thick regions, while in the other the grain boundary has the same thickness between two triple points. Very few pores were found, and all of them were glass filled.
Figure 8 shows the correlation between the expelled mass and the inverse of grain size. As the inverse of average grain size correlates with the grain size, this figure shows that glass expelling depends on the internal pressure gen-erated by the decrease of the internal area for the glass phase. Figure 9 is a micrograph of a transversal section of a ceramic disc, where an excess of glass of G1 phase was infiltrated at 1610 °C during 4.0 h, in order to thicken the glass phase around the ceramic grains and facilitate obser-vation of the glass phase separation. Small droplets of a
Figure 5. Expelled glass phase mass for several sintering times at 1610 °C.
Figure 6. Grain size growth dependence with sintering time at 1610 °C.
second phase can be seen in the glass phase, the darker part of the micrograph.
4. Discussion
The results of the previous section clearly illustrate the expelling of a glass phase, G1, whose composition is
dif-ferent from the other glass phase, G2, that wets the ceramic grains. Expelling through the grain boundaries that inter-cept the ceramic disc surface generate glass droplets that further coalesce into larger droplets but do not spread onto the ceramic grains where their contact angle is 25°. The infiltration experiment was done to verify that at least two glass phases were present in the grain boundaries, showing the presence of spherical droplets in the glass phase. The presence of two glass phases in the grain boundaries can therefore be taken for granted.
According to Mendelson8, the total surface grain area, Sg, relates to the average grain size, Dg, a
Sg = C
Dg (5)
where C is a constant that depends on grain shape and average grain size distribution. Thus, considering the linear relation between the expelled mass, Mex, with the inverse
of the average grain size, Dg, shown in Fig. 8, the following
relation holds true
Mex = K (Sgo − Sg) (6)
where Sgo is the total grain surface area when the expelling
process starts, and K the proportionality constant. Assuming the volume of sintering liquid phase is constant, the internal pressure in the sintering disc should increase if constraints are present between the grains, or the grain boundary thickness should increase to alleviate the internal pressure completely if only capillary forces are present. It is, therefore, necessary to know if internal constraints are present.
Figure 7 shows that the grain boundary is characterised by thick and thin regions. We assume that thin regions have thickness close to 2.0 nm, as calculated by Clarke7, for the equilibrium thickness of a glassy phase between two ce-ramic grains. Two experimental results are presented to support this assumption. First, the strong electrical conduc-tivity shown by these samples resulting from percolation through the thin grain boundary regions9. Second, the find-ings of Godickmeier et al.10 for the grain boundary thick-ness of silicate sintered T3YZ. The grain boundary thickness found by these authors is very close to 2.0 nm. Therefore, the thin grain boundaries shown in Fig. 7 are regions where the attractive forces are still present because insufficient pressure was applied to pull the grains apart. Glass expelling will be analysed taking into account these forces between grains.
The internal pressure of ceramic discs generated by the decrease in the total grain surface area can become relaxed by glass expelling if there are internal constraints such as the attractive forces between grains. There are two ways for glass expelling to occur. The first case occurs when the internally developed pressure is larger than the maximum given by Eq. 3. The other possibility is expelling of a glass phase, such as the G1 phase, unrelated to the interfacial tension between the wetting glass phase and the ceramic grains. In the latter case, the G1 phase will move out of the ceramic body under the gradient pressure generated by the grain growth, the pressure increasing from the surface to the central part of the body.
The results of our experiments can be summarised as follows: a) attractive forces between the grains are present; b) decrease of the internal total grain area maintains a linear
Figure 9. Transversal cut on the glass infiltrated region in zirconia plate showing glass phase separation (small spheres in the black regions) done at 1610 °C by G1 glass composition.
relation with the expelled mass; c) glass phase separates in the glass inside the grain boundaries. From these results it can be concluded that G1 glass expelling results from alleviation of the internal pressure. The increase of internal pressure is a result of the reduction of the total grain surface area and the attractive van der Waals forces between the grains. This increase of internal pressure is lower than the maximum allowed by Eq. 3 because no detectable amount of G2 phase was found on the ceramic grains’ external surface. Another independent way for pressure relaxation would be partial grain separation in the thin regions. Ac-cording to this hypothesis, average grain boundary thick-ness would increase and grain boundary conductivity would decrease, contrary to our earlier findings9. There-fore, G1 phase expelling was the only relaxation process for alleviation of the internal pressure, and also the pressure increase originating from grain growth was not sufficient to overcome the attractive forces among grains.
Praseodymium and Yttrium oxide additions to the glass phase properties contribute to the glass expelling process. It has been found by Kohli et al.11 that rare earth and Yttrium aluminosilicate glasses contain a broad distribu-tion of non-bridging oxygens, NBO, which increase in concentration with increasing concentrations of rare earth and Yttrium oxide concentrations. The presence of NBO must contribute to lower the viscosity of G1 and G2 phases, but the G1 phase is expected to have an even lower viscos-ity due to its much lower ZrO2 concentration. Although
Kohli et al. have found that all rare earth oxides produce NBO in aluminosilicate glass, the expelling process de-pends on the rare earth’s ionic radius. Large ionic radius ions show a high segregation relative to the zirconia grains, increasing their concentration in the glass phases. The same behaviour was found for other large ionic radius ions, Nd+3, Ca+2, Sm+3, but not for smaller ions as Er+3, Yb+3, Y+3 and Gd+312.
5. Conclusions
The otherwise impossible glass phase expelling ob-served during grain coarsening in liquid phase sintered ZrO2- 6.5 mol% Y2O3- 0.5 mol% Pr2O3 ceramic is possible
due to glass phase separation of the sintering liquid. The necessary conditions for increased internal pressure was found to be the grain growth and the attractive van der Waals forces between the grains. However, the internal pressure increase is limited by expelling of part of the glass phase. For glass expelling to be in accordance with the theoretical model the presence of two glass phases is
nec-essary: one that fully wets the grains and the other, which will be expelled, with higher interfacial tension with the grains, as was found experimentally. The main difference in composition between these two phases is in the ZrO2
concentration. However, the presence of Pr2O3 in the glass
composition was found to be necessary because the ce-ramic sample composition ZrO2-7.0 mol%Y2O3 did not
show glass expelling during sintering.
Acknowledgments
The financial support from FAPESP is gratefully ac-knowledged. The authors also express their appreciation to Professor Rolo for his help with the optical micrographs and to W.L.M. Esteves for the stimulating discussions.
References
1. Kingery, W.D. J. Appl. Phys., v. 30, n. 3, p. 301-306, 1959.
2. Cahn, J.W.; Heady, R.B. J. Am. Ceram. Soc., v. 53, n.7, p. 406-409, 1970.
3. Lange, F.F. J. Am. Ceram. Soc., v. 65, n. 2, p. C-23, 1982.
4. Chiang, Y.M.; Birnie III, D.; Kingery, W.D. Physical Ceramics, Principles for Ceramic Science and Engi-neering, John Wiley & Sons, New York, 1997. 5. Marion, J.E.; Hsueh, C.H.; Evans, A.G. J. Am. Ceram.
Soc., v. 70, n. 10, p. 708-713, 1987.
6. Flaitz, P.L.; Pask, J.A. J. Am. Ceram. Soc., v.70, n. 7, p. 449-455, 1987.
7. Clarke, D.R. J. Am. Ceram. Soc., v. 70, n. 1, p. 15-22, 1987.
8. Mendelson, M.I. J. Am. Ceram. Soc., v. 52, n. 8, p. 443-446, 1969.
9. De Souza, M.F.; De Souza, D.P.F. submitted to the J. Mater. Sci.
10. Godickmeier, M.; Michel, B.; Oliukas, A.; Bohac, P.; Sasaki, K.; Glaucker, L.; Heinrich, H.; Schwander, P.; Kostorz, G.; Hofman, H.; Frei, O. J. Mater. Res., v. 9, p. 1228-1240, 1994.
11. Kohli, J.T.; Condrate, R.A.; Shelby, Snr & J.E. Phys. Chem. Glasses v. 34, n. 3, p. 81-87, 1993.