1. The introduction
Wars strongly promoted the study regarding work, the conditions in which these activities are developed and the risks involved in their implementation. Discomfort levels, stress, temperatures and extreme physical exertion, in addition to combat, drove the need for devices or techniques that would provide reliability and maximize performance in order to avoid material and/or human losses. Seeking to meet this new demand, there was real progress related to the study of industrial designs of the period (Leitão et al., 2008).
Nowadays, the increase in market competitiveness due to globalization, and the search for productivity, has created more variables in work dynamics that pose risks of harm to workers. Thus, risk has become a variable that is present in workplaces, and every profession and activity has a specific risk-level, usually linked to its particular tasks (Wang et al., 2013).
Therefore, occupational risk is the possibility that some element included in the work environment may cause damage to health and result in physical and psychological repercussions in the short and long term (Areosa, 2012; García-Herrero et al., 2013a; Wang et al., 2013). This concept came from several areas of knowledge, such as safety engineering, hygiene, medicine and physiology of labor, toxicology and epidemiology, drawing different interpretations from these disciplines (Khakzad et al., 2013b).
Thus, one can understand risk as the product of probability and consequences. Therefore, it cannot be analyzed statically due to constant, environmental and organizational changes in companies, and cannot be eliminated in its totality. Hence, it is important to prioritize its reduction and its impacts by using strategies in terms of interrupting the progression of the incident, control mechanisms, and education of those ones involved. The purpose is to seek a greater awareness of health issues and occupational safety (Khakzad et al., 2013a; Weber et al., 2012).
Modeling Bayesian Networks from a conceptual
framework for occupational risk analysis
Elamara Marama de Araujo Vieiraa*, Jonhatan Magno Norte da Silvaa, Luiz Bueno da Silvaa aUniversidade Federal da Paraíba, João Pessoa, PB, Brazil
*elamaravieira@gmail.com
Abstract
Occupational risk is the possibility that some element included in a particular work environment can cause damage to someone’s health. Thereby, the risk is understood as the product of probability and consequences. In this sense, risk analysis through probabilistic stochastic techniques, such as Bayesian networks (BN), becomes an important tool to analyze occupational risks. Thus, this article aims to show how BNs are being used in the field of occupational risk analysis, and to develop a conceptual framework for the construction of the BNs. Therefore, a systematic review analogous to the Statement for Reporting Systematic Reviews (PRISMA) protocol was performed, which allowed the evaluation of learning methods with the BN, building models and also for us propose a conceptual framework for the implementation of BNs in the analysis of occupational risks.
Keywords
Risk analysis. Bayesian networks. Occupational risk.
Taking into account the relationship between risks and its predictor variables, one of the methods that has emerged as an option for analysis of occupational risks is the Bayesian Networks (BN) method. This is a multivariate probabilistic inference method used in many areas of knowledge, mainly because it favors the resolution of complex problems by using a robust technique, and also allows the calculation of probability values from the causal relationship between each safety factor, as well as extracting information from data sets (Abdat et al., 2014; Arlinghaus et al., 2012; Tighe et al., 2013; Valdés et al., 2011; Wang et al., 2012; Weber et al., 2012).
Therefore, the assessment of occupational risk depends on the previous understanding of the risk scenario, which permeates uncertainty in the light of new evidence. This allusion has interfaces with the Bayesian perspective, thus, to a theoretical essay, this article aims to show how the BNs are being used in the field of analysis of occupational risks, and to develop a conceptual framework for the construction of the BNs in the field of study mentioned.
2. The methodology
2.1. Stage I: building the theoretical framework
It was initially performed a systematic review of the literature through the Statement protocol for Reporting Systematic Reviews (PRISMA). This method consists of a practical guide, containing a checklist of items considered essential for structuring systematic reviews and meta-analysis (Liberati et al., 2009). The literature review was conducted in 2015 digital database Web of Science, Scopus and Science Direct, using as keywords the terms Bayesian Network, Risk Analysis, Occupational risk and Workplace. Supported in this protocol, the procedures for the selection of research projects and articles that have the BNs application interface in occupational risk analysis are presented in Figure 1.
2.2. Stage II: the construction of the BNs
From the protocol used and obeying the flowchart at the stage I, it was characterized the structure of a Bayesian network, observing the possible causes from the relationships among the factors involved in occupational risks.
2.3. Stage III: structural proposal of application of BNs
From the completion of steps I and II, it was captured on the selected studies the peculiarities concerning the analysis of occupational risks through the BNs. Thus, the methods of learning with BN were evaluated, and through the concepts of BN and the structure of the directed acyclic graph (DAG), a methodological model was built for the application of BNs in the contribution of occupational risks evaluation according to the following methodological procedures, namely: Identification of the Model’s Purpose (IMP); Ordination of Data (OD); Model Construction (MC); Validation of the Model (VM).
3. The results
3.1. Stage I: building the theoretical framework
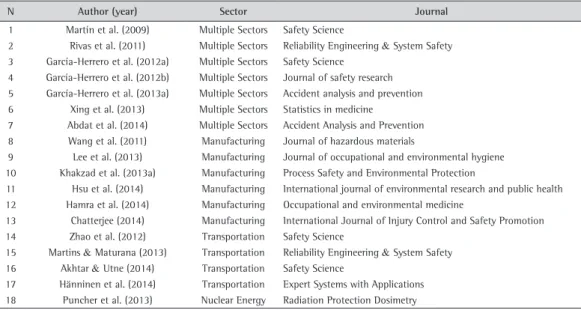
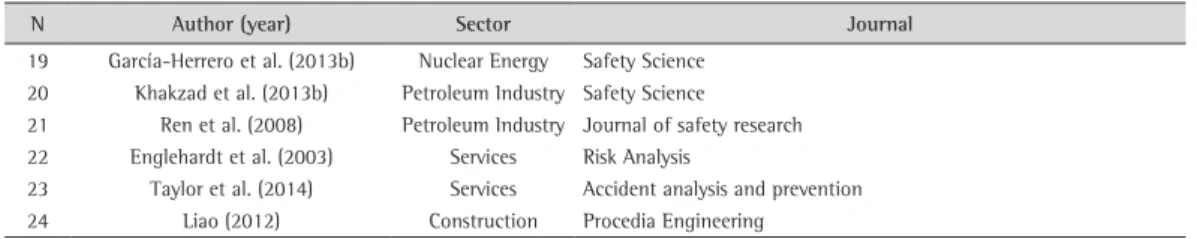
In order to achieve the proposed objective, initially 647 articles were identified, in which, considering the inclusion criteria, 24 articles were selected (Table 1). Furthermore, it was observed that most application studies of the BNs in the analysis of occupational risk occurred in the industrial and transportation sector. The most relevant journal for this study was “Safety Science” contributing with 6 items, as seen in the Table 2. The Table 3 classifies articles according to the productive sector in which it is applied and the features of the model building, considering information related to occupational risk factors and procedures for data processing.
Table 1. Quantitative of the filtered articles.
Procedure nº
Beginning 647
Removal of duplicates 451
JCR 376
Adequate to Title 56 Adequate to the summary 24 Total of selected papers 24
Table 2. Quantitative of the article by a sector of application and journal.
N Author (year) Sector Journal
1 Martín et al. (2009) Multiple Sectors Safety Science
2 Rivas et al. (2011) Multiple Sectors Reliability Engineering & System Safety 3 García-Herrero et al. (2012a) Multiple Sectors Safety Science
4 García-Herrero et al. (2012b) Multiple Sectors Journal of safety research 5 García-Herrero et al. (2013a) Multiple Sectors Accident analysis and prevention 6 Xing et al. (2013) Multiple Sectors Statistics in medicine
7 Abdat et al. (2014) Multiple Sectors Accident Analysis and Prevention 8 Wang et al. (2011) Manufacturing Journal of hazardous materials
9 Lee et al. (2013) Manufacturing Journal of occupational and environmental hygiene 10 Khakzad et al. (2013a) Manufacturing Process Safety and Environmental Protection
11 Hsu et al. (2014) Manufacturing International journal of environmental research and public health 12 Hamra et al. (2014) Manufacturing Occupational and environmental medicine
13 Chatterjee (2014) Manufacturing International Journal of Injury Control and Safety Promotion 14 Zhao et al. (2012) Transportation Safety Science
15 Martins & Maturana (2013) Transportation Reliability Engineering & System Safety 16 Akhtar & Utne (2014) Transportation Safety Science
Table 3. The number of articles from the methodological characteristics of the BNs.
Characteristics Options Industry Transportation Building Services Petroleum Industry
Nuclear Energy
Data type
Organizational 6 4 3 1 1 1
Health and safety 4 2 2 2
Work demands 5 4 4
Human factors 2 1 1 1
External factors 1
Equipment failure 1 1 1 1
Ergonomic 2 2 1
Data gathering
Database 3 4 2 1 1
Questionnaire 7 5 5 1 1
Mensuration 2 2
Activity analysis 1 1
Learning method Algorithms 7 1 5 4 3
Algorithms + experts 4 3 1 1 2
Validation
By experts 1
Comparable models 2
Sensitivity analysis 4 2 3 3 1
Software
Netica 1
Hugin 2 2 1 1 1 1
Netica + Hugins 2 2 2
Analist 1
Genie 1 2 1
R 1
Indefinite 3 1 2 1
Supplementary methods
Bow-tie 1 1
Fault Tree 1
Structural equation
model 1
Models of human
factors 1 1
N Author (year) Sector Journal
19 García-Herrero et al. (2013b) Nuclear Energy Safety Science 20 Khakzad et al. (2013b) Petroleum Industry Safety Science 21 Ren et al. (2008) Petroleum Industry Journal of safety research 22 Englehardt et al. (2003) Services Risk Analysis
23 Taylor et al. (2014) Services Accident analysis and prevention
24 Liao (2012) Construction Procedia Engineering
Table 2. Continue...
3.2. Stage II: the construction of the BNs
The relationship between random variables guides the use of BN in the identification of occupational risk, represented in this case by risk factors, depending on the circumstances in which these variables are represented in the workplace. The Bayesian technique, at first, consists in the formalization of distribution, reflecting the beliefs of the researcher on the subject, which combined to the actual information obtained about the domain studied via inference in BN, results in a posterior probability distribution, in which is possible to draw conclusions. Therefore, the BN has basically two components: a qualitative, represented by a directed acyclic graph (DAG), formulated from the previous knowledge of risk exposure, and where it is established the dependency relationships between variables; and a quantitative component, where it is possible to identify the distribution of conditional probability (Guerrero-Barbosa & Amarís-Castro, 2014).
Xi is conditionally dependent (Aneziris et al., 2010; Friedman et al., 1997; Leu & Chang, 2013; Pearl, 1988; Schenekenberg et al., 2011).
( 1 2 ) ( )
1
, , , |
=
… n =
∏
n i i iP X X X p X π (1)
The structure of DAG is defined by two elements: nodes and arrows. Each note in the graph represents a random variable, while the arrows between the nodes represent the probabilistic relationship of dependence between the corresponding variables.
The arrow of a node Xi to a node Xj represents a statistical dependence between variables, and these connections can be simple, that is, when there is only one path that connects one variable to the other, or multiple in the existence of various paths. Thereby, the arrow indicates that Xj depends on the value of Xi node. The latter is then referred to as the parent node, and Xj as the child node.
The structure of DAG ensures that there is no node that can be its own parent or child, as the graph is acyclic. Such condition is essential to the reliability of data. One has for example, the DAG shown in Figure 2 containing the variables X1, X2 and X3, which may be represented by elements of the working environment that offer danger to the professional.
Figure 2. The directed acyclic graph of a BN.
The next stage is to specify the distributions of a priori probability for each variable based on hypotheses, considering the spread of risk from their parent nodes. In this case, the distributions are P(X1), P(X2│ X1) and P(X3│ X1, X2) (Griffiths & Yuille, 2006; Jordan, 1999; Pearl & Russel, 2001).
Markov property regulates the structure of DAG, which identifies independence assumptions, in which every variable Xi is independent of the nodes other than its parent nodes in the graph. This is used to reduce the number of parameters required for joint probability distribution.
Such reduction provides benefits on inference, learning (parameter estimation) and on computational perspective, and the resulting model is more robust to determine the effects, the trend and the variance (Aneziris et al., 2010; Friedman et al., 1997; Leu & Chang, 2013; Pearl, 1988; Schenekenberg et al., 2011). With the structure of the BN set, and after the estimation of network parameters, one can then obtain the posterior probability distribution, and based on these data, infer about the occupational risk (Delcroix et al., 2013; Lee et al., 2013).
3.3. Stage III: structural proposal of application of the BNs
through the BNs satisfies this logic, as it stimulates stochastic processes (Englehardt et al., 2003; Hsu et al., 2014; Puncher et al., 2013; Xing et al., 2013).
Once identified the structure of the network, probabilistic and computational calculations performs the inference of the quantitative parameters of the model, with a possible interaction of the theoretical knowledge of experts about the risk scenario that involves a specific problem. So, one can reach a consistent amount of exposure to the occupational risk with attenuation of possible biases (Lee et al., 2013; Englehardt et al., 2003). Therefore, hypotheses and assumptions about the interactions of risk factors, not treating the data methodically can turn its validity questionable and contaminated by personal beliefs base the understanding of the approach designed by BNs, despite being mitigated by the use of software.
Thus, for the construction of modeling in BN, it is required previous subjective knowledge, and to be associated with the fact that algebra of Bayesian analysis is more complex than the classical analysis, especially in multidimensional problems, making the BNs little used for analysis of occupational risk (Aguilera et al., 2011). Based on the results obtained in stages I and II, a methodological flow was built from the application of the BNs in the evaluation of the occupational risks according to the following methodological procedures, namely: IMP; OD; MC; and VM.
3.3.1. Identification of the model’s purpose (IMP)
Initially, the construction of the BNs requires a characterization of the risk scenario in terms of relationships between variables and characteristic of the relationship. For a description of the risk scenario, it is necessary to understand the sequence of events that leads to failure, it is understood as failure the undesired effect that leads to accident or injury to health.
Allowing the understanding of how a harmful event is spread and recognize the trigger event (an event that starts the chain of harmful events), to identify the hypotheses and assumptions governing the relationship between occupational risk variables (García-Herrero et al., 2012a; Hänninen et al., 2014; Wang et al., 2011). The assumptions externalize the previous knowledge of the studied domain, and can be formulated from previous studies, knowledge of experts or through the use of predictive probability distributions (Hamra et al., 2014).
Knowing how the work is performed allows the identification of the variables that are involved in the sequence of events that leads to failure, which will be converted into nodes in the DAG of the BN. Most of the works built modeling from organizational characteristics, especially in the industrial and transport sector, followed by the variables “work demands” and “ergonomics”. Some of the risk factors adopted as nodes in the DAG are variables related to the experience of the professional, task duration and the training type of professional, knowledge of safety regulations, risk perception, seat belt use, incorrect posture and others (Martín et al., 2009).
The research features shape the form of data acquisition, in this stage. The most widely used methods have been the collection through questionnaires, favored because it is a simple and fast method that enables the capture of large amounts of information in a short period of time (Chatterjee, 2014; Rivas et al., 2011; Taylor et al., 2014).
3.3.2. Ordination of data (OD)
The complexity of the model grows positive and exponentially due to the number of variables and relationships between them, and thus, more robust models require techniques of analysis of more accurate and effective data. Thereby, it is called attention to the selection of the number of variables and identification of the types of relationship between them. Recall that the BNs have the ability to handle continuous or hybrid data, which requires the use of specific algorithms, or even the need for discretization of data with consequent loss and generalization of information (Aguilera et al., 2011; Chatterjee, 2014).
Each risk factor, represented by the nodes, is composed of a finite number of mutually exclusive states (García-Herrero et al., 2013b). States are numbers of possible conditions that each risk factor may assume (Wang et al., 2011). Often these states are binary, mainly because the greater the number of states, greater the model complexity, as there is a need to specify each variable probability distribution for its n states (Hänninen et al., 2014). If there are latent variables that influence the risk, they cannot be measured directly; the structural equation modeling (SEM) is indicated to measure them indirectly (Chatterjee, 2014).
3.3.3. Model construction (MC)
Being defined risk factors (represented by the nodes) and the possible conditions each node can take, one can then establish a DAG that enhances the estimation of the quantitative parameters, and then, obtain the posterior probability distributions (Aguilera et al., 2011; Wang et al., 2011). The possibilities in the construction of DAGs are numerous, and many of these possibilities are equivalent, that is, the result at the same probability distributions, differing between them the complexity in the estimation of the quantitative parameters.
Thus, the choice order of the variables of DAG may effect the format of the network, and to avoid errors, which would make the network more complex, it is suggested that the choice is primarily based on risk factors that are possible to be the root nodes of the network (represented by trigger events), followed by the nodes that are independent, and the leaf node, characterized as the result (García-Herrero et al., 2012a).
In practical contexts, the structure of DAG or quantitative parameters of BN are unknown, making it necessary to identify them through learning methods. Artificial intelligence learning is the assimilation of the experience in the presence of uncertainty or variability, that is, the estimation of qualitative or quantitative parameters that can generate predisposition to updates, which may be applied by an expert, or in the case of very complex problems with automatic learning methods from the available data on the problem (Liao, 2012; Martins & Maturana, 2013).
Specialist learning can be directed to the structure and / or numerical parameters of the model. Structure learning is most often used in the literature with examples such as Wang et al. (2013), Leu & Chang (2013), Wang et al. (2011) and Chen & Pollino (2012), in these the expert evaluates and establishes relational structures among variables, while in the learning of the expert parameters, evaluates the conditional probabilities for each variable, one by one, directly or adjusted the results recorded by computational programs, pondering them (Hänninen et al., 2014).
In the case of learning by specialists, using methods by which it is possible to resolve subjectivity is indicated. In this perspective, the indication is the D-S Evidence Theory method, which is possible to associate evidence from different sources in order to reach a consensus that provides a strong measure of certainty. In order to identify the DAG that leverages the estimation of quantitative parameters of the model, a conditional independence test should be applied, and if the previously stipulated DAG is not the most efficient, the network structure will be modified to the extent that it uses mutual information between the nodes (Zhao et al., 2012).
On the other hand, if a node presents several parents, the construction of DAG, and hence, the posterior probability distribution becomes complex and imprecise. The decomposition method allows the simplification in the identification of conditional independence and compensate for the uncertainty, considering that the probability of each of the parent nodes happen to be calculated separately, these values are associated obtaining the conditional probability chart. The method of decomposition was used to resolve uncertainties and display the nodes that could be hidden in the network (Wang et al., 2011).
Other techniques can be used for visualization of hierarchies and interconnection of the variables. The model of human factors can be applied to identify hierarchies in the genesis of accidents (Akhtar & Utne, 2014; Wang et al., 2011); and also the Bow-Tie model is indicated for identification of hierarchies, mainly because it adds data on the impact of security and containment barriers to the accident (Khakzad et al., 2013a, b). However, the chosen automatic learning methods of quantitative parameters vary according to the knowledge obtained from the data, implying in knowing the initial event and its consequences, and discover the dependency relationship between the variables.
There are situations that the structure is known, but the data is incomplete; or the structure is unknown and the data is complete. When the variables are known it is said that the data is complete, otherwise the data are incomplete. Therefore, four cases of learning in BN are considered, for which different learning methods are proposed (García-Herrero et al., 2013a). There are specialized algorithms for this function, although these are rarely explained in scientific communications, given that in many cases the algorithm used is not known, as this is part of the statistical package commercial software.
The calculation of conditional probabilities is not simple; although, using software makes the modeling more accessible and viable. Two softwares have been used more, the Netica Bayesian Network (Norsys Software Corporation, 2007) and Hugin Researcher (Hugin Expert, 2014). However, in spite of having powerful computational tools, it is worth noting that even with the use of learning through computer algorithms, the human perception is essential for a successful application of the BN in the analysis of occupational risk (Chen et al., 2009; García-Herrero et al., 2012a; Khakzad et al., 2013b).
Once the network structure and the model parameters have been determined, conclusions can be drawn. It is possible to highlight some results obtained with the application of the BNs in the analysis of occupational risk, namely: (1) In the transport sector, the results indicated that human factors were, among the direct factors, the most responsible for accidents, and among the indirect factors, the major influence was related to road conditions (Zhao et al., 2012); (2) In a study applied in the sector of industry, services and civil construction, it was shown that accidents at work had a strong direct relationship with the global set of hygiene and ergonomic factors, indicating that poor working conditions have a significant effect on health and safety in companies (García-Herrero et al., 2012a); (3) Intending to infer about the risks of occupational exposure to polycyclic aromatic hydrocarbons in the industrial sector, it was identified that prolonged exposure results in 74.4% chance of exceeding the acceptable risk of exposure (Hsu et al., 2014).
3.3.4. Validation of the model (VM)
This step consists of checking the representativeness and robustness of the model, and the accuracy of the resulting inference. In the case of the resulting model passing by a validation to prove its reliability, the subjective inherent to the BNs building process reduces. If the resulting model is indicated as invalid, the data or the structure must be upgraded, so that it can be tested again (Aguilera et al., 2011; Akhtar & Utne, 2014).
There are several validation methods, either by analogy with other similar publications or the application of knowledge of experts. The use of cross-validation occurs in cases when the BNs have a variable target, from the sensitivity analysis to identify which variables have more power of influence on the risk. At this stage, we need reliable and reliable methods. However, in the case of validation by a belief of experts, there is subjectivity and, in addition, the size and composition of the group influence the results (Aguilera et al., 2011; Akhtar & Utne, 2014; Wang et al., 2011).
The sensitivity analysis is indicated in order to validate the theoretical construction of the model and when is intended to estimate the accuracy of the model, making it possible to determine the mutual relation between the variables. The sensitivity analysis refers to how sensitive a model is to changes in the input parameters, and can be performed by changing the values of the parameters and monitoring the effects of these changes on later probabilities (García-Herrero et al., 2012b; Ren et al., 2008; Wang et al., 2011).
For cross-validation, two data groups are required, one for the construction of the model and the other for validation (Akhtar & Utne, 2014). One option for application of sensitivity analysis by cross validation is the ROC (Receiver Operating Characteristic), which is a graphic criterion of performance (García-Herrero et al., 2012a, 2013a). The ROC curve suggests a prediction of reliability and error rate for the results obtained from the application of the BNs (García-Herrero et al., 2012a).
Some of the publications directed to the analysis of occupational risks that use the modeling of BNs do not highlight whether the model was validated or not. However, among the publications in which the model was validated, the technique usually adopted was the sensitivity analysis, considering that this type of validation may indicate the most prevalent risk factor, thus promoting decision making (Ren et al., 2008; Wang et al., 2011). From the foregoing, it is presented a conceptual framework, compiled in Figure 3, for inference of occupational risk having BNs a statistical tool.
Thus, for each phase, a methodological framework was constructed according to the IMP, OD, MC and VM. The interconnection between these phases results in a logical structure for evaluation of occupational risks through the BN.
Table 4. Learning method of the proposed data.
Structure of RB Complete Data Incomplete Data
Known Maximum likelihood estimation EM algorithm, Markov/Monte Carlo Chain (MCMC)
Figure 3. Model for analysis of occupational risks from BN.
Thus, for this research, the BNs are appropriate because they are able to generate predictions or decisions without any knowledge “a priori”. Accordingly, these networks, in conjunction with Bayesian techniques, facilitate the combination of knowledge and data, enabling the encoding of the length of causal relationship with the probabilities. Consequently, knowledge “a priori” and data are combined with Bayesian techniques and statistics.
4. Conclusion
Occupational risks are inherent elements in the systematics of work. Identifying and quantifying them provide information for a more effective action in an attempt to prevent accidents and / or minimize their effects. Regarding this, the probabilistic networks have come to be unique tools to determine the risk, the importance of which was due to the ability to provide data for monitoring, as new information is added or removed from its structure; and also for being able to incorporate various hypotheses. Thus, it is understood that one of the major benefits of the Bayesian approach is the ability to incorporate prior information in order to quantify uncertainties and verify the legitimacy of propositions.
Furthermore, the risk analysis through BNs becomes an important tool to analyze occupational risks because the risk is a data that changes depending on time (among other aspects), and this logic satisfies the modeling through BNs, as it simulates stochastic processes.
Finally, the construction of the Bayesian network model to analyze the occupational risks based on the proposal presented in Figure 3 may contribute to (1) model data, bridging the gap between different types of knowledge and unify all knowledge available in one type of representation; (2) Assimilate qualitative knowledge, in terms of accident factors through the structural connection of BN; (3) assimilate quantitative knowledge in terms of frequency of occurrence of the accident, using the parameters obtained by the BN, which will allow the extraction of recurring scenarios.
References
Abdat, F., Leclercq, S., Cuny, X., & Tissot, C. (2014). Extracting recurrent scenarios from narrative texts using a Bayesian network: application to serious occupational accidents with movement disturbance. Accident: Analysis and Prevention, 70, 155-166. PMid:24769246. http://dx.doi.org/10.1016/j.aap.2014.04.004.
Aguilera, P. A., Fernández, A., Fernández, R., Rumí, R., & Salmerón, A. (2011). Bayesian networks in environmental modelling. Environmental Modelling & Software, 26(12), 1376-1388. http://dx.doi.org/10.1016/j.envsoft.2011.06.004.
Akhtar, M. J., & Utne, I. B. (2014). Human fatigue’s effect on the risk of maritime groundings: a Bayesian Network modeling approach. Safety Science, 62, 427-440. http://dx.doi.org/10.1016/j.ssci.2013.10.002.
Aneziris, O. N., Papazoglou, I. A., & Doudakmani, O. (2010). Assessment of occupational risks in an aluminium processing industry. International Journal of Industrial Ergonomics, 40(3), 321-329. http://dx.doi.org/10.1016/j.ergon.2010.01.005.
Areosa, J. (2012). The importance of workers risk perceptions. International Journal on Working Conditions, 3, 54-64.
Arlinghaus, A., Lombardi, D. A., Willetts, J. L., Folkard, S., & Christiani, D. C. (2012). A structural equation modeling approach to fatigue-related risk factors for occupational injury. American Journal of Epidemiology, 176(7), 597-607. PMid:22956514. http:// dx.doi.org/10.1093/aje/kws219.
Ben-Gal, I., Shani, A., Gohr, A., Grau, J., Arviv, S., Shmilovici, A., Posch, S., & Grosse, I. (2005). Identification of transcription factor binding sites with variable-order Bayesian networks. Bioinformatics, 21(11), 2657-2666. PMid:15797905. http://dx.doi.org/10.1093/ bioinformatics/bti410.
Carvalho, J. V. F., & Chiann, C. (2013). Redes Bayesianas: um método para avaliação de interdependência e contágio em séries temporais multivariadas. Revista Brasileira de Economia, 67(2), 201-217. http://dx.doi.org/10.1590/S0034-71402013000200003.
Chatterjee, S. (2014). Development of uncertainty-based work injury model using Bayesian structural equation modelling. International Journal of Injury Control and Safety Promotion, 21(4), 318-327. PMid:24111548. http://dx.doi.org/10.1080/17457300.2013.825629. Chen, B., Wang, J., & Chen, S. (2009). Prediction of pulsed GTAW penetration status based on BP neural network and D-S evidence theory information fusion. International Journal of Advanced Manufacturing Technology, 48(1-4), 83-94. http://dx.doi.org/10.1007/ s00170-009-2258-6.
Chen, S. H., & Pollino, C. A. (2012). Good practice in Bayesian network modelling. Environmental Modelling & Software, 37(1), 134-145. http://dx.doi.org/10.1016/j.envsoft.2012.03.012.
Delcroix, V., Sedki, K., & Lepoutre, F. (2013). A Bayesian network for recurrent multi-criteria and multi-attribute decision problems: choosing a manual wheelchair. Expert Systems with Applications, 40(7), 2541-2551. http://dx.doi.org/10.1016/j.eswa.2012.10.065. Englehardt, J. D., An, H., Fleming, L. E., & Bean, J. A. (2003). Analytical predictive bayesian assessment of occupational injury risk:
municipal solid waste collectors. Risk Analysis, 23(5), 917-927. PMid:12969407. http://dx.doi.org/10.1111/1539-6924.00369. Friedman, N., Geiger, D., & Goldszmidt, M. (1997). Bayesian network classifiers. Machine Learning, 29(2-3), 131-163. http://dx.doi.
org/10.1023/A:1007465528199.
García-Herrero, S., Mariscal, M. A., Ritzel, D. O., & García-Rodríguez, J. (2012a). Working conditions, psychological/physical symptoms and occupational accidents: Bayesian network models. Safety Science, 50(9), 1760-1774. http://dx.doi.org/10.1016/j.ssci.2012.04.005. García-Herrero, S., Saldaña, M. Á. M., Rodriguez, J. G., & Ritzel, D. O. (2012b). Influence of task demands on occupational stress:
gender differences. Journal of Safety Research, 43(5-6), 365-374. PMid:23206509. http://dx.doi.org/10.1016/j.jsr.2012.10.005. García-Herrero, S., Mariscal, M. A., Gutiérrez, J. M., & Ritzel, D. O. (2013a). Using Bayesian networks to analyze occupational stress
caused by work demands: preventing stress through social support. Accident; Analysis and Prevention, 57, 114-123. PMid:23672926. http://dx.doi.org/10.1016/j.aap.X2013.04.009.
Griffiths, T. L., & Yuille, A. (2006). Technical Introduction: a primer on probabilistic inference. Trends in Cognitive Sciences, 10(7), 327-334. Guerrero-Barbosa, T. E., & Amarís-Castro, G. E. (2014). Application of Bayesian techniques for the identification of accident-prone
road sections. Dyna, 81(187), 209-214. http://dx.doi.org/10.15446/dyna.v81n187.41333.
Hamra, G. B., Loomis, D., & Dement, J. (2014). Examining the association of lung cancer and highly correlated fibre size-specific asbestos exposures with a hierarchical Bayesian model. Occupational and Environmental Medicine, 71(5), 353-357. PMid:24569623. http:// dx.doi.org/10.1136/oemed-2013-101965.
Hänninen, M., Valdez Banda, O. A., & Kujala, P. (2014). Bayesian network model of maritime safety management. Expert Systems with Applications, 41(17), 7837-7846. http://dx.doi.org/10.1016/j.eswa.2014.06.029.
Hsu, H.-I., Lin, M.-Y., Chen, Y.-C., Chen, W.-Y., Yoon, C., Chen, M.-R., & Tsai, P.-J. (2014). An integrated approach to assess exposure and health-risk from polycyclic aromatic hydrocarbons (PAHs) in a fastener manufacturing industry. International Journal of Environmental Research and Public Health, 11(9), 9578-9594. PMid:25226413. http://dx.doi.org/10.3390/ijerph110909578.
Hugin Expert. (2014). Hugin resercher. Denmark: Hugin Expert. Retrieved in 3 October 2016, from http://www.hugin.com Jordan, M. I. (1999). Learning in graphical models. Cambridge: MIT Press.
Khakzad, N., Khan, F., & Amyotte, P. (2013a). Dynamic safety analysis of process systems by mapping bow-tie into Bayesian network. Process Safety and Environmental Protection, 91(1-2), 46-53. http://dx.doi.org/10.1016/j.psep.2012.01.005.
Khakzad, N., Khan, F., & Amyotte, P. (2013b). Quantitative risk analysis of offshore drilling operations: A Bayesian approach. Safety Science, 57, 108-117. http://dx.doi.org/10.1016/j.ssci.2013.01.022.
Lee, E. G., Kim, S. W., Feigley, C. E., & Harper, M. (2013). Exposure models for the prior distribution in bayesian decision analysis for occupational hygiene decision making. Journal of Occupational and Environmental Hygiene, 10(2), 97-108. PMid:23252451. http:// dx.doi.org/10.1080/15459624.2012.748627.
Leitão, I., Fernandes, A. L., & Ramos, I. C. (2008). Saúde ocupacional: analisando os riscos relacionados à equipe. Ciência, Cuidado e Saúde, 7(4), 476-484.
Leu, S.-S., & Chang, C.-M. (2013). Bayesian-network-based safety risk assessment for steel construction projects. Accident: Analysis and Prevention, 54, 122-133. PMid:23499984. http://dx.doi.org/10.1016/j.aap.2013.02.019.
Liao, C.-W. (2012). Pattern analysis of seasonal variation in occupational accidents in the construction industry. Procedia Engineering, 29, 3240-3244. http://dx.doi.org/10.1016/j.proeng.2012.01.473.
Liberati, A., Altman, D. G., Tetzlaff, J., Mulrow, C., Gøtzsche, P. C., Ioannidis, J. P. A., Clarke, M., Devereaux, P. J., Kleijnen, J., & Moher, D. (2009). The PRISMA statement for reporting systematic reviews and meta-analyses of studies that evaluate healthcare interventions: explanation and elaboration. BMJ, 339(j1), b2700. PMid:19622552. http://dx.doi.org/10.1136/bmj.b2700.
Martín, J. E., Rivas, T., Matías, J. M., Taboada, J., & Argüelles, A. (2009). A Bayesian network analysis of workplace accidents caused by falls from a height. Safety Science, 47(2), 206-214. http://dx.doi.org/10.1016/j.ssci.2008.03.004.
Martins, M. R., & Maturana, M. C. (2013). Application of Bayesian Belief networks to the human reliability analysis of an oil tanker operation focusing on collision accidents. Reliability Engineering & System Safety, 110, 89-109. http://dx.doi.org/10.1016/j.ress.2012.09.008. Norsys Software Corporation. (2007). Netica 3.17 Bayesian Network Software from Norsys. Vancouver: Norsys Software Corporation.
Retrieved in 3 October 2016, from http://www.norsys.com
Pearl, J. (1988). Probabilistic reasoning in intelligent systems. San Francisco: Morgan Kaufmann.
Pearl, J., & Russel, S. (2001). Bayesian networks. In M. Arbib (Ed.), Handbook of brain theory and neural networks (2nd ed.). Cambridge, MIT Press. p. 157-160.
Puncher, M., Birchall, A., Bull, R. K. (2013). A Bayesian analysis of uncertainties on lung doses resulting from occupational exposures to uranium. Radiation Protection Dosimetry, 156(2), 131-140. PMid:23528329. http://dx.doi.org/10.1093/rpd/nct062.
Ren, J., Jenkinson, I., Wang, J., Xu, D. L., & Yang, J. B. (2008). A methodology to model causal relationships on offshore safety assessment focusing on human and organizational factors. Journal of Safety Research, 39(1), 87-100. PMid:18325420. http:// dx.doi.org/10.1016/j.jsr.2007.09.009.
Rivas, T., Paz, M., Martín, J. E., Matías, J. M., García, J. F., & Taboada, J. (2011). Explaining and predicting workplace accidents using data-mining techniques. Reliability Engineering & System Safety, 96(7), 739-747. http://dx.doi.org/10.1016/j.ress.2011.03.006. Schenekenberg, N. C. M., Malucelli, A., Dias, J. S., & Cubas, M. R. (2011). Redes bayesianas para eleição da ventilação mecânica no
pós-operatório de cirurgia cardíaca. Fisioterapia em Movimento, 24(3), 481-492. http://dx.doi.org/10.1590/S0103-51502011000300013. Taylor, J. A., Lacovara, A. V., Smith, G. S., Pandian, R., & Lehto, M. (2014). Near-miss narratives from the fire service: a Bayesian analysis.
Accident; Analysis and Prevention, 62, 119-129. PMid:24144497. http://dx.doi.org/10.1016/j.aap.2013.09.012.
Tighe, M., Pollino, C. A., & Wilson, S. C. (2013). Bayesian Networks as a screening tool for exposure assessment. Journal of Environmental Management, 123, 68-76. PMid:23583867. http://dx.doi.org/10.1016/j.jenvman.2013.03.018.
Valdés, R. M. A., Comendador, F. G., Gordún, L. M., & Sáez Nieto, F. J. (2011). The development of probabilistic models to estimate accident risk (due to runway overrun and landing undershoot) applicable to the design and construction of runway safety areas. Safety Science, 49(5), 633-650. http://dx.doi.org/10.1016/j.ssci.2010.09.020.
Wang, Y. F., Faghih Roohi, S., Hu, X. M., & Xie, M. (2011). Investigations of Human and Organizational Factors in hazardous vapor accidents. Journal of Hazardous Materials, 191(1-3), 69-82. PMid:21571433. http://dx.doi.org/10.1016/j.jhazmat.2011.04.040. Wang, Y. F., Xie, M., Chin, K.-S., & Fu, X. J. (2013). Accident analysis model based on Bayesian Network and Evidential Reasoning
approach. Journal of Loss Prevention in the Process Industries, 26(1), 10-21. http://dx.doi.org/10.1016/j.jlp.2012.08.001. Wang, Z., Hope, R. M., Wang, Z., Ji, Q., & Gray, W. D. (2012). Cross-subject workload classification with a hierarchical Bayes model.
NeuroImage, 59(1), 64-69. PMid:21867763. http://dx.doi.org/10.1016/j.neuroimage.2011.07.094.
Xing, L., Burstyn, I., Richardson, D. B., & Gustafson, P. (2013). A comparison of Bayesian hierarchical modeling with group-based exposure assessment in occupational epidemiology. Statistics in Medicine, 32(21), 3686-3699. PMid:23553785. http://dx.doi. org/10.1002/sim.5791.
Zhao, L., Wang, X., & Qian, Y. (2012). Analysis of factors that influence hazardous material transportation accidents based on Bayesian networks: a case study in China. Safety Science, 50(4), 1049-1055. http://dx.doi.org/10.1016/j.ssci.2011.12.003.