ISSN 0100-879X
BIOMEDICAL SCIENCES
AND
CLINICAL INVESTIGATION
www.bjournal.com.br
www.bjournal.com.br
Volume 44 (6) 497-605 June 2011
Braz J Med Biol Res, June 2011, Volume 44(6) 531-537
doi: 10.1590/S0100-879X2011007500060
An HPLC-UV method for the measurement of permeability of marker
drugs in the Caco-2 cell assay
J.M. Kratz, M.R. Teixeira, L.S. Koester and C.M.O. Simões
Faculdade de Medicina de Ribeirão Preto Campus
Ribeirão Preto
Institutional Sponsors
The Brazilian Journal of Medical and Biological Research is partially financed by
analiticaweb.com.br S C I E N T I F I C
An HPLC-UV method for the measurement
of permeability of marker drugs in the
Caco-2 cell assay
J.M. Kratz
1, M.R. Teixeira
1, L.S. Koester
2and C.M.O. Simões
11Departamento de Ciências Farmacêuticas, Universidade Federal de Santa Catarina,
Florianópolis, SC, Brasil
2Faculdade de Farmácia, Universidade Federal do Rio Grande do Sul, Porto Alegre, RS, Brasil
Abstract
The Caco-2 cell line has been used as a model to predict the in vitro permeability of the human intestinal barrier. The predic-tive potential of the assay relies on an appropriate in-house validation of the method. The objecpredic-tive of the present study was
to develop a single HPLC-UV method for the identification and quantitation of marker drugs and to determine the suitability of
the Caco-2 cell permeability assay. A simple chromatographic method was developed for the simultaneous determination of both passively (propranolol, carbamazepine, acyclovir, and hydrochlorothiazide) and actively transported drugs (vinblastine and
verapamil). Separation was achieved on a C18 column with step-gradient elution (acetonitrile and aqueous solution of ammo
-nium acetate, pH 3.0) at a flow rate of 1.0 mL/min and UV detection at 275 nm during the total run time of 35 min. The method was validated and found to be specific, linear, precise, and accurate. This chromatographic system can be readily used on a
routine basis and its utilization can be extended to other permeability models. The results obtained in the Caco-2 bi-directional
transport experiments confirmed the validity of the assay, given that high and low permeability profiles were identified, and
P-glycoprotein functionality was established.
Key words: Caco-2; HPLC-UV; Marker drugs; Permeability
Introduction
Correspondence: C.M.O. Simões, Laboratório de Virologia Aplicada, Departamento de Ciências Farmacêuticas, Universidade Federal de Santa Catarina, Campus Universitário Trindade, 88040-900 Florianópolis, SC, Brasil. Fax: +55-48-3721-9258. E-mail: [email protected]
Received December 2, 2010. Accepted April 19, 2011. Available online May 13, 2011. Published June 13, 2011.
Among the numerous techniques available for the pre -diction of intestinal permeability, the Caco-2 cell line has been extensively used and characterized as a model of the intestinal barrier (1,2). These human cells are able to fully polarize into differentiated monolayers with well-established tight junctions and brush border membrane as well as to express several membrane transporters and metabolizing enzymes, allowing the measurement of functional perme-ability (both passive diffusion and active transport) (3). Consequently, this assay is widely accepted by both the pharmaceutical industry and regulatory agencies since the permeability determined using Caco-2 cells correlates well with oral absorption in humans (4-6).
In 2000, the United States Food and Drug Administra-tion (FDA) published guidelines (7) based on the Biophar-maceutical Classification System (BCS) (8), whereby in vitro assays can be used to determine permeability class
during the request of biowaivers of in vivo bioavailability and/or bioequivalence studies in immediate-release solid oral dosage forms.
More recently, the International Transporter Consor-tium (ITC), a group of industrial, regulatory and academic scientists with expertise in drug metabolism, transport and pharmacokinetics, presented their recommendations regarding the design of in vitro membrane transporter as-says (9), particularly in relation to transporters involved in important clinical drug-drug interactions, highlighting the importance of these models in the early stages of the drug development process.
532 J.M. Kratz et al.
(10,11). The assay must be able to discriminate between high and low passive permeability profiles. Bi-directional transport experiments with P-glycoprotein (P-gp) substrates and inhibitors are regarded as the definitive assay for the identification of active transport (7,9). For the continuous assessment of the internal performance, marker drugs should be used during transport experiments (7,12).
The objective of the present study was to develop an HPLC-UV method using a single chromatographic step for the determination of six marker drugs, acyclovir, carba-mazepine, hydrochlorothiazide, propranolol, verapamil, and vinblastine, which were employed in the demonstration of the validity of the Caco-2 permeability assay.
Material and Methods
Chemicals and reagents
The physicochemical properties and permeation mecha-nism of all the marker drugs used in this study are pre-sented in Table 1. Acyclovir (ACV), carbamazepine (CBZ), hydrochlorothiazide (HTZ), and propranolol hydrochloride (PRO) reference standards (≥99%) were obtained from the National Institute of Health Quality Control (INCQS, Brazil). Verapamil hydrochloride (VER, ≥99%), vinblastine sulfate (VIN, ≥96%), Hank’s balanced salt solution (HBSS), sodium 4-(2-hydroxyethyl)-1-piperazineethanesulfonate (HEPES), methanesulfonic acid (MES), ethylenediaminetetraacetic acid (EDTA), trypsin, bovine serum albumin (BSA), dimethyl sulfoxide (DMSO), and Lucifer yellow (LY) were obtained from Sigma (USA). Acetonitrile and ammonium acetate (HPLC grade) were obtained from Tedia Co. (USA). Dulbec-co’s modified Eagle’s medium (DMEM) with high glucose, fetal bovine serum (FBS), nonessential amino acids, and antibiotics/antimycotics were purchased from Invitrogen, Ltd. (USA). All other chemicals and reagents used in this study were of the highest commercially available purity.
HPLC and chromatographic conditions
Quantitative determinations of all six marker drugs were performed on a Perkin Elmer Series 200 HPLC instrument (USA), which consisted of a quaternary pump, vacuum degasser, autosampler, and diode-array detec-tor (DAD). Separation was achieved on a C18 column (5 µm, 4.6 mm x 300 mm; Luna, Phenomenex, USA). A step-gradient elution was employed with acetonitrile as solvent A and an aqueous solution of ammonium acetate, pH 3.0 (25 mM), as solvent B, at a flow rate of 1.0 mL/ min. Elution started at 3:97 (A:B, v/v) isocratic for 8.0 min and the gradient was then increased to 80:20 (A:B, v/v) for 14 min, before being returned to the initial condition of 3:97 (A:B, v/v) for 8.0 min, followed by 5 min equilibration. Effluent absorbance was measured at 275 nm and 20-µL samples were injected into the column. UV spectra from 200 to 400 nm were recorded with the DAD online during the chromatographic run.
Validation of the chromatographic method
Method validation was performed based on both FDA and International Conference on Harmonization (ICH) guidelines for the validation of analytical methods (13,14). All samples used during validation were freshly prepared in HBSS buffer. Exploration and optimization of several chromatographic parameters, such as selectivity (α), tail -ing factor (Tf), number of theoretical plates (N) and peak
resolution was performed, and the chromatogram showing the optimized separation of all six marker drugs is presented in Figure 1. Specificity was assessed by injecting individual drugs and recording their retention times and UV spectra. Chromatograms were compared to those of blank samples. Linearity was established by the construction of individual seven-point calibration curves over a range of 0.5-100 µM. Precision was established by both intra-day and inter-day precision. The intra-day precision was assessed by nine determinations covering the specified range (3 concentra -tions/3 replicates each), while the inter-day precision was assessed on different days by nine determinations covering the specified range (3 concentrations/3 replicates each/3 days). The relative standard deviation (RSD) of each drug was calculated as a measure of precision. The accuracy of the method was established by nine determinations covering the specified range (3 concentrations/3 replicates each/3 days). The percent difference of the mean values from the nominal concentrations was the measure of accuracy. The low limit of quantification (LLOQ) was determined as the lowest concentration in the calibration curve with a precision of 20% and accuracy of 80-120%.
Cell culture
Caco-2 cells (HTB-37) were obtained from the American Type Culture Collection (ATCC, USA). Cells were main-tained in a humidified 5% CO2 air atmosphere at 37°C and
were cultured in DMEM (4.5 g/L glucose) with 20% FBS, 1% non-essential amino acids, 100 U/mL penicillin, 100 µg/mL streptomycin, and 25 µg/mL amphotericin B. After reaching 80-90% confluence, cells were harvested with 0.25% trypsin/ EDTA solution, and counted by the Trypan blue exclusion method on a Countess® automated cell counter (Invitrogen). Only cultures with ≥95% viability were used.
Transport studies
For the intestinal permeability experiments, Caco-2 cells between passages 25 and 31 were seeded on Millicell® polycarbonate inserts (0.6 cm2, 0.4 µm pore size; Millipore,
USA) at a density of 100,000 cells per insert and cultivated for 21-25 days. Culture medium was replaced three times per week until the time of use.
The transepithelial electrical resistance (TEER) of the monolayers and the permeability to the paracellular marker LY were considered to be indicators of monolayer integrity. TEER was assessed at 37°C using a Millicell® ERS meter
measurement chamber (USA) and reported as Ωcm2. The
perme-ability of the monolayers to LY (100 µg/mL) was assessed using a Tecan® Infinite 200 microplate
reader (Switzerland). Only mono-layers with TEER values above 200 Ωcm2 and LY permeability ≤0.2 x
10-6 cm/s were used.
The transport experiments were carried out according to the recommendations previously described (15). HBSS at pH 6.0 (10 mM MES) and pH 7.4 (10 mM HEPES) was used as trans-port buffer in the apical (AP) and basolateral (BL) compartments, respectively, in order to mimic in vivo conditions. Before the experi-ments, monolayers were washed twice with HBSS, pH 7.4, and incubated for 30 min at 37°C for TEER measurement. Next, DMSO stock solutions (1 mM) of all marker drugs were diluted in HBSS and added to the donor compartment, while fresh HBSS was added to the receiver compartment.
The permeability of passive diffusion markers was assessed on isolated drugs (PRO, CBZ,
ACV, and HTZ) or on a drug mixture (CBZ and HTZ). The P-gp functionality was evaluated with VIN alone (P-gp substrate) or in the presence of VER (P-gp inhibitor; 100 µM; both compartments). All experiments were performed in both directions, i.e., from AP to BL and from BL to AP, for the period of 2 h, at 37°C in an orbital shaker (100 rpm). At appropriate times, 100-µL aliquots were removed from the receiver compartment and replaced with an equal volume of fresh HBSS. At the end of the experiment, samples were collected from donor compartments in order to perform the mass balance calculation.
Transport experiments were conducted under sink con-ditions (where less than 10% of the drug was transported across the cell monolayer) and the apparent permeability coefficient (Papp) (cm/s) values were calculated as follows
(15):
0
( Q)
1
( t)
60
app
P
A C
∆
=
×
∆
×
×
Eq. 1where (ΔQ/Δt) is the steady-state flux (mol/s), A is the surface area of the filter (cm2) and C
0 is the initial
con-centration in the donor compartment (mol/mL) (16). For
rapidly transported drugs, where sink conditions could not be maintained for the full duration of the experiments, per-meability coefficient (Papp) values (cm/s) were calculated
as follows:
(1/ ) , 0
M
( )
PappA VD V tRR R
D R D R
M
C t
C
e
V
V
V
V
− +
=
+
−
+
+
Eq. 2
where CR(t) is the time-dependent drug concentration in
the receiver compartment, M is the amount of drug in the system, VD and VR are the volumes of the donor and re-ceiver compartments, respectively, and t is the time from the start of the interval. Papp values were obtained from
nonlinear regression minimizing the sum of squared residu -als (∑(CR,i,obs - CR,i,calc)2), where CR,i,obs is the observed
receiver concentration at the end of the interval and CR,i,calc
is the corresponding concentration calculated according to Equation 2 (16,17).
Statistical analysis
Data are reported as the mean ± SD of three indepen-dent experiments. For transport experiments, triplicate
Figure 1. Representative chromatogram of marker drugs (50 µM) in HBSS buffer. Marker drugs: acyclovir (ACV), hydrochlorothiazide (HTZ), propranolol (PRO), vinblastine (VIN), verapamil (VER), and carbamazepine (CBZ). Separation was achieved on a C18 column (5
µm, 4.6 mm x 300 mm) with step-gradient elution. Acetonitrile (A) and an aqueous solution of
ammonium acetate (B), pH 3.0 (25 mM) were used as mobile phase components. Flow rate
was 1.0 mL/min. Elution started at 3:97 (A:B, v/v) isocratic for 8.0 min followed by gradient to 80:20 (A:B, v/v) for 14 min and return to the initial condition of 8.0 min. Equilibration time of
534 J.M. Kratz et al.
inserts were used in each experiment repetition. Microsoft Excel 2007® (USA) was used for the linear and non-linear
regression analyses.
Results and Discussion
The Caco-2 cell model is the most frequently used method for in vitro gastrointestinal permeability assess-ment. The experience collected with this cell line over the last two decades has shown both successes and failures in its predictive capability (18). From this standpoint, the appropriate validation of the assay within research laboratories is mandatory for the suitable application of the assay to drug profiling projects in order to avoid the intrinsic variability of cell culture techniques. Therefore, the main purpose of the present study was to determine the suitability of a Caco-2 assay through the determina-tion of marker drugs.
Marker drug set assembly
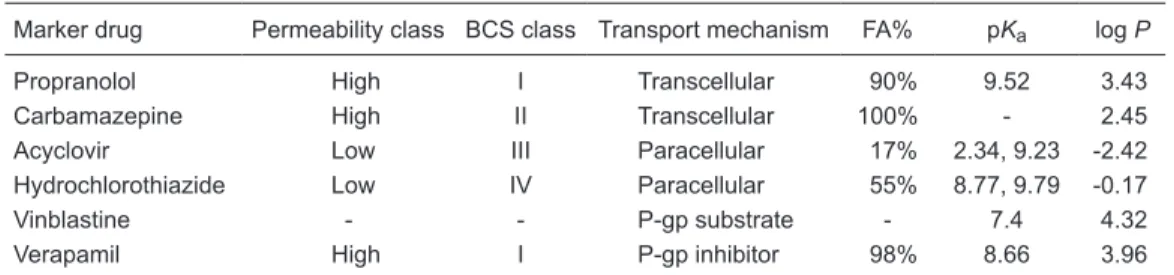
Six marker drugs with known fraction absorbed in humans
(FA%) and a broad range of physicochemical properties
were selected based on published data (Table 1) (17,19-23). Drugs were divided into two experimental groups: one for the determination of passive permeability, and the otherfor the demonstration of P-gp functionality. In agreement with FDA recommendations (7), these drugs encompass a wide range of FA% (17-100%) covering all four BCS classes. For the measurement of functional efflux mediated by P-gp, VIN and VER were selected as substrate and inhibitor, respectively, since both drugs have already been described as model drugs for cellular P-gp interaction studies (9).
HPLC
The optimum wavelength for the detection of all analytes with adequate sensitivity and specificity was found to be 275 nm. A fixed UV wavelength was used in order to allow equipment interchangeability, even though DAD was avail -able. The next step was the selection of the mobile phase components and composition. Acetonitrile (solvent A) and ammonium acetate (25 mM; solvent B) were selected for
the initial studies. In order to achieve a balance between adequate peak resolution and total run time, a gradient elution was programmed. Best peak shapes were obtained with pH 3.0 in the aqueous phase with a flow rate of 1.0 mL/min, since lower flows improved tailing, while a higher flow generated elevated backpressure.
ACV was initially challenging, since this analyte required a high aqueous content (3:97, v/v) for adequate peak shape and retention time. The remaining drugs were eluted by a gradual shift to a high organic content (80:20, v/v). With these conditions, only PRO and VIN presented low peak resolution (≤2.0). To improve this feature, a 300-mm C18 column was employed in place of the standard 150-mm column initially used. With these optimized chromatographic conditions, the average retention times were 8.88, 20.90, 23.95, 24.43, 26.22, and 26.58 min, for ACV, HTZ, PRO, VIN, VER, and CBZ, respectively (Figure 1).
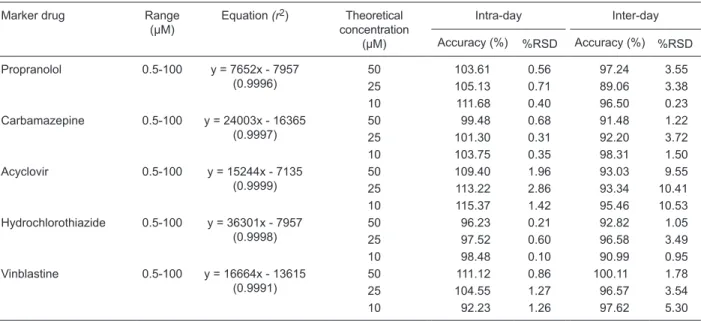
Table 2 summarizes linearity, range, precision, and accuracy data. VER was not included in Table 2 since it was used exclusively for inhibition of P-gp. Although a baseline alteration due to gradient shift was detected at about 10 min, no interference was observed in the retention time windows of each analyte, and specificity was confirmed by comparison of UV spectra to previ-ously published data (24). The LLOQs were determined as 0.5 µM for all drugs (lowest concentration in the calibration curve), since the RSDs at this concentration were ≤1.84%. The data in Table 2 show that the method presented here is appropriate for the determination of these markers (13,14).
This method can be readily employed for the suitability demonstration and in-house validation of Caco-2 perme-ability assays. In addition, the applicperme-ability of this method can be extended to other in vitro / in situ / ex vivo perme-ability assays. Although several studies have reported the simultaneous determination of permeability of marker drugs by HPLC (25-29), to our knowledge, this is the first report of an HPLC-UV method for the determination of the P-gp substrate VIN concomitantly with the corresponding inhibitor VER, and the four passive permeability markers used in this study.
Table 1. Physicochemical properties of marker drugs used in this study.
Marker drug Permeability class BCS class Transport mechanism FA% pKa log P
Propranolol High I Transcellular 90% 9.52 3.43 Carbamazepine High II Transcellular 100% - 2.45 Acyclovir Low III Paracellular 17% 2.34, 9.23 -2.42 Hydrochlorothiazide Low IV Paracellular 55% 8.77, 9.79 -0.17
Vinblastine - - P-gp substrate - 7.4 4.32
Verapamil High I P-gp inhibitor 98% 8.66 3.96
BCS = Biopharmaceutical Classification System (8); FA% = fraction absorbed in humans; log P = partition
Caco-2 permeability assay - suitability demonstration
The formation of a functional single monolayer on polycarbonate inserts is an important feature regarding the mimicking of in vivo conditions in the Caco-2 permeability assay. As small changes in the culture conditions can lead to significant differences in cell phenotype (10), the integrity of the monolayers and the formation of a robust tight junc-tion (TJ) network were monitored by TEER measurement and LY transport.
TEER profiles were obtained throughout the period of culture (21-25 days). Detectable values emerged from the 4th day of culture (values around 100 Ωcm2) and continued
to increase, until reaching a plateau on the 11th day of cul-ture. The average TEER value obtained before the transport experiments was 297 ± 21 Ωcm2. Additional information
regarding the integrity and tightness of monolayers was obtained by LY permeability assays. LY is a fluorescent paracellular marker with very low permeability and has been used as a marker of TJ maturation (30). The average LY Papp value obtained after 21 days of culture was ≤0.2 x
10-6 cm/s, in agreement with previously published data (31). For cut-off purposes, only monolayers with TEER values above 200 Ωcm2 and LY permeability ≤0.2 x 10⁻⁶ cm/s were
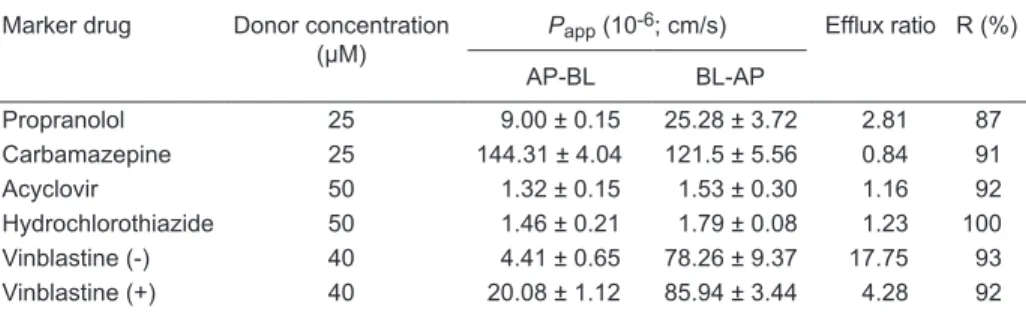
considered to be appropriate for the experiments. Through bi-directional transport experiments, Papp
val-ues were determined for each marker drug across Caco-2 cell monolayers and the summary of the permeability data is shown in Table 3. Four marker drugs were employed for passive permeability evaluation, i.e., PRO and CBZ as high permeability standards, along with ACV and HTZ as
low permeability standards. All drugs presented adequate Papp values, which correlated well with the FA% of these
drugs, allowing the establishment of a rank order relation-ship as intended.
Another important aspect considered was the efflux ratios (Papp BL-AP/Papp AP-BL) obtained. Passively
trans-ported drugs should produce efflux ratios close to 1.00 in order to demonstrate independence from active transport mechanisms (9). In the present study, only CBZ, ACV and HTZ presented proper values, while PRO showed an ef-flux ratio of 2.81, which could lead to a false interpretation toward an active transport pathway. However, since a pH gradient setup was employed in the transport experiments, and PRO is a basic drug with pKa around 9.5, data analysis
revealed that PRO permeability was pH-sensitive due to ionization effects, as already described (30).
Moreover, the permeability of CBZ and HTZ was as-sessed via a cocktail approach. The results obtained with this strategy were very similar, and maintained the rank order agreement. CBZ presented AP-BL and BL-AP Papp (cm/s)
values of 110.61 ± 3.41 and 116.6 ± 5.50, while HTZ pre-sented values of 1.81 ± 0.22 and 2.36 ± 0.34, respectively. Therefore, CBZ and HTZ were selected to be used as a single mixture control for the continuous evaluation of the internal performance of the Caco-2 permeability assay.
The permeability profile of VIN, a P-gp substrate, was also determined in order to demonstrate the suitability of the method regarding active transport mechanisms. Special attention was given to the selection of drug concentration in order to avoid transporter saturation (9,32). As shown
Table 2. Chromatographic validation data for the determination of marker drugs used in the Caco-2 permeability assay.
Marker drug Range
(µM)
Equation (r2) Theoretical
concentration (µM)
Intra-day Inter-day
Accuracy (%) %RSD Accuracy (%) %RSD
Propranolol 0.5-100 y = 7652x - 7957 (0.9996)
50 103.61 0.56 97.24 3.55
25 105.13 0.71 89.06 3.38
10 111.68 0.40 96.50 0.23
Carbamazepine 0.5-100 y = 24003x - 16365 (0.9997)
50 99.48 0.68 91.48 1.22
25 101.30 0.31 92.20 3.72
10 103.75 0.35 98.31 1.50
Acyclovir 0.5-100 y = 15244x - 7135 (0.9999)
50 109.40 1.96 93.03 9.55
25 113.22 2.86 93.34 10.41
10 115.37 1.42 95.46 10.53
Hydrochlorothiazide 0.5-100 y = 36301x - 7957 (0.9998)
50 96.23 0.21 92.82 1.05
25 97.52 0.60 96.58 3.49
10 98.48 0.10 90.99 0.95
Vinblastine 0.5-100 y = 16664x - 13615 (0.9991)
50 111.12 0.86 100.11 1.78
25 104.55 1.27 96.57 3.54
10 92.23 1.26 97.62 5.30
Intra-day and inter-day accuracy and precision were determined in triplicate for each concentration. Accuracy was defined as percent
536 J.M. Kratz et al.
in Table 3, an efflux ratio of 17.75 was obtained. An ac-ceptable system produces a minimum efflux ratio of 2.00 (9). Moreover, the perme-ability of VIN was evaluated in the presence of VER, a known P-gp inhibitor. In this setup, the Papp AP-BL value
obtained was 4.5-fold higher than that of VIN alone, and the efflux ratio observed was much lower (4.28). These findings agree with recom -mendations that the efflux ratio should be significantly reduced by the addition of a known inhibitor (more than
50%) (9,32), as observed in the present study, thereby corroborating the adequacy of the Caco-2 permeability assay in relation to P-gp functionality.
A simple, accurate and precise HPLC method using UV detection was developed and validated for the simultane-ous determination of marker drugs directly in the transport buffer. This method was successfully employed in the Caco-2 permeability assay during the in-house validation of the technique within our research laboratory, and can be readily employed on a routine basis with other permeability models. The results obtained in the present study confirmed the suitability of the Caco-2 permeability assay for the as-sessment of high and low permeability profiles, and for the
References
1. Balimane PV, Han YH, Chong S. Current industrial practices of assessing permeability and P-glycoprotein interaction.
AAPS J 2006; 8: E1-13.
2. Press B, Di Grandi D. Permeability for intestinal absorption: Caco-2 assay and related issues. Curr Drug Metab 2008; 9: 893-900.
3. Hidalgo IJ, Raub TJ, Borchardt RT. Characterization of the human colon carcinoma cell line (Caco-2) as a model system for intestinal epithelial permeability. Gastroenterology 1989; 96: 736-749.
4. Artursson P, Karlsson J. Correlation between oral drug absorption in humans and apparent drug permeability
coef-ficients in human intestinal epithelial (Caco-2) cells. Biochem Biophys Res Commun 1991; 175: 880-885.
5. Elsby R, Surry DD, Smith VN, Gray AJ. Validation and application of Caco-2 assays for the in vitro evaluation of development candidate drugs as substrates or inhibitors of P-glycoprotein to support regulatory submissions. Xenobi-otica 2008; 38: 1140-1164.
6. Matsson P, Bergstrom CA, Nagahara N, Tavelin S, Norinder U, Artursson P. Exploring the role of different drug transport routes in permeability screening. J Med Chem 2005; 48:
604-613.
7. FDA (Food and Drug Administration). Guidance for industry - Waiver of in vivo bioavailability and bioequivalence studies for immediate-release solid oral dosage forms based on a biopharmaceutics classification system. 2000.
8. Amidon GL, Lennernas H, Shah VP, Crison JR. A theoretical
basis for a biopharmaceutic drug classification: the correla -tion of in vitro drug product dissolution and in vivo bioavail-ability. Pharm Res 1995; 12: 413-420.
9. Giacomini KM, Huang SM, Tweedie DJ, Benet LZ, Brouwer KL, Chu X, et al. Membrane transporters in drug develop-ment. Nat Rev Drug Discov 2010; 9: 215-236.
10. Volpe DA. Variability in Caco-2 and MDCK cell-based intes-tinal permeability assays. J Pharm Sci 2008; 97: 712-725. 11. Corti G, Maestrelli F, Cirri M, Zerrouk N, Mura P.
Develop-ment and evaluation of an in vitro method for prediction of human drug absorption II. Demonstration of the method suitability. Eur J Pharm Sci 2006; 27: 354-362.
12. Polli JE, Yu LX, Cook JA, Amidon GL, Borchardt RT, Burn-side BA, et al. Summary workshop report: biopharmaceutics
classification system - implementation challenges and ex -tension opportunities. J Pharm Sci 2004; 93: 1375-1381.
establishment of P-gp functionality. To our knowledge, this is the first report of an HPLC-UV method developed for the determination of vinblastine concomitantly with verapamil, and four other passive permeability markers - propranolol, carbamazepine, acyclovir, and hydrochlorothiazide.
Acknowledgments
This article was dedicated to Universidade Federal de Santa Catarina on the occasion of the 50th year since the foundation of this institution. The authors are grateful to FAPESC (grant #5780/2007-0), CAPES/MEC, and CNPq/ MCT for financial support and research scholarships. Table 3.In vitro intestinal permeability data of the marker drugs across Caco-2 cell monolayers.
Marker drug Donor concentration (µM)
Papp (10-6; cm/s) Efflux ratio R (%)
AP-BL BL-AP
Propranolol 25 9.00 ± 0.15 25.28 ± 3.72 2.81 87 Carbamazepine 25 144.31 ± 4.04 121.5 ± 5.56 0.84 91 Acyclovir 50 1.32 ± 0.15 1.53 ± 0.30 1.16 92 Hydrochlorothiazide 50 1.46 ± 0.21 1.79 ± 0.08 1.23 100 Vinblastine (-) 40 4.41 ± 0.65 78.26 ± 9.37 17.75 93 Vinblastine (+) 40 20.08 ± 1.12 85.94 ± 3.44 4.28 92
Transport experiments were performed at an apical pH of 6.0 and a basolateral pH of 7.4.
Appar-ent permeability coefficiAppar-ents (Papp) were calculated according to equations 1 and 2 and data are
reported as means ± SD (N = 3). AP-BL = apical to basolateral direction; BL-AP = basolateral to
apical direction; efflux ratio = Papp BL-AP/Papp AP-BL; R = mass balance recuperation; (-) and (+)
13. FDA (Food and Drug Administration). Guidance for industry - Bioanalytical method validation. 2001.
14. ICH (International Conference on Harmonization). Validation of analytical procedures: text and methodology, Q2(R1). 2005.
15. Hubatsch I, Ragnarsson EG, Artursson P. Determination of drug permeability and prediction of drug absorption in Caco-2 monolayers. Nat Protoc 2007; 2: 2111-2119.
16. Grasjo J, Taipalensuu J, Ocklind G, Artursson P. Applications of epithelial cell culture in studies of drug transport. In: Wise C (Editor), Epithelial cell culture protocols. Totowa: Humana Press Inc.; 2002. p 233-272.
17. Bergstrom CA, Strafford M, Lazorova L, Avdeef A, Luthman
K, Artursson P. Absorption classification of oral drugs based
on molecular surface properties. J Med Chem 2003; 46: 558-570.
18. Ungell AL. Caco-2 replace or refine? Drug Discovery Today
2004; 1: 423-430.
19. Winiwarter S, Bonham NM, Ax F, Hallberg A, Lennernas H, Karlen A. Correlation of human jejunal permeability (in vivo) of drugs with experimentally and theoretically derived parameters. A multivariate data analysis approach. J Med Chem 1998; 41: 4939-4949.
20. Lee KJ, Johnson N, Castelo J, Sinko PJ, Grass G, Holme K, et al. Effect of experimental pH on the in vitro permeability in intact rabbit intestines and Caco-2 monolayer. Eur J Pharm Sci 2005; 25: 193-200.
21. Wu CY, Benet LZ. Predicting drug disposition via application
of BCS: transport/absorption/elimination interplay and devel
-opment of a biopharmaceutics drug disposition classification
system. Pharm Res 2005; 22: 11-23.
22. Skold C, Winiwarter S, Wernevik J, Bergstrom F, Engstrom L, Allen R, et al. Presentation of a structurally diverse and commercially available drug data set for correlation and benchmarking studies. J Med Chem 2006; 49: 6660-6671. 23. Ahlin G, Karlsson J, Pedersen JM, Gustavsson L, Larsson R,
Matsson P, et al. Structural requirements for drug inhibition of the liver specific human organic cation transport protein
1. J Med Chem 2008; 51: 5932-5942.
24. Moffat AC, Osselton MD, Widdop B (Editors). Clarke’s analysis
of drugs and poisons. Chicago: Pharmaceutical Press; 2003. 25. Bansal T, Singh M, Mishra G, Talegaonkar S, Khar RK, Jaggi
M, et al. Concurrent determination of topotecan and model permeability markers (atenolol, antipyrine, propranolol and
furosemide) by reversed phase liquid chromatography: util -ity in Caco-2 intestinal absorption studies. J Chromatogr B Analyt Technol Biomed Life Sci 2007; 859: 261-266. 26. Venkatesh G, Ramanathan S, Mansor SM, Nair NK, Sattar
MA, Croft SL, et al. Development and validation of RP-HPLC-UV method for simultaneous determination of
bupar-vaquone, atenolol, propranolol, quinidine and verapamil: a
tool for the standardization of rat in situ intestinal perme-ability studies. J Pharm Biomed Anal 2007; 43: 1546-1551. 27. Chawla S, Ghosh S, Sihorkar V, Nellore R, Kumar TR,
Srini-vas NR. High-performance liquid chromatography method
development and validation for simultaneous determination
of five model compounds, antipyrine, metoprolol, ketoprofen,
furosemide and phenol red, as a tool for the standardization of rat in situ intestinal permeability studies using timed wave-length detection. Biomed Chromatogr 2006; 20: 349-357. 28. Augustijns P, Mols R. HPLC with programmed wavelength
fluorescence detection for the simultaneous determination of
marker compounds of integrity and P-gp functionality in the Caco-2 intestinal absorption model. J Pharm Biomed Anal
2004; 34: 971-978.
29. Palmgren JJ, Monkkonen J, Jukkola E, Niva S, Auriola S. Characterization of Caco-2 cell monolayer drug transport
properties by cassette dosing using UV/fluorescence HPLC. Eur J Pharm Biopharm 2004; 57: 319-328.
30. Thiel-Demby VE, Humphreys JE, St John Williams LA, Ellens HM, Shah N, Ayrton AD, et al. Biopharmaceutics
classification system: validation and learnings of an in vitro
permeability assay. Mol Pharm 2009; 6: 11-18.
31. Uchida M, Fukazawa T, Yamazaki Y, Hashimoto H, Miyamoto
Y. A modified fast (4 day) 96-well plate Caco-2 permeability
assay. J Pharmacol Toxicol Methods 2009; 59: 39-43. 32. Shirasaka Y, Sakane T, Yamashita S. Effect of
P-glyco-protein expression levels on the concentration-dependent permeability of drugs to the cell membrane. J Pharm Sci