COMPONENTS OF THE LEAF AREA INDEX OF MARANDU
PALISADEGRASS SWARDS SUBJECTED TO
STRATEGIES OF INTERMITTENT STOCKING
Alessandra Aparecida Giacomini1; Sila Carneiro da Silva2*; Daniel Oliveira de Lucena Sarmento1; Cauê Varesqui Zeferino1; Júlio Kuhn da Trindade1; Salim Jacaúna Souza Júnior1; Vítor del’Alamo Guarda1; André Fischer Sbrissia3; Domicio do Nascimento Júnior4
1
USP/ESALQ - Programa de Pós-Graduação em Ciência Animal e Pastagens.
2
USP/ESALQ - Depto. de Zootecnia, C.P. 09 -13418-900 - Piracicaba, SP - Brasil.
3
UDESC - Depto. de Zootecnia, R. Luiz de Camões, 2090 - 88520-000 - Lages, SC - Brasil.
4
UFV - Depto. de Zootecnia - 36571-000 - Viçosa, MG - Brasil. *Corresponding author <[email protected]>
ABSTRACT: Leaf area index is the main sward characteristic related to the processes of light interception and competition in plant communities. The objective of this experiment was to quantify and evaluate the composition of the leaf area on tillers of marandu palisadegrass (Brachiaria brizantha cv. Marandu) subjected to strategies of intermittent stocking. The experiment was carried out in Piracicaba, state of São Paulo, Brazil, from October/2004 to December/2005. Swards were grazed at 95 and 100% canopy light interception (LI) to post-grazing heights of 10 and 15 cm, following a 2 u 2 factorial arrangement with four replications in a randomised complete block design. Estimates were made of sward leaf area index, site filling, specific leaf area and the dimensionless ratio between tiller leaf area and volume (R), as well as the relative contribution of basal and aerial tillers to these variables. In early spring, values of leaf area index and specific leaf area were low when compared to the other seasons, and swards grazed at 95% LI presented higher site filling and specific leaf area than those grazed at 100% LI. This resulted in higher tillering activity and increase in leaf area index in late spring, indicating quick recovery and early return of swards grazed at 95% LI to growing conditions. Aerial tillers corresponded to an important morphological adaptation of marandu palisadegrass to increase its competitive ability. Treatment 100/10 resulted in the highest and 95/15 in the lowest R values throughout the experiment, suggesting an allometric pattern of growth of tillers during regrowth in order to compensate low tiller population and optimise the leaf area index. Grazing management practices can benefit from this knowledge by promoting ideal sward conditions to maximise and accelerate growth.
Key words: Brachiaria brizantha, aerial tillers, basal tillers, site filling, sward height
COMPONENTES DO ÍNDICE DE ÁREA FOLIAR DE PASTOS DE
CAPIM-MARANDU SUBMETIDOS A ESTRATÉGIAS DE
LOTAÇÃO INTERMITENTE
RESUMO: O índice de área foliar é a principal característica do dossel relacionada com os processos de interceptação e competição por luz em comunidades de plantas. O objetivo deste experimento foi quantificar e avaliar a composição da área foliar dos perfilhos em pastos de capim-marandu (Brachiaria
brizantha cv. Marandu) submetidos a estratégias de lotação intermitente. O experimento foi conduzido
alométrico de crescimento dos perfilhos durante a rebrotação para compensar baixa densidade populacional e otimizar o índice de área foliar. Práticas de manejo do pastejo podem se beneficiar desse conhecimento propiciando condições ideais de dossel para maximização e aceleração do crescimento. Palavras-chave:Brachiaria brizantha, altura do dossel, perfilhos aéreos, perfilhos basais, site filling
down process (Trindade, 2007). The objective was to evaluate the effect of pre-grazing sward light intercep-tion (LI) and post-grazing height targets on leaf area formation (including the separate contribution of basal and aerial tillers) of intermittently stocked marandu palisadegrass swards.
MATERIAL AND METHODS
The experiment was carried out in Piracicaba, state of São Paulo, Brazil (22o42’ S, 47o37’ W and 550 m a.s.l.), on a Brachiaria brizantha cv. Marandu pasture (marandu palisadegrass) established in 2001 on an Eutric Kandiudalf. Average soil chemical characteristics (Raij et al., 1986) for the 0-20 cm layer were: pH CaCl2: 5.6; OM = 41 g dm–3; P (ion-exchange resin extraction method) = 67 mg dm–3; Ca = 74 mmolc dm–3; Mg = 19 mmolc dm–3
; K = 6.5 mmolcdm–3
; H + Al = 36 mmolc dm–3; sum of bases = 99 mmolc dm–3; cation exchange capacity = 134.8 mmolc dm–3; base saturation = 74%.
Marandu palisadegrass swards were grazed under continuous stocking from October 2001 until Febru-ary 2003 and then under intermittent stocking until Feb-ruary 2004, when staged to approximately 8 cm in preparation for the experiment. Treatments were the factorial arrangement of two pre-grazing LI (95 or 100%) and two post-grazing heights (10 or 15 cm). Experimental units were 1200 m2 paddocks organised in a randomised complete block design, with four rep-lications. Treatments were firstly assigned to experi-mental units in March 2004, and measurements started in October 2004 and were performed until December 2005. Paddocks were grazed by 2 year old Nelore (Bos indicus) and Canchim (Bossp.) heifers with an aver-age body weight of 350 kg and 4 to 6 year old cows with an average body weight of 540 kg using the mob grazing method described by Gildersleeve et al. (1987). The number of animals used for each grazing was di-mensioned in order to allow for a grazing period no longer than 12 h (grazing during day time only).
Paddocks were fertilised with N, K and S using a commercial formula 30-00-20 (N-P2O5-K2O), at a rate of 190 kg ha–1 of N, 38 kg ha–1 of S, and 105 kg ha–1 of K, applied in instalments after grazings. Amounts of N applied and their times of application throughout the experimental period were: 30 kg ha–1
between No-vember and December/2004; 30 kg ha–1 between Janu-ary and FebruJanu-ary/2005; 50 kg ha–1 in April/2005; 50 kg ha–1 between November and December/2005; 30 kg ha–1 in December/2005.
INTRODUCTION
Leaf area index (LAI), defined as leaf surface area per unit soil surface area (Watson, 1947), is the main factor influencing light interception and the dynamics of regrowth of swards subjected to intermittent stock-ing (Chapman & Lemaire, 1993). Further, LAI is con-sidered the principal sward structural component sen-sible to varying defoliation conditions and intensities (Lemaire & Chapman, 1996). It has high correlation with both plant and animal responses (Sbrissia & Da Silva, 2001), being, for that reason, essential for un-derstanding the herbage accumulation process and plan-ning grazing management practices (Da Silva & Nascimento Jr., 2007).
Adjustments and optimization of sward LAI are mainly a function of variations in tiller population den-sity (Matthew et al., 2001), which are controlled by the rate of leaf appearance, the determinant factor of the number of axilary buds on tillers (Nelson, 2000). Not every bud develops into a tiller, and the propor-tion that does is used to define the concept of site fill-ing (Davies, 1974).
Sward LAI is a result of plant morphogenetic re-sponses to the environment and management strate-gies (Lemaire & Chapman, 1996). These responses provide plants with plasticity and adaptive ability, which may be assessed by the R ratio (tiller leaf area3/2/tiller volume), defined by Sackville-Hamilton et al. (1995) to evaluate morphogenetic variations in tillers as they adjust to grazing management practices imposed and varying climatic conditions (Matthew et al., 1995).
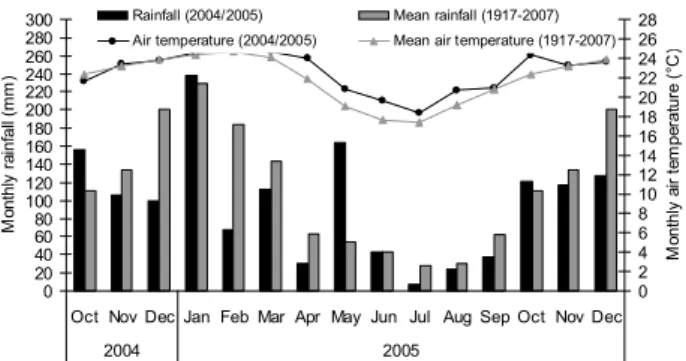
Mean air temperature indicated that autumn, win-ter and early spring were relatively warmer, and rain-fall data revealed that summer was drier and autumn was wetter than the 90-year average (Figure 1). There was soil water deficit (Thornthwaite & Mather, 1955) during late summer/early autumn and winter/early spring (Figure 2).
Monitoring of canopy light interception was per-formed using a canopy analyser LAI 2000 (LI-COR, Lincoln, Nebraska, USA) and readings were taken at post-grazing, after 5 cm increase in sward height from post-grazing height, and every two days after a read-ing of 90% until the pre-grazread-ing targets of 95 and 100% LI were reached. Measurements were con-ducted in ten sampling areas per experimental unit (rep-resentative of the average sward condition at the time of sampling – visual assessment of height and herb-age mass). In each paddock, five readings were taken at ground level and one reading above the canopy from each sampling area. Measurements of sward height were made at the same time measurements of LI were made using a ruler and an acetate sheet (Fagundes et al., 1999). A total of 20 readings were consistently taken along pre-defined trajectories in each paddock throughout the experimental period.
Measurements on individual tillers were made on 60 tillers harvested from each paddock on sites where sward height corresponded to the average condition for the paddock at the time of sampling. Samples were
collected in six locations per paddock with ten tillers being collected per point (including all attached daugh-ter tillers). These were cut with scissors close to the ground, identified, placed into plastic bags and taken immediately to the laboratory for measurements. Har-vests were performed at pre and post-grazing stages and every 5 cm increase in sward height from post-grazing height during regrowth. In this last case, af-ter the end of the experiment, because of the varying number of increments in sward height between treat-ments, data were used to calculate a value that would correspond to the mid point of each grazing interval (intermediary phase – condition where sward height was equal to the arithmetic mean between pre and post-grazing heights), from October 2004 to Novem-ber 2005.
Sixty tillers were randomly selected from tiller samples for further evaluation. After tillers had been separated into basal and aerial, the morphological com-ponents of tillers (leaf (leaf laminae), stem (stem + leaf sheath) and dead material) were hand dissected, weighed separately to determine their fresh weight, and leaf lamina measured using a leaf area integrator LI 3100 (LI-COR, Lincoln, Nebraska, USA) for determin-ing the mean leaf area per tiller. The volume of indi-vidual tiller components was then determined using equipment based on the communicant pipe principle (Sbrissia et al., 2004), and components placed into pa-per bags, dried in forced draught oven at 65o
C for 48 hours and weighed. Both the fresh and dry weight of leaves for individual tillers in each category (basal and aerial) were presented as arithmetic means. Sward leaf area index (LAI) was calculated using the equation LAI = TPD u LAT, where TPD is tiller population density (tillers m–2) (Giacomini, 2007) and LAT the mean leaf area per tiller (m2). The specific leaf area per tiller (cm2 g–1) was calculated as the ratio between leaf area and leaf dry mass per tiller. The leaf area:volume ratio per tiller (R) was calculated using the equation R = LAT3/ 2
/TV, where LAT is the mean leaf area per tiller (m2) and TV is the mean tiller volume (m3
), as described by Sackville-Hamilton et al. (1995). Site filling was cal-culated as the ratio between tiller appearance and leaf appearance rates (Davies & Thomas, 1983), using data from Giacomini (2007) and Zeferino (2006), respec-tively.
Because pre-grazing conditions were defined in terms of sward canopy light interception levels, graz-ing dates and rest periods for each paddock were vari-able and dependent on the prevailing environmental growth conditions. To establish a common basis for analysis, data were grouped into seasons of the year within which general behaviour was similar but rep-resented changes in patterns of plant responses
Figure 1 - Monthly and historical means of rainfall and air temperature from October 2004 to December 2005. 0
20 40 60 80 100 120 140 160 180 200 220 240 260 280 300
Oct Nov Dec Jan Feb Mar Apr May Jun Jul Aug Sep Oct Nov Dec
2004 2005
M
o
nt
hly
r
a
inf
all
(
m
m
)
0 2 4 6 8 10 12 14 16 18 20 22 24 26 28
M
o
nt
hly
a
ir
t
e
m
p
e
rat
ur
e (
°C
)
Rainfall (2004/2005) Mean rainfall (1917-2007) Air temperature (2004/2005) Mean air temperature (1917-2007)
Figure 2 - Monthly soil water balance (calculated considering a soil water storage capacity of 50 mm) from October 2004 to November 2005 (Arrows indicate time when nitrogen was applied on swards).
-60 -40 -20 0 20 40 60 80 100 120
Oct/04 Dec/04 Feb/05 Apr/05 Jun/05 Aug/05 Oct/05 Dec/05 Months of the year
mm
throughout the experimental period: early spring 2004 (October and November 2004); late spring 2004 (De-cember 2004); summer 2005 (January to March 2005); autumn/winter 2005 (April to September 2005); early spring 2005 (October and November 2005); and late spring 2005 (December 2005). Values for individual paddocks were weighted for the number of records within seasons. Data was analysed as repeated mea-sures using the Mixed Procedure (Littel et al., 1998) of SAS® (Statistical Analysis System). The choice of the covariance matrix was made using the Akaike In-formation Criterion (AIC) (Wolfinger, 1993). Pre-graz-ing light interception, post-grazPre-graz-ing height and season of the year were considered fixed effects and blocks and its interactions considered random effects. When appropriate, the reported means are least square means (“LSMEANS”), and the comparisons made with “PDIFF” based on a Student t test and a 10% signifi-cance level.
RESULTS
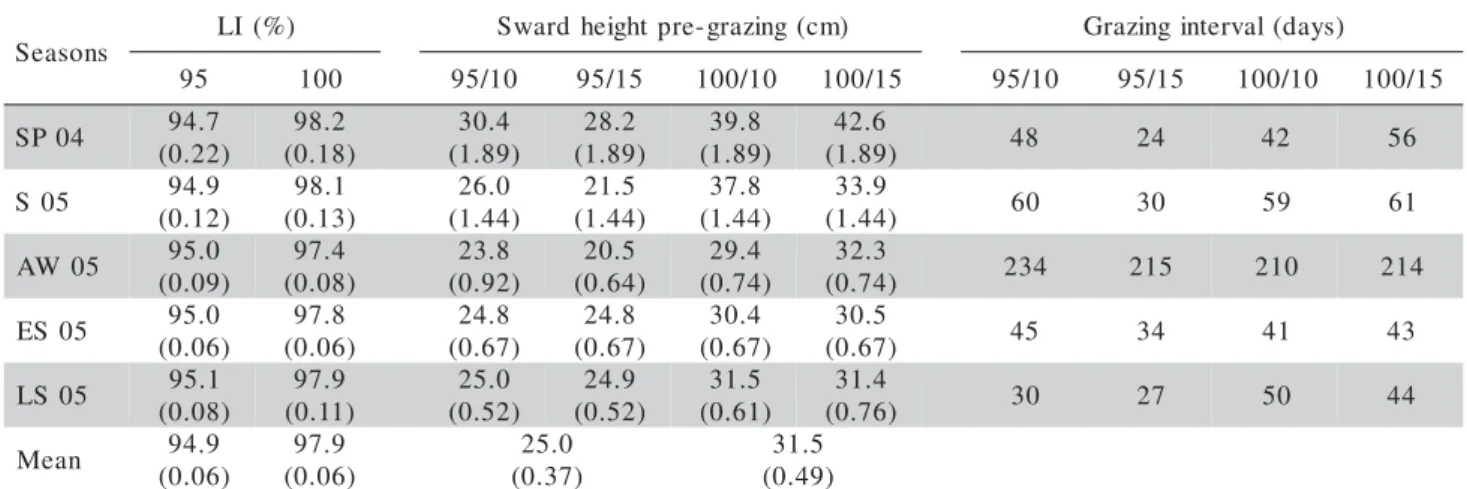
Nominal values for the 95% LI treatments remained close to target throughout the experimental period (Table 1). However, for the 100% LI treatments, val-ues varied between 97.4 to 98.2% depending on sea-son of the year.
Leaf area index of basal tillers (LAIb) varied with post-grazing height (p = 0.0045), season of the year (p = 0.0302) and the LI u season of the year interac-tion (p = 0.0195). Treatments with the target post-grazing height of 10 cm resulted in larger LAIb than those of 15 cm (5.6 and 4.6, respectively). In early spring 2004 and summer 2005 the 95% LI treatments resulted in smaller LAIb (4.1 and 4.0, respectively) than
the 100% LI treatments (5.5 and 5.0, respectively). Only in late spring 2004 the 95% LI treatments showed larger LAIb than the 100% LI treatments (6.1 and 4.7, respectively) (Figure 3a). The lowest value of LAIb was recorded during summer 2005. The 100% LI treatments showed highest value of LAIb in early spring 2005, and the 95% LI treatments in late spring 2004. However, the lowest values of LAIb for both 95 and 100% LI treatments were recorded in summer 2005 (Figure 3a). Leaf area index of aerial tillers (LAIa) varied only with LI u season of the year interaction (p = 0.0881). Swards grazed at 95% LI had larger LAIa in early spring 2004 and lower in late spring 2004 in relation to those grazed at 100% LI, with no differences between LI treatments during the remaining seasons of the year (Figure 3b).
s n o s a e S ) % ( I
L Swardheightpre-grazing(cm) Grazinginterval(days)
5
9 100 95/10 95/15 100/10 100/15 95/10 95/15 100/10 100/15
4 0 P
S 94.7
) 2 2 . 0 ( 2 . 8 9 ) 8 1 . 0 ( 4 . 0 3 ) 9 8 . 1 ( 2 . 8 2 ) 9 8 . 1 ( 8 . 9 3 ) 9 8 . 1 ( 6 . 2 4 ) 9 8 . 1
( 48 24 42 56
5 0
S 94.9
) 2 1 . 0 ( 1 . 8 9 ) 3 1 . 0 ( 0 . 6 2 ) 4 4 . 1 ( 5 . 1 2 ) 4 4 . 1 ( 8 . 7 3 ) 4 4 . 1 ( 9 . 3 3 ) 4 4 . 1
( 60 30 59 61
5 0 W
A 95.0
) 9 0 . 0 ( 4 . 7 9 ) 8 0 . 0 ( 8 . 3 2 ) 2 9 . 0 ( 5 . 0 2 ) 4 6 . 0 ( 4 . 9 2 ) 4 7 . 0 ( 3 . 2 3 ) 4 7 . 0
( 234 215 210 214
5 0 S
E 95.0
) 6 0 . 0 ( 8 . 7 9 ) 6 0 . 0 ( 8 . 4 2 ) 7 6 . 0 ( 8 . 4 2 ) 7 6 . 0 ( 4 . 0 3 ) 7 6 . 0 ( 5 . 0 3 ) 7 6 . 0
( 45 34 41 43
5 0 S
L 95.1
) 8 0 . 0 ( 9 . 7 9 ) 1 1 . 0 ( 0 . 5 2 ) 2 5 . 0 ( 9 . 4 2 ) 2 5 . 0 ( 5 . 1 3 ) 1 6 . 0 ( 4 . 1 3 ) 6 7 . 0
( 30 27 50 44
n a e
M 94.9
) 6 0 . 0 ( 9 . 7 9 ) 6 0 . 0 ( 0 . 5 2 ) 7 3 . 0 ( 5 . 1 3 ) 9 4 . 0 (
Table 1 - Canopy light interception and sward height pre-grazing and grazing intervals of marandu palisadegrass subjected to strategies of intermittent stocking from October 2004 to December 2005*.
SP = spring (October to December); ES = early spring (October and November); LS = late spring (December); S = summer (January to March) and AW = autumn/winter (April to September). Numbers in parentheses correspond to stardard error of the mean. *Adapted
from Souza Jr., 2007
Figure 3 - Leaf area index of basal (a) and aerial (b) tillers of marandu palisadegrass swards subjected to strategies of intermittent stocking from October 2004 to November 2005.
ES = early spring (October and November); LS = late spring (December); S = summer (January to March) and AW = autumn/ winter (April to September). Lower case letters compare seasons of the year means within LI levels. Upper case letters compare LI means within seasons of the year. Vertical bars correspond to standard error of the mean.
0 1 2 3 4 5 6 7 8 ES 2004 LS 2004 S 2005 AW 2005 ES 2005 ES 2004 LS 2004 S 2005 AW 2005 ES 2005 Seasons of the year
LA
I
95% LI 100% LI
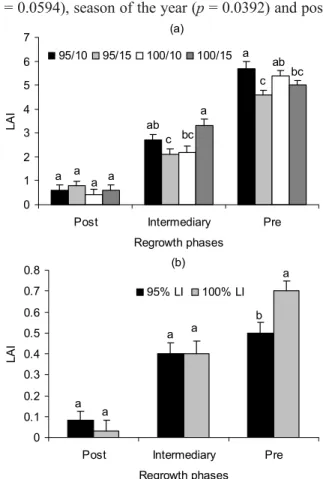
LAIb also varied with the regrowth phase (p < 0.0001) and was affected by the post-grazing height
u LI u regrowth phase interaction (p = 0.0298). On the other hand, LAIa varied with regrowth phase (p < 0.0001) and was affected by the LI u regrowth phase interaction (p = 0.0917). LAIb increased during re-growth (0.60, 2.60 and 5.20 for the post-grazing, in-termediary and pre-grazing phases, respectively, as did LAIa (0.05, 0.40 and 0.60 for the post-grazing, inter-mediary and pre-grazing phases, respectively). At post-grazing, there was no difference among treatments in relation to LAIb, but differences started to be detected from mid regrowth onwards, with larger LAIb recorded for treatments 100/15 and 95/10 at the intermediary and for treatments 95/10 and 100/10 at the pre-graz-ing phase. Treatment 95/15 resulted in the lowest LAIb at both intermediary and pre-grazing phases (Figure 4a). As for LAIa, there was no difference among treat-ments at both post-grazing and intermediary phases, and the 95% LI had a smaller LAIa than the 100% LI treatments only at the pre-grazing phase (Figure 4b).
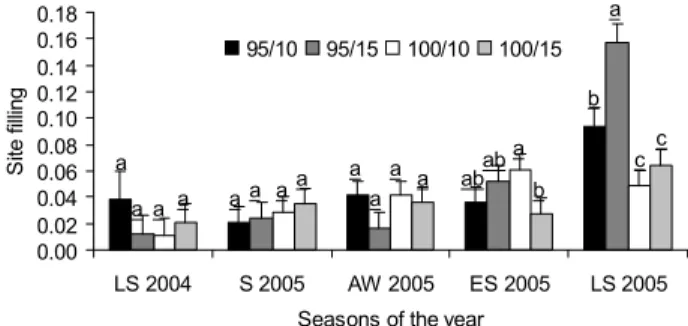
Site filling of basal tillers (SFb) was affected by LI (p = 0.0594), season of the year (p = 0.0392) and
post-grazing height u LI (p = 0.0624) and LI u season of the year (p = 0.0614) interactions. SBb was higher on swards managed at 95% LI than on those managed at 100% LI (0.185 and 0.152 tiller per leaf, respectively). The highest site filling value was recorded for treatment 95/10 (0.210 tiller per leaf), but did not vary among the remaining treatments (0.160; 0.145 and 0.159 tiller per leaf for treatments 95/15, 100/10 and 100/15, respec-tively). Swards managed at 95% LI showed higher SFb than those managed at 100% LI in late spring 2004 and early spring 2005 (Figure 5a). SFb values varied with season of the year and, for the 95% LI treatments, were higher in late spring 2004, decreased consistently to a minimum in autumn/winter 2005, and increased again from early spring 2005 returning to similar values of late spring 2004 in late spring 2005 (Figure 5a). For the 100% LI treatments, the highest values of SFb were recorded during summer and late spring 2005, and the lowest in early spring 2005 (Figure 5a).
Site filling of aerial tillers (SFa) was affected by LI (p = 0.0669), season of the year (p < 0.0001) and post-grazing height u season of the year (p = 0.0239), LI u season of the year (p = 0.0001) and post-grazing height
u LI u season of the year (p = 0.0319). SFa on swards managed at 95% LI was higher relative to other sea-sons of the year only in late spring 2005. On the other hand, SFa on swards managed at 100% LI increased consistently from late spring 2004, reaching the high-est value in late spring 2005 (Figure 5b). There was no SFa difference among treatments from late spring 2004 until autumn/winter 2005. In early spring 2005 treat-ments 100/10 and 100/15 presented the highest and the lowest values of SFa, respectively. In late spring 2005 treatment 95/15 had highest SFa, and treatments 100/ 10 and 100/15 the lowest (Figure 6).
0 1 2 3 4 5 6 7
Post Intermediary Pre
Regrowth phases
LA
I
95/10 95/15 100/10 100/15
(a)
a a
a a
ab c bc
a a
c ab
bc
0 0.1 0.2 0.3 0.4 0.5 0.6 0.7 0.8
Post Intermediary Pre
Regrowth phases
LA
I
95% LI 100% LI
(b)
a a
a a
a
b
Figure 4 - Leaf area index of basal (a) and aerial (b) tillers during regrowth of marandu palisadegrass swards subjected to strategies of intermittent stocking from October 2004 to November 2005.
Lower case letters compare treatments means within regrowth
phases. Vertical bars correspond to standard error of the mean. Figure 5 - Site filling of basal (a)* and aerial tillers (b) at
pre-grazing on marandu palisadegrass swards subjected to strategies of intermittent stocking from October 2004 to November 2005. * Analysis of variance carried out on transformed data (log10).
ES = early spring (October and November); LS = late spring (December); S = summer (January to March) and AW = autumn/ winter (April to September). Lower case letters compare seasons of the year means within LI levels. Upper case letters compare LI means within seasons of the year. Vertical bars correspond to standard error of the mean.
0.00 0.05 0.10 0.15 0.20 0.25 0.30
LS 2004
S 2005
AW 2005
ES 2005
LS 2005
LS 2004
S 2005
AW 2005
ES 2005
LS 2005 Seasons of the year
S
ite
fi
lli
n
g
95% LI 100% LI (b) aA
bcA
cA abA
aA
bA
bA bA bA
aA abB
aA abA
bB aA
cA
The specific leaf area of basal tillers (SLAb) var-ied with the season of the year (p < 0.0001) and LI u season of the year interaction (p = 0.0924). SLAb was higher on swards grazed at 95% than at 100% LI only in early spring 2005, and lower only in summer 2005. SLAb was low for the 95% LI treatments in early and late spring 2004, increased in summer 2005 and re-mained stable until early spring 2005. An increase in SLAb from early spring 2004 to summer 2005 was also recorded for the 100% LI treatments, but values decreased through autumn/winter until early spring 2005 (Figure 7a).
Specific leaf area of aerial tillers (SLAa) varied with post-grazing height (p = 0.0284), season of the year (p < 0.0001) and LI u season of the year (p = 0.0426) and post-grazing height u LI u season of the year (p = 0.0069) interactions. Treatments with post-grazing height of 15 cm resulted in higher SLAa than those with post-grazing height of 10 cm (136.7 and 108.7 cm2 g–1, respectively). SLAa was higher for the 95% than the 100% LI treatments in early spring 2004, the opposite happening in late spring 2004, and no differ-ences between treatments from summer 2005 onwards (Figure 7b).
R values for basal tillers (Rb) were influenced by post-grazing height (p = 0.1009), LI (p = 0.0024), sea-son of the year (p < 0.0001) and post-grazing height
u LI (p = 0.0312), LI u season of the year (p = 0.0005) and post-grazing height u LI u season of the year (p = 0.0006) interactions. Overall, swards man-aged at 100% LI had Rb larger than those manman-aged at 95% LI (200 and 149, respectively). The lowest value of Rb was recorded for treatment 95/15, with no dif-ference among the remaining treatments (153, 145, 226 and 173 for treatments 95/10, 95/15, 100/10 and 100/
15, respectively). Swards managed with the 100/10 treatment showed low Rb only in autumn/winter 2005, while those managed with treatment 95/15 showed high Rb only in late spring 2004. A low Rb was recorded for treatment 95/10 only in early spring 2004 and, for treatment 100/15, in late spring 2004 (Figure 8a).
R values for aerial tillers (Ra) were influenced by season of the year (p = 0.0122) and post-grazing height
u season of the year (p = 0.0011), LI u season of the year (p = 0.0742) and post-grazing height u LI u sea-son of the year (p = 0.0013) interactions. Ra was low in late spring 2004, and no difference was detected among the remaining seasons of the year. In early spring 2004 the highest Ra value was recorded for treatment 100/15 and in late spring 2004 for treatment 100/10. During summer 2005 the highest Ra value was recorded for treatment 95/10 (Figure 8b).
0.00 0.02 0.04 0.06 0.08 0.10 0.12 0.14 0.16 0.18
LS 2004 S 2005 AW 2005 ES 2005 LS 2005
Seasons of the year
S
ite
f
illing
95/10 95/15 100/10 100/15
a a a a a a
a a
aa a ab
aba
b b
a
c c a
Figure 6 - Site filling of aerial tillers at pre-grazing on marandu palisadegrass swards subjected to strategies of intermittent stocking from October 2004 to November 2005.
ES = early spring (October and November); LS = late spring (December); S = summer (January to March) and AW = autumn/ winter (April to September). Lower case letters compare treatment means within seasons of the year. Vertical bars correspond to standard error of the mean.
Figure 7 - Specific leaf area of basal (a) and aerial (b) tillers at pre-grazing on marandu palisadegrass swards subjected to strategies of intermittent stocking from October 2004 to November 2005.
ES = early spring (October and November); LS = late spring (December); S = summer (January to March) and AW = autumn/ winter (April to September). Lower case letters compare seasons of the year means within LI levels. Upper case letters compare LI means within seasons of the year. Vertical bars correspond to standard error of the mean
0 30 60 90 120 150 180 210 240
ES 2004
LS 2004
S 2005
AW 2005
ES 2005
ES 2004
LS 2004
S 2005
AW 2005
ES 2005 Seasons of the year
Spec
ifi
c
leaf
ar
ea (
c
m
2 g
–1
)
95% LI 100% LI (b)
bA bA aB
aA aA
bA
cB
aA aA aA
bcA cA aA
bA bcB
cB bA
aA aA
abA (a)
Figure 8 - Leaf area:volume ratio for basal (a)* and aerial (b) tillers on marandu palisadegrass swards subjected to strategies of intermittent stocking from October 2004 to November 2005. *Analysis of variance carried out on transformed data (1/x)
ES = early spring (October and November); LS = late spring (December); S = summer (January to March) and AW = autumn/ winter (April to September). Lower case letters compare treatment means within seasons of the year. Vertical bars correspond to standard error of the mean
0 100 200 300 400 500 600
ES 2004
LS 2004
S 2005 AW 2005
ES 2005
ES 2004
LS 2004
S 2005 AW 2005
ES 2005 Seasons of the year
R
95/10 95/15 100/10 100/15
(b)
c b
a
ab
a abab
b abbaa a
c baba aaa
bb c
a
cb a
bc a
bb b a
babb a a
DISCUSSION
The fact that swards managed at 95% had LAIb 25% lower in early spring 2004, 23% higher in late spring 2004 and 20% lower in summer 2005 in rela-tion to those managed at 100% LI (Figure 3a), prob-ably occurred because swards managed at 95% LI started to be grazed earlier and at a shorter grazing in-terval than those managed at 100% LI (Table 1). This contributed for the lower LAIb of swards grazed at 95% LI at the beginning of the growth season (spring). In early spring, water availability in the soil (Figure 2) was not sufficient to promote plant growth, causing defoli-ated swards to remain with low LAI for longer time.
In early spring 2004 LAIb of swards managed at 95% LI was low (Figure 3a), as was SLAb (Figure 7a) and tiller population density of basal tillers (TPDb) (Giacomini, 2007). That may have been the conse-quence of the transition between periods of very re-strictive conditions for plant growth during autumn/ winter and first showers, and temperature rise in spring, and there was still a high proportion of dead material on the swards (Sarmento, 2007). This low TPDb of swards managed at 95% LI in early spring 2004 may have been the result of the high senescence rates recorded at that time of the year and during the preceding season, winter (Zeferino, 2006), causing high accumulation of dead material on swards and low tillering.
In late spring 2004, when light availability, tempera-ture and rainfall had increased (Figure 1), 95% LI treat-ments had higher LAIb (Figure 3a), likely due to the high rate of leaf appearance (LAR) (Zeferino, 2006) and high SFb (Figure 5a), that contributed for the 17% increase in TPDb (Giacomini, 2007), higher propor-tion of leaf and lower proporpropor-tion of stem in the herb-age mass pre-grazing at that time of the year (Sarmento, 2007). This pattern of response is in accordance with the findings of Hume (1991), that increases in mean air temperature and light availability result in high LAR, SF and tillering, and also shows that the increase in TPD was an effective way to generate increases in sward LAI, as suggested by Lemaire (2001) and Mat-thew et al. (2001). These results indicate that the 95% LI treatments had an advantage over the 100% LI treatments in late spring, since they favoured tillering and the increase in LAI of swards, necessary condi-tions for regrowth and herbage accumulation.
In late spring 2004 tillers of swards managed at 95% LI were decapitated more frequently (shorter graz-ing intervals) than those of swards managed at 100% LI (Table 1), and aerial tillering initiated earlier under those circumstances (Giacomini, 2007), a condition that could have contributed to the decrease in LAIb
on swards grazed at 95% LI in summer 2005. Fur-ther, there was a high senescence rate in summer 2005 (Zeferino, 2006), which may have been the result of high turnover of tiller population caused by the more frequent defoliations on swards managed at 95% LI. This could have resulted in the decrease of SFb (similar to what happened on swards grazed at 100% LI), leaf proportion in the pre-grazing herbage mass (Sarmento, 2007), leaf appearance rate and final leaf length (Zeferino, 2006). However, in spite of the decrease in LAIb and SFb in summer 2005 on swards managed at 95% LI, there was an increase in TPDb (Giacomini, 2007). This pattern of response may be related to the high SFb and high TPDb established in late spring 2004, that generated an increase in competition for light in summer 2005, resulting in reduction of SFb. The increase in LAIa may have been important, since the proportion of leaf in the herbage mass pre-grazing was similar between LI treatments (Sarmento, 2007). Increases in SLA for both basal and aerial tillers sug-gest morphological adaptations on tillers that would al-low them to form leaf area more efficiently (Carvalho, 2002). Since high values of SLA are associated with the competitive ability of plants (Lambers & Poorter, 1992), it is possible that aerial tillers could correspond to an important morphological adaptation of the marandu palisagrass to increase its competitive ability and herbage accumulation rates when growth condi-tions are favourable (Figure 1) (Zeferino, 2006). The increase in SLA is useful because it means thinner leaves with higher photosynthetic rate per unit weight of leaves, suggesting more efficient leaves without the need of large investments in dry mass, particularly cell wall components (Lambers & Poorter, 1992).
In autumn/winter 2005 there was an increase in LAIb on swards managed at 95% LI in spite of the low values of SFb, a result likely due to the high sur-vival of basal tillers (Giacomini, 2007) as well as long leaf lifespan (Zeferino, 2006) and higher SLAb (Fig-ure 7a). As climatic conditions improved in early spring 2005, LAIb remained practically stable (Figure 3a) de-spite the increase in SFb (Figure 5a) and leaf appear-ance rate (Zeferino, 2006), expected responses given the low TPDb of swards (Giacomini, 2007). On the other hand, SLAb increased 12% (Figure 7a). Values of LAIb were high despite the high values of SLAa, similarly to what happened in summer 2005 (Figure 7b).
in-crease in SFb (Figure 5a) and SLAb (Figure 7a), which was larger than the corresponding increase on swards managed at 100% LI. The fact contributes to the hy-pothesis that early spring is a critical transition period between the dry and the rainy seasons during which swards are recovering and morphologically adapting to new fast growth conditions characterised by high temperature and rainfall.
There was no difference in LAIb and SFb between swards managed at 95% and 100% LI in early spring 2005 (Figures 3a and 5a), but SLAb was 17% higher on swards grazed at 95% than at 100% LI (Figure 7a). This was a way of allocating less photo assimilates to increase leaf area, an interesting response in a condi-tion where the grazing interval was 62% shorter when swards were grazed at 95% LI (Table 1). Swards man-aged at 95% LI, given their higher SFb and SLAb, were likely to start growing faster and receive animals for grazing earlier in spring than swards managed at 100% LI, since high SLA corresponds to a competitive ad-vantage to plants (Lambers & Poorter, 1992) and favours resistance to grazing (Briske, 1996) by increas-ing growth rates durincreas-ing regrowth (Westoby, 1984).
The LAIa did not vary with seasons of year for the 95% LI treatments (Figure 3b), even though a dif-ference of about 50% had been recorded between early and late spring 2004 and between late spring 2004 and summer 2005. Variations in LAIa tended to follow an opposite pattern of variation in relation to LAIb, sug-gesting some kind of complementary action since for increases in LAIb there were corresponding decreases in LAIa and vice-versa. For example, the highest value of LAIb (6.1) and the lowest value of LAIa (0.30) were recorded in late spring 2004. This pattern of variation was similar for the 100% LI treatments.
On swards managed at 100% LI LAIb sustained a 15% decrease from early to late spring 2004, remained stable in summer 2005, and increase during autumn/ winter until reaching a maximum value in early spring 2005 (Figure 3a). That was a similar pattern of varia-tion recorded for the 95% LI treatments, but with the difference that on swards managed at 100% LI, due to the longer grazing intervals (Table 1), grazings oc-curred later relative to those managed at 95% LI, and leaf appearance, leaf elongation and tillering also in-creased later. This represented just a delay in time for the occurrence of the same pattern of responses of plants to grazing, indicating the importance and potential for planning grazing management practices as a means of anticipate and augment plant growth early in the sea-son. In early spring 2004, because swards managed at 95% LI had shorter grazing intervals, they were the first to be grazed and had the herbage mass accumu-lated over the autumn/winter period removed in a time
of the year that there was still no adequate availability of climatic factors for plant growth, what caused LAIb to be smaller when compared to swards managed at 100% LI, which were grazed only in spring 2004. For that reason, due to the increase in air temperature and light in early spring 2004, the LAIb of swards man-aged at 100% LI was high (5.5) as was their TPDb (Giacomini, 2007), favouring a more intense competi-tion for light and causing a decrease in LAIb and SFb in late spring 2004. The decrease in LAIb in late spring 2004 was the main difference in relation to those swards managed at 95% LI, and may be explained by the lower SFb (Figure 5a) and lower leaf appearance rate (Zeferino, 2006), determinant factors of the lower TPDb at that time of the year.
From late spring 2004 to autumn/winter 2005 there was an increase in LAIb and a decrease in LAIa (Fig-ure 3). Similarly to what happened for the 95% LI treatments, aerial tillers increased their contribution to LAIt when there was a reduction in LAIb and vice-versa. This pattern of response was consistent be-tween tiller categories (basal and aerial), treatments and seasons of the year, suggesting the hypothesis that aerial tillers could play an important functional role in the marandu palisadegrass growth, acting in a comple-mentary manner to basal tillers. LAIb increased from late spring 2004 to summer 2005 (Figure 3a), coin-ciding with a 31% decrease in dead material in the herbage mass pre-grazing (Sarmento, 2007). This may have favoured more light to get to the base of swards and, therefore, an increase in SFb (Figure 5a) and in TPDb (Giacomini, 2007).
indi-cates the same process delayed in time, a delay caused by the effects of the evaluated grazing treatments. As swards managed at 95% LI were grazed earlier in the season (shorter grazing intervals) than swards man-aged at 100% LI, it may be assumed that there is a single, common pattern of plant development and leaf area formation whose expression throughout the year (timing and rate of processes) is altered by the fre-quency and intensity of grazing. Swards managed at 95% LI showed similar SLAb and SLAa in summer and autumn/winter 2005, suggesting that, with the re-duction in availability of climatic growth factors, leaves became thinner, with less investment in cell wall stituents, as a means of using and increasing the con-servation of nutrients, since their uptake from the soil could be jeopardised due to the low availability of wa-ter (Figure 2).
LAI seemed to be the key factor determining both tiller appearance and death (Sbrissia & Da Silva, 2001). The findings of this experiment corroborate to this assumption, since the increase in LAI on swards managed at 95% LI in late spring 2004 followed by a decrease in summer 2005 and a new increase from au-tumn/winter 2005 (Figure 3a) could be predicted from the balance between tiller appearance and death (Giacomini, 2007). This same pattern of variation and relationship between tiller appearance and death through-out the experimental period was also verified for the 100% LI treatments, including both categories of tillers. LAIb and LAIa increased consistently during re-growth (Figure 4), a pattern of response similar to that described by Carnevalli (2003) and Mello (2002) for mombaça and tanzania guineagrass (both cultivars of Panicum maximum), respectively, when subjected to strategies of intermittent stocking. At post-grazing, in spite of differences between treatments for the pro-portion of leaf in the herbage mass (Sarmento, 2007), there was no difference in LAIb (Figure 4a). The LAIb of swards managed with treatment 95/15 was low during the intermediary phase of regrowth, even though that was the treatment with the highest pro-portion of leaf in the herbage mass post-grazing (Sarmento, 2007). Leaves developed under low light conditions, at the bottom strata of swards, as was the case of leaves for the 15 cm post-grazing height, are less efficient photo-synthetically and have lower ca-pacity of readapting to high levels of light than leaves developed under full light conditions (Nabinger, 1997), and this may have interfered with the regrowth pro-cess of swards. Additionally, this was the treatment that resulted in the shortest grazing interval for the ex-periment and, as a result, the lowest LAI in each graz-ing cycle, but with highest number of grazgraz-ings durgraz-ing the experimental period (Souza Jr., 2007). The
remain-ing treatments resulted in lower proportion of leaf in the herbage mass post-grazing (Sarmento, 2007), but recovery of LAI during regrowth was efficient and even superior to that recorded for treatment 95/15. This indicates that the grazing treatments were not se-vere enough to compromise regrowth and LAI recov-ery of marandu palisadegrass swards, because plants likely made efficient use of organic reserves to pro-duce new photosynthetically efficient leaves. However, this assumption cannot be extrapolated, since symp-toms of organic reserve depletion can only be detected in longer duration trials. On the other hand, there was no indicative of any degree of sward degeneration, since tiller populations for the different treatments re-mained stable throughout the experimental period (Giacomini, 2007).
SFb and SFa was 22 and 25% higher on swards managed at 95 than at 100% LI, respectively, indicat-ing that higher grazindicat-ing frequency caused higher SF and also resulted in larger TPD (Giacomini, 2007). How-ever, there was no difference in TPDa between LI treatments, probably because of the short lifespan of aerial tillers (Giacomini, 2007). In early spring 2005 the highest value of SFa was observed for treatment 100/10, favoured by the longest grazing interval re-corded at that time of the year (41 days) (Souza Jr., 2007), but compensated by the largest herbage re-moval per grazing because of the low target of post-grazing height. In late spring 2005 the highest value of SFa was recorded for treatment 95/15, which had the shortest grazing interval (27 days) for all treat-ments. This may have promoted earlier decapitation of growing points of tillers and faster beginning of com-petition for light, contributing for a relative early start of aerial tillering under these circumstances.
varia-tions in air temperature and rainfall, as well as to the grazing treatments. This is another indication that marandu palisadegrass is very plastic and capable of adapting to a range of potentially stressing conditions. Treatment 100/10 resulted in the highest values of sward height pre-grazing throughout the experimental period, except in autumn/winter 2005 (Sarmento, 2007). At the same time, that was the treatment that resulted in the highest value of Rb (Figure 8a), a find-ing that is in agreement with those of Hernández-Garay et al. (1999) and Matthew et al. (1995) in which higher sward height was associated with high values of R. This means that the treatment 100/10 promoted a larger increase in leaf area relative to tiller volume as tillers increased in size during regrowth, indicating a larger elongation of leaves per unit of tiller volume. Such a pattern of response can be considered as a form of adaptation of the marandu palisadegrass when managed at 100% LI and a way to partially compen-sate the negative effects of longer grazing intervals with a low population of large tillers (Giacomini, 2007), and optimise sward LAI (Figure 3).
Treatment 95/15, that resulted in the lowest values of sward height pre-grazing throughout the experimen-tal period (Souza Jr., 2007) also resulted in the lowest values of Ra and Rb during most of the year (Figure 8a and 8b) as well as the lowest rates of stem elonga-tion (Zeferino, 2006). This happened because the graz-ing interval for treatment 95/15 was the shortest among all treatments, causing swards to be grazed ear-lier, tillering and new leaf elongation to start sooner, and growing points to be decapitated more often, re-sulting in higher tiller population of smaller tillers (Giacomini, 2007) and less investment in stems. The smaller leaf area per tiller was compensated by larger SF and TPD (Giacomini, 2007), optimising LAI (Fig-ure 3a) with no change in R. Low values of Ra were also recorded for aerial tillers throughout the experi-mental period on swards managed with the 95/15 treat-ment (Figure 8b), a fact that can be explained by the same reasons used for basal tillers, indicating similar-ity and consistency on how tillers from both catego-ries work.
In general, the lowest values of Rb were recorded in early spring 2004 and 2005, the transition between the cold/dry and the warm/wet periods of the year and critical in terms of grazing management, since misman-agement could compromise sward stability and pro-ductivity in succeeding seasons. The same pattern of response was described by Sbrissia (2004) in a study with marandu palisadegrass under continuous stock-ing, who stated that the low R value recorded in early spring could be an indicative of intra-specific varia-tions for R as a response to environmental
modifica-tions. For the marandu palisadegrass, tillers, in an at-tempt to reduce water loss, reduced leaf area relative to their volume, highlighting a very interesting plastic adaptive capacity in terms of perennation and survival strategy, increasing their resistance to temperature and water stress.
R values recorded in this experiment (145 to 226 for basal tillers and 89 to 120 for aerial tillers) were high when compared to those reported by Sbrissia (2004) for the same forage grass under continuous stocking (46 to 124). Similarly, Carvalho & Giacomini (2007) studied the effect of high and low frequency of defoliation on aruana guinegrass (Panicum maxi-mum Jacq. cv. Aruana), simulating continuous and in-termittent stocking, respectively. The authors reported R values varying from 20 to 37 for basal tillers and 29 to 47 for aerial tillers under simulated continuous stocking, higher values under simulated intermittent stocking, varying from 93 to 173 for basal tillers and 149 to 165 for aerial tillers. Under continuous stock-ing defoliation frequency is higher than under intermit-tent stocking, favouring a large tiller population and no need for a high leaf area/volume ratio per tiller, since adjustments in tiller population density are the most ef-fective way to optimise sward LAI (Matthew et al., 2001). On the other hand, under intermittent stock-ing, swards are allowed to grow without the presence of grazing animals and, for that reason, particularly if grazing interval is long as was the case for the 100% LI treatments in this experiment, competition for light sets in, tillering activity is reduced and tiller popula-tion density reduced. In this case, the most effective way to optimise sward LAI would be increasing tiller leaf area relative to its volume, a condition that is achieved by increases in R value.
R values recorded in this experiment are also larger than those reported by Matthew et al. (1995) for pe-rennial ryegrass (43 to 47) and by Sbrissia (2000) for Cynodon spp. (10 to 20). This suggests a relatively greater competitive ability of marandu palisadegrass, since a large R means higher investment on leaves, spe-cifically leaf area, determinant of plant photosynthesis and growth.
CONCLUSIONS
Marandu palisadegrass presents phenotypic plastic-ity since it was capable of adjusting its LAI through plastic responses involving adjustments in tiller popu-lation density, leaf area per tiller, specific leaf area and site filling to a range of grazing strategies represented by the treatments.
present an inverse, complementary behaviour in rela-tion to basal tillers in terms of contriburela-tion to sward leaf area, suggesting that this could be a possible strat-egy to optimise the use of the incident light and other growth factors in a fast and efficient way, particularly during periods in which air temperature and rainfall are favourable to plant growth.
Grazings at 95% LI promote better overall condi-tions for quick re-establishment of sward LAI in early spring than grazings at 100% LI, favouring competi-tive ability and herbage accumulation.
ACKNOWLEDGEMENTS
To CNPq and FAPESP for partial funding of this research.
REFERENCES
BRISKE, D.D. Strategies of plant survival in grazed systems: a functional interpretation. In: HODGSON, J.; ILLIUS, A.W. (Ed.)
The ecology and management of grazing systems. London: CAB International, 1996. p.37-67.
CARNEVALLI, R.A. Dinâmica da rebrotação de pastos de capim-mombaça submetidos a regimes de desfolhação intermitente. Piracicaba: USP/ESALQ, 2003. 136p. Tese (Doutorado). CARVALHO, D.D. Leaf morphogenesis and tillering behaviour in
single plants and simulated swards of Guinea grass (Panicum maximum Jacq.) cultivars. Palmerston North: Massey University, 2002. 186p. Tese (Doutorado).
CARVALHO, D.D; GIACOMINI, A.A. Morphogenetic characteristics of Panicum maximum cv. Aruana subjected to five defoliation stubble heights and two frequencies. In: INTERNATIONAL GRASSLAND CONGRESS, 20., Dublin, 2005. Proceedings. Wageningen: Academic, 2005. p.204. CARVALHO. D.D.; MATTHEW, C.; HODGSON, J. Leaf
morphogenesis and site filling in the establishment period in three Guinea grass (Panicum maximum) cultivars. Agronomy New Zealand Journal, v.29, p.107-114, 1999.
CASPER, B.B.; FORSETH, I.N.; KEMPENICH, H.; SELTZER, S.; XAVIER, K. Drought prolongs leaf life span in the herbaceous desert perennial Cryptantha flava.Functional Ecology, v.15, p.740-747, 2001.
CHAPMAN, D.F.; LEMAIRE, G. Morphogenetic and structural determinants of plant regrowth after defoliation. In: BAKER, M.J. (Ed.) Grasslands for our world. Wellington: SIR, 1993. p.55-64.
DA SILVA, S.C.; NASCIMENTO JR., D. Ecofisiologia da produção animal em pastagens e suas implicações sobre o desempenho e a produtividade de sistemas pastoris. In: SIMPÓSIO SOBRE MANEJO ESTRATÉGICO DA PASTAGEM, 4., Viçosa, 2007.
Anais. Viçosa: Ed. Suprema, 2007. p.1-48.
DAVIES, A. Leaf tissue remaining after cutting and regrowth in perennial ryegrass. Journal of Agricultural Science, v.82, p.165-172, 1974.
DAVIES, A.; THOMAS, H. Rates of leaf and tiller production in young spaced perennial ryegrass plants in relation to soil temperature and solar radiation. Annals of Botany, v.57, p.591-597, 1983.
FAGUNDES, J.L.; DA SILVA, S.C.; PEDREIRA, C.G.S; SBRISSIA, A.F.; CARNEVALLI, R.A.; CARVALHO, C.A.B.; PINTO, L.F.M. Índice de área foliar, interceptação luminosa e acúmulo de forragem em pastagens de cynodon spp. sob diferentes intensidades de pastejo. Scientia Agricola, v.56, p.1141-1150, 1999.
GIACOMINI, A.A. DemografIa do perfilhamento e produção de forragem em pastos de capim-marandu submetidos a regimes de lotação intermitente por bovinos de corte. Piracicaba: USP/ ESALQ, 2007. 175p. Tese (Doutorado).
GILDERSLEEVE, R.R.; OCUMPAUGH, W.R.; QUESENBERRY, K.H.; MOORE, J.E.; Mob-grazing morphologically different Aeschynomene
species.Tropical Grasslands, v.21, p.123-132, 1987.
HERNÁNDEZ-GARAY, A.H.; MATTHEW, C.; HODGSON, J. Tiller size/density compensation in perennial ryegrass miniature swards subject to differing defoliation heights and a proposed productivity index.Grass and Forage Science, v.54, p.347-356, 1999. HUME, D.E. Effect of cutting on production and tillering in Prairie
Grass (Bromus willdenowii Kunth) compared with two Ryegrass (Lolium) species. 1. Vegetative plants. Annals of Botany, v.67, p.533-541, 1991.
LAMBERS, H.; POORTER, H. Inherent variation in growth rate between higher plants: a search for physiological causes and ecological consequences. Advances in Ecological Research, v.23, p.187-361, 1992.
LEMAIRE, G. Understanding root and shoot development. In: INTERNATIONAL GRASSLAND CONGRESS, 19., Piracicaba, 2001. Proceedings. Piracicaba: FEALQ, 2001. p.29-37. LEMAIRE, G.; CHAPMAN, D. Tissue flows in grazed plant
communities. In: HODGSON, J.; ILLIUS, A.W. (Ed.) The
ecology and management of grazing systems. London:
CAB International, 1996. p.3-36.
LITTEL, R.C.; HENRY, P.R.; AMMERMAN, C.B. Statistical analysis of repeated measures data using SAS. Journal of Animal Science, v.76, p.1216-1231, 1998.
MATTHEW, C.; YANG, J.Z.; POTTER. J.F. Determination of tiller and root appearance in perennial ryegrass (Lolium perenne) swards by observation of the tiller axis, and potential application in mechanistic modeling. New Zealand Journal of Agricultural Research, v.41, p.1-10, 1998.
MATTHEW, C.; LOO, E.N. van; THOM, E.R.; DAWSON, L.A.; CARE, D.A. Understanding shoot and root development. In: INTERNATIONAL GRASSLAND CONGRESS, 19., Piracicaba, 2001. Proceedings.Piracicaba: FEALQ, 2001. p.19-27. MATTHEW, C.; LEMAIRE, G.; SACKVILLE HAMILTON, N.R.;
HERNANDEZ GARAY, A. A modified self-thinning equation to describe size/density relationships for defoliated swards. Annals of Botany, v.76, p.579-587, 1995.
MELLO, A.C.L. Respostas morfológicas do capim-tanzânia (Panicum maximum Jacq. cv. Tanzânia) irrigado à intensidade de desfolha sob lotação rotacionada. Piracicaba: USP/ESALQ, 2002. 67p. Dissertação (Mestrado).
NABINGER, C. Eficiência do uso de pastagens: disponibilidade e perdas de forragem. In: SIMPÓSIO SOBRE MANEJO DA PASTAGEM, 14., Piracicaba, 1997. Anais.Piracicaba: FEALQ, 1997. p.213-251.
NELSON, C.J. Shoot morphological plasticity of grasses: Leaf growth vs. tillering. In: LEMAIRE, G.; HODGSON, J.; MORAES, A.; CARVALHO, P.C.F.; NABINGER, C. (Ed.) Grassland ecophysiology and grazing ecology. Wallingford: CABI,, 2000. p.101-126.
NEUTEBOOM, J.H.; LANTINGA, E.A. Tillering potential and relashionship between leaf and tiller production in perennial ryegrass.Annals of Botany, v.63, p.265-270, 1989. RAIJ, B. van; QUAGGIO, J.A.; SILVA, N.M. Extraction of
phosphorus, potassium, calcium, and magnesium from soils by ion-exchange resin procedure. Communications in Soil Science and Plant Analysis, v.17, p.547-566, 1986. SACKVILLE-HAMILTON, N.R.; MATTHEW, C.; LEMAIRE, G. In
defence of the -3/2 boundary rule: a re-evaluation of self thinning concepts and status. Annals of Botany, v.76, p.569-577, 1995. SARMENTO, D.O.L. Produção, composição morfológica e valor
SBRISSIA, A.F. Compensação tamanho/densidade populacional de perfilhos em pastagens de Cynodon spp. Piracicaba: USP/ ESALQ, 2000. 80p. Dissertação (Mestrado).
SBRISSIA, A.F. Morfogênese, dinâmica do perfilhamento e do acúmulo de forragem em pastos de capim-marandu sob lotação contínua. Piracicaba: USP/ESALQ, 2004. 171p. Tese (Doutorado).
SBRISSIA, A.F.; DA SILVA, S.C. O ecossistema de pastagens e a produção animal. In: REUNIÃO ANUAL DA SOCIEDADE BRASILEIRA DE ZOOTECNIA, 38., Piracicaba, 2001. Anais. Piracicaba: SBZ, 2001. p.731-754.
SBRISSIA, A.F.; DA SILVA, S.C.; MOLAN, L.K.; SARMENTO, D.O.L.; ANDRADE, F.M.E.; LUPINACCI, A.V.; GONÇALVES, A.C. A simple method for measuring tiller volume of grasses.
Grass and Forage Science, v.59, p.406-410, 2004. SOUZA JR., S.J. Estrutura do dossel, interceptação de luz e acúmulo
de forragem em pastos de capim-marandu submetidos a estratégias de pastejo por bovinos de corte. Piracicaba: USP/ ESALQ, 2007. 122p. Dissertação (Mestrado).
THORNTHWAITE, C.W.; MATHER, J.R. The water balance.
Publications in Climatology, v.8, p.1-104, 1955.
Received January 18, 2008 Accepted May 18, 2009
TRINDADE, J.K.; DA SILVA, S.C.; SOUZA JR., S.J.; GIACOMINI, A.A.; ZEFERINO, C.V.; GUARDA, V.D.; CARVALHO, P.C.F. Composição morfológica da forragem de capim-marandu consumida por bovinos de corte em pastejo rotativo. Pesquisa Agropecuária Brasileira, v.42, p.883-890, 2007.
WATSON, D.J. Comparative physiological studies on the growth of field crops. I. Variation in net assimilation rate and leaf area between species and varieties, and within and between years.
Annals of Botany, v.11, p.41-76, 1947.
WESTOBY, M. The self-thinning rule. Advances in Ecological Research, v.14, p.41-76, 1984.
WOLFINGER, R.D. Covariance structure selection in general mixed models. Communications in Statistics Simulation and Computation, v.22, p.1079-1106, 1993.