ABSTRACT: ‘Bordô’ grapevines (Vitis labrusca) have great relevance to viticulture due to the quality they can impart to wines and juices. However, this cultivar has high variation in yield, ranging from 6 to 11 t ha–1. The use of clones with superior genetic potential related to scions
currently marketed may increase crop profitability and revitalize its cultivation. The aim of this study was to evaluate the agronomical responses of twelve clones of the Bordô cultivar selected over a period of 15 years according to yield and quality. The vineyard was planted in 2008. Grape plants were grafted onto '1103 Paulsen' rootstock and trained on vertical shoot positioning. The agronomical evaluations, performed in the 2011, 2012 and 2013 seasons, covered the duration of their phenological cycles, shoot growth, yield per plant, estimated total yield and physicochemical characteristics. Differences were found between clones in terms of phenology, yield components, and berry composition. Clone 6 had the lowest yield, averaging 5.0 t ha–1 whereas clone 13 was the most productive with 14.9 t ha–1. Based on the most
productive vineyards in the region (10.8 t ha–1), the adoption of more productive clones can
generate an increase in yield of around 38 %.
Keywords: Vitis labrusca, productivity, quality, composition, anthocyanins
Introduction
Amongst the American grapevines cultivated in Brazil, the Bordô cultivar (Vitis labrusca L, also known as Ives) distinguished by rusticity and intense coloration of the berries, can present constant yield loss and annual yield fluctuations due to the decrease in the fruit-set. Orlando et al. (2003) and Norberto et al. (2008) evaluated management techniques that increase vineyard yields. These authors observed that grafting was responsible for a marked increase in yield but the use of different rootstocks or canopy management had little effect on increasing yield, mainly due to poor fruit-set. In an or-ganic production trial under plastic cover in a subtropi-cal highland climate in the south of Brazil, Botelho et al. (2011) observed yields of 1.4 and 2.6 t ha–1 in Bordô vines grafted onto '1103 Paulsen' rootstock in the 2007/2008 and 2008/2009 seasons, respectively, with no difference in yield regardless of the rootstook.
Somatic variation in grapevines plays a major role as a source of phenotypic variation. This variation re-sults from genetic alterations, epigenetic differences or changes in pathogen content that can take place in a single cell, being spread to one apical meristem of a shoot and then to the whole plant by vegetative propa-gation. Somatic variants, usually observed in cultivars with a long history of cultivation or a large extension of growth, potentially represent a commercial interest if they improve an important agronomical trait or allow for product innovation (Torregrosa et al., 2011).
The phenotypic heterogeneity of the vineyards becomes a new source of variation for genetic improve-ment of grape cultivars through clonal selection. Such
selection may improve productivity as observed by
An-derson et al. (2008) with ‘Pinot noir’ vines in California.
Due to the national importance of common grapes and especially the ‘Bordô’ grapevine, in 1994 the Insti-tute of Agronomical Research of Minas Gerais, Brazil, (EPAMIG) initiated a program of clonal selection of ‘Bor-dô’, in order to identify healthy genetic material with high and constant productivity (Villa et al., 2010). The selection of clones that are more adapted and productive can result in an increase in profitability for the grapevine grower and dissemination of the cultivar. The objective of this study was to evaluate the yield and berry quality of clones of the ‘Bordô’ grapevine selected for cultiva-tion in subtropical viticultural zones.
Materials and Methods
The experiment was carried out during the 2011, 2012 and 2013 seasons in a 158 m2 plot set up in 2008 in Caldas, MG (22°55' S, 46°23' W and altitude of 1,150 m). The climate is of the Cwb type, warm, temperate and rainy, also known as subtropical climate of altitude with mean minimum temperatures of 12 oC and maxi-mum of 25 °C, and 1,500 mm of mean annual rainfall. Viticultural climatic indices for this region in January are as follows: Heliothermal index (HI) 2300; Cold night index (CI) 17 and Dryness index (DI) 170 (Tonietto et al., 2006). These indices classify the region at the ripening stage as a humid, warm with warm nights viticultural climate (Embrapa Uva e Vinho, 2013). Figure 1 presents the climate data during the experimental period.
The vegetative clonal material of the Bordô cul-tivar grapevine was selected from ungrafted vineyards over 20 years of age. At the first stage, 19 vegetative clon-al matericlon-als were selected based on the performance of the whole vine and a higher yield. These clones were subjected to sanitary evaluation by the ELISA test to 1Federal University of Lavras – Dept. of Agriculture, C.P.
3037 – 37200-000 – Lavras, MG – Brazil.
2Institute of Agronomical Research of Minas Gerais –
Tecnological Center of Grape and Wine Research, C.P. 33 – 37780–000 – Caldas, MG – Brazil.
*Corresponding author <rvmota@epamig.br>
Edited by: Lincoln Zotarelli
Agronomic evaluation of ‘Bordô’ grapevine (Ives) clones
Lidiane Carla Vilanova Miotto1, Renata Vieira da Mota2*, Claudia Rita de Souza2, Danilo Vieira Cardozo França2, Frederico Alcântara Novelli Dias1, Rodrigo Meirelles de Azevedo Pimentel2, Marite Carlin Dal’Osto2, Murillo de Albuquerque Regina2
detect the presence of six viruses (Grapevine virus A - GVA; Grapevine virus B - GVB; Grapevine leafroll virus - GFRV, Grapevine fanleaf virus - GFLV and Grapevine leafroll associated virus – GLRaV-1 and -3 (Villa et al., 2010). At this second stage, 12 superior and healthy clones were selected for agronomical evaluation in com-mercial management conditions adopted by viticultur-ists in this region. The stocks were produced by the table grafting technique using the ‘1103 Paulsen’ (Vitis ber-landieri × V. rupestris) as rootstock. The grapevines were trained in vertical shoot positions on a bilateral Royat Cordon, 1.0 m above ground with shoots positioned up-wards by three foliage wires.
Each experimental area consisted of six rows with 40 plants each, spaced at 2.5 m between rows and 1.0 m within rows. The design was completely randomized, consisting of twelve treatments with four replications of five plants for a total of 48 plots. Shoot growth length was obtained by weekly measurements of four shoots previously selected and identified per plot. The evalua-tions were made with a metric tape, from the beginning of shoot development until summer trimming.
Phenology was evaluated weekly and expressed in days after pruning (DAP) using the following grades: be-ginning of budburst, when at least two grapevine buds are in the second stage of initial development, which means the moment of scale rupture and appearance of
a wooly bud; end of budburst, when 50 % of the gems reach the second stage; flowering start, when anthesis has occurred in at least two grapevine flower buds from different inflorescences; flowering end, when anthesis has occurred in all flower buds, but two from different inflorescences; beginning of veraison, when at least two berries from different clusters have changed color, which means turning green to red; end of veraison; when at least two clusters had berries that were still green.
Mean cluster mass was determined by the pro-duction and number of clusters from the three central plants of each treatment replication. To evaluate the number of berries per cluster, berries were counted in 25 clusters for each of the four replications. Estimated yield of each treatment was determined by using mean plant production data multiplied by 4,000, which refers to the adopted plant density. The Ravaz index was cal-culated by dividing total yield per vine by the pruning weight recorded during the winter following the 2012 season. At harvest composite samples of 100 berries were collected from clusters in its upper, middle lower regions, external and internal side in each replication for the evaluation of must composition (pH, soluble sol-ids content, titratable acidity, and skin phenolic com-pounds content).
Total Soluble Solids were determined by a hand held digital refractometer and the results were expressed in °Brix. Titratable acidity was determined by titration with 0.1M NaOH, with 1 % phenolphthalein and the results were expressed in g L–1 tartaric acid. Skins were separated manually, dried, weighed and ground in liq-uid nitrogen. Total monomeric anthocyanins were deter-mined by the pH-differential method (Giusti and Wrol-stad, 2000) and total phenolics by the Folin-Ciocalteau method, using gallic acid for the calibration curve (Fal-cão et al., 2008). Data were submitted to ANOVA and means compared by the Tukey test (p < 0.05).
Results and Discussion
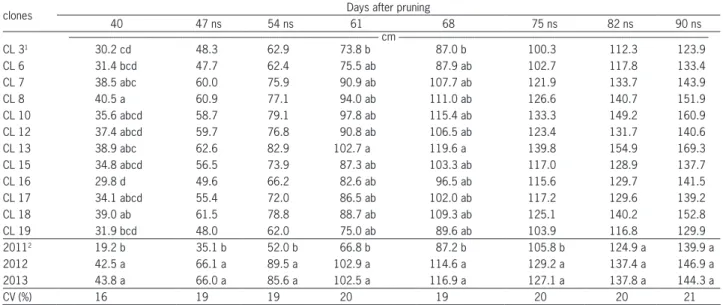
Clone growth vigor was estimated by evaluation of the shoot growth (Table 1). Data from the 2011 sea-son had the slowest shoot growth from 40 to 75 DAP probably because of the more juvenile stage of the vines (Bates et al., 2002). Clone 8 showed the highest shoot growth at 40 DAP which was overtaken by clone 13 in subsequent evaluations. After 75 DAP all clones had similar vigor. The mean values of shoot size from clones observed in the three harvest seasons at 75 (120.7 cm), 82 (133.4 cm) and 90 (143.7 cm) DAP were superior to the mean value of 114.5 cm at 97 DAP in 4 and 5 years old plants from the Bordô cultivar under different train-ing systems (Orlando et al., 2003) or of 120 cm at 84 DAP in vertical shoot position of the Bordô cultivar (Norberto et al., 2008).
The mean production cycle (from start of budburst to harvest) in the three harvest seasons was 142 days (Table 2), similar to the 149 days observed by Orlando Figure 1 – A) Monthly maximum and minimum temperatures and
Table 1 – Differences in shoot length of clones of the ‘Bordô’ grapevine in three harvest seasons (2011, 2012 and 2013) in Caldas, MG, Brazil.
clones Days after pruning
40 47 ns 54 ns 61 68 75 ns 82 ns 90 ns
cm
---CL 31 30.2 cd 48.3 62.9 73.8 b 87.0 b 100.3 112.3 123.9
CL 6 31.4 bcd 47.7 62.4 75.5 ab 87.9 ab 102.7 117.8 133.4
CL 7 38.5 abc 60.0 75.9 90.9 ab 107.7 ab 121.9 133.7 143.9
CL 8 40.5 a 60.9 77.1 94.0 ab 111.0 ab 126.6 140.7 151.9
CL 10 35.6 abcd 58.7 79.1 97.8 ab 115.4 ab 133.3 149.2 160.9
CL 12 37.4 abcd 59.7 76.8 90.8 ab 106.5 ab 123.4 131.7 140.6
CL 13 38.9 abc 62.6 82.9 102.7 a 119.6 a 139.8 154.9 169.3
CL 15 34.8 abcd 56.5 73.9 87.3 ab 103.3 ab 117.0 128.9 137.7
CL 16 29.8 d 49.6 66.2 82.6 ab 96.5 ab 115.6 129.7 141.5
CL 17 34.1 abcd 55.4 72.0 86.5 ab 102.0 ab 117.2 129.6 139.2
CL 18 39.0 ab 61.5 78.8 88.7 ab 109.3 ab 125.1 140.2 152.8
CL 19 31.9 bcd 48.0 62.0 75.0 ab 89.6 ab 103.9 116.8 129.9
20112 19.2 b 35.1 b 52.0 b 66.8 b 87.2 b 105.8 b 124.9 a 139.9 a
2012 42.5 a 66.1 a 89.5 a 102.9 a 114.6 a 129.2 a 137.4 a 146.9 a
2013 43.8 a 66.0 a 85.6 a 102.5 a 116.9 a 127.1 a 137.8 a 144.3 a
CV (%) 16 19 19 20 19 20 20 21
1Data within each column represent the shoot length means of the three harvest seasons per clone. Means followed by same letters within columns from clone 3 to
clone 19 are not different (Tukey test, p > 0.05); ns = non significant; 2Data within each column represent the shoot length means of all clones per season. Means
followed by same letters within columns among seasons are not different (Tukey test, p > 0.05).
Table 2 –Mean values in daysafter pruning (DAP) for the beginning (B) and end (E) of phenological stages of ‘Bordô’ grapevine clones in three harvest seasons (2011, 2012 and 2013) in Caldas, MG, Brazil.
Clone Budburst Flowering Veraison Cycle ns
B ns E ns B ns E B E
CL 31 14 17 46 52 ab 111 a 128 abc 141
CL 6 13 17 48 55 a 111 a 128 ab 142
CL 7 14 18 46 52 b 107 bc 126 bc 142
CL 8 13 17 45 50 b 105 c 125 c 142
CL 10 13 18 47 53 ab 110 ab 128 abc 142
CL 12 14 17 47 52 ab 111 ab 127 abc 141
CL 13 14 18 47 51 b 110 ab 126 abc 141
CL 15 14 18 47 52 b 110 ab 127 abc 141
CL 16 14 19 47 53 ab 111 ab 128 ab 141
CL 17 13 16 46 52 b 108 abc 127 abc 142
CL 18 14 17 46 52 ab 111 a 128 ab 141
CL 19 13 17 47 52 ab 111 a 129 a 142
20112 16 a 20 a 49 a 53 a 114 a 129 a 146 a
2012 13 b 17 b 47 b 52 ab 110 b 130 a 147 a
2013 11 c 16 b 43 c 51 b 105 c 123 b 132 b
CV (%) 10 13 5 5 2 2 1
1Data within each column represent the means of the three harvest seasons
per clone. Means followed by same letters within columns from clone 3 to clone 19 are not different (Tukey test, p > 0.05); ns = non significant; 2Data
within each column represent the means of all clones per season. Means followed by same letters within columns among seasons are not different (Tukey test, p > 0.05).
et al. (2003) and superior to the 128 days observed by Botelho et al. (2011). The highest temperatures and lowest rainfall observed in the 2013 growing season may have contributed to the reduction of the produc-tion cycle of the clones during this season (Smart and Robinson, 1991).
The phenological stages differed only at the end of flowering and veraison, when clone 8 displayed the shortest growth period and ripened, on average, 5 days earlier in comparison with later clones. Little difference in the duration of phenological phases was also observed for clones 169 and 685 of Cabernet Sauvignon grapes by Burin et al. (2011).
With the exception of clone 6, all clones had mean estimated productivity over 11 t ha–1 and a Ravaz Index over 6, which corresponds to balanced vines (Smart and Robinson, 1991). Clone 13 presented the highest mean yield among treatments, with cluster mass and number of berries per cluster of 112 % and 98 %, respectively, higher than clone 6 and 10 % and 11 %, respectively, higher than the mean of the other clones (Tables 3 and 4). Mean yield for clone 13 was 14.9 t ha–1 which was 28 % superior to the mean of 11.6 t ha–1 of the other clones and 49 % su-perior to the mean yield (9 to 10 t ha–1) observed by other authors (Norberto et al., 2008;Maia et al., 2013).
Production per plant and estimated production was lower for clone 6 mainly because of the differences observed in cluster mass and number of berries per ter, since there were no differences in number of clus-ters, berry size or mass, which points to a poor fruit-set for this clone (Table 3).
yield of 3.3 kg per plant of clone ‘Barberinha’ was sim-ilar to the mean values of the most productive clones selected in this study (Table 4), which corroborates the idea of increasing yield of ‘Bordô’ vineyards with clonal selection programs.
Yields of 7.0 and 5.1 t ha–1 of ‘Bordô’ grapes un-der the “pergola system” in the harvest seasons of 2002 and 2003, respectively, were reported by Orlando et al. (2003), which were close to the yield of 5.1 t ha–1
ob-tained by the least productive clone evaluated in this study. According to Orlando et al. (2003), the low pro-ductivities are related to the poor fruit-set observed in plants trained in the “pergola system”, which can pro-mote more vigor in the plants when compared to the vertical shoot position system.
One of the causes of poor fruit-set in grapevines is the excess of vigor (Dry et al., 2010). Under the condi-tions of this study, however, there was no direct relation-ship between vigor and fruit set (Table 5). Clones did not differ in shoot length in the three harvest seasons (Table 1), and the Ravaz Index showed that vines were balanced with the exception of clone 6 due to its having the lowest yield (Table 4).
Another factor that causes poor fruit-set is adverse weather conditions with low temperatures and high rain-fall during flowering (Jackson, 1991). Data on grape pro-duction of Ebadi et al. (1996) showed that temperature ef-fects are related to genotype. A temperature decline from 25°/20 °C (day/night) to 12°/9 °C (day/night) decreased fruit-set between 10 % and 6 % in Chardonnay and be-tween 14 % and 12 % in Syrah grapes. Low temperatures between 12 °C and 9 °C two days before flowering that persist for one week, also affect flower ovule develop-ment and give rise to abnormalities (Ebadi et al., 1995).
Rainfall may also lead to poor fruit-set by restrain-ing stamen liberation when the soaked cap is kept at-tached to the flower. These flowers are called encapsu-lated, since the stamens cannot disperse the pollen and pollination does not occur (Lebon et al., 2008). Climactic data observed during the period of this study (Figure 1) suggest that there may have been no influence from rainfall on the fruit-set. The 2011 harvest season pre-sented higher incidence of rainfall during flowering with no loss in the number of berries per cluster. However, temperature seems to be related to poor fruit-set. In the 2012 and 2013 harvest seasons, the temperature at the
Table 4 – Mean yield, estimated productivity and Ravaz index of grapevine ‘Bordô’ clones in the 2011, 2012 and 2013 harvest seasons in Caldas, MG1, Brazil.
Clones
Mean yield (kg per plant)
Mean estimated produc-tivity (t ha–1)
Ravaz Index2
(fruit yield pruning weight–1)
2011 2012 2013 2011/2012/2013 2011/2012/2013 2012
CL 3 3.40 a 2.70 ab 3.16 a 3.00 ab 12.3 ab 6.5 ab
CL 6 1.08 b 1.62 b 1.10 b 1.39 c 5.1 c 3.9 b
CL 7 2.60 ab 3.24 ab 2.59 a 2.73 b 11.2 b 6.3 ab
CL 8 2.89 ab 3.24 ab 2.62 a 2.94 ab 11.7 ab 7.0 ab
CL 10 2.97 ab 2.59 ab 3.02 a 2.94 ab 12.1 ab 7.7 ab
CL 12 2.43 ab 3.77 a 3.19 a 3.22 ab 12.5 ab 8.6 a
CL 13 4.13 a 3.49 a 3.48 a 3.55 a 14.9 a 7.5 ab
CL 15 3.70 a 2.98 ab 3.11 a 3.16 ab 13.1 ab 7.6 ab
CL 16 3.77 a 3.23 ab 3.17 a 3.24 ab 13.6 ab 7.5 ab
CL 17 3.07 ab 2.85 ab 2.73 a 2.85 ab 11.5 ab 6.0 ab
CL 18 3.22 a 3.11 ab 3.03 a 3.01 ab 12.5 ab 8.3 a
CL 19 3.19 a 2.87 ab 2.85 a 2.86 ab 11.9 ab 7.7 ab
CV (%) 27.2 22.2 16.5 19.8 22.3 24.1
1Means followed by same letters within columns are not different (Tukey test, p > 0.05); 2Measured in the 2011/2012 growing season. Table 3 – Physical characterization of clusters from ‘Bordô’ grapevine
clones in three harvest seasons (2011, 2012 and 2013) in Caldas, MG, Brazil.
Clones N° clusters per plant Cluster mass Nº berries cluster–1 Berries size
Berries mass
g mm g
CL 31 37.2 ab 81.7 abc 46.3 ab 14.6 abc 2.43 ab
CL 6 34.0 ab 42.2 d 24.9 c 14.9 a 2.42 abc
CL 7 33.4 b 85.2 ab 43.5 ab 14.2 bcd 2.38 abc
CL 8 36.5 ab 85.6 ab 48.7 a 14.0 cd 2.28 bc
CL 10 38.2 ab 81.4 abc 42.8 ab 14.6 abc 2.51 a CL 12 39.8 ab 85.6 ab 44.3 ab 14.6 abc 2.46 ab
CL 13 41.7 a 89.4 a 49.4 a 14.5 abcd 2.37 abc
CL 15 38.8 ab 83.5 abc 44.7 ab 14.5 abcd 2.48 a CL 16 40.8 ab 83.1 abc 48.5 a 14.4 abcd 2.42 abc
CL 17 41.6 a 71.4 c 39.7 b 13.9 d 2.23 c
CL 18 39.0 ab 80.8 abc 43.9 ab 14.6 abc 2.45 ab CL 19 38.9 ab 76.1 bc 41.5 ab 14.7 ab 2.47 ab
20112 28.3 c 104.0 a 48.2 a 13.8 c 2.47 a
2012 41.9 b 69.9 b 48.1 a 14.6 b 2.37 b
2013 44.8 a 62.6 c 33.3 b 15.0 a 2.38 b
CV (%) 15.4 11.9 13.9 3.1 5.8
1Data within each column represent the means of the three harvest seasons
per clone. Means followed by same letters within columns from clone 3 to clone 19 are not different (Tukey test, p > 0.05); 2Data within each column
beginning of flowering was below 12 °C, which resulted in a decrease in the number of berries per cluster (Figure 1B, Table 3). Despite the weather conditions, clone 13 showed superior results in the three seasons evaluated.
Total soluble solids content ranged from 15.6 to 17.0 °Brix considering all the harvest seasons (Table 6). These values are in accordance with the 15.3 °Brix found by Orlando et al. (2003), higher than the 13.8 and 14.4°Brix observed by Botelho et al. (2011) but lower than the 19.0° Brix observed at Bswh climate regions by Leão et al. (2010). Clone 8 distinguished itself by presenting the highest values for total soluble solids. The longer period at the ripening stage (in average five days longer than other clones) may explain its higher TSS content at harvest. Burin et al. (2011) also observed slight increases in °Brix values of clone 169 of Cabernet Sauvignon grapes which showed higher veraison in the harvest cycle. There was no correlation between yield and TSS (Table 5). The mean value of must acidity on average, 5.16 g L–1 tartaric acid for all clones and pH 3.3 differed from that observed by Orlando et al (2003) who found must acidity of 6.18 g L–1 and pH 3.15.
With regard to the anthocyanins, values obtained in this study from the ‘Bordô’ clones varied between 113 and 166 mg 100 g–1 and were similar to the findings of Yang et al. (2009) for the ‘Concord’ grapes, 80.6 mg cy-anidin 3-glucoside 100 g–1. The lower number of berries observed in the clusters of clone 6 could be associated with the elevation of total anthocyanin content of 1,657 mg 1,000 g–1 of berries and total phenolic compounds of 2,181 mg 1,000 g–1 of berries found in the grape skin (Table 7) although correlation data between yield and an-thocyanin content showed a weak negative correlation of 10 % (Table 5).
Grapes from ‘Bordô’ clones possess typical culti-var coloration. The higher yield did not affect negatively Table 5 – Pearson correlation coefficient (r)1 between vigor, yield, total soluble solids (TSS) or anthocyanins with observed traits in three seasons for clones of the Bordô cultivar in Caldas, MG, Brazil.
Trait Vigor Yield TSS Anthocyanins
shoot length at
93 DAP g per plant °Brix mg 1000 g
–1
Yield (kg per plant) 0.095 0.06 -0.31
N clusters per plant 0.079 0.43 0.14 0.28
Cluster mass (g) 0.026 0.52 -0.06 -0.54
N berries cluster–1 0.053 0.51 0.26 -0.32
Berries size (mm) 0.053 -0.22 -0.18 0.12
Berries mass (g) 0.058 -0.13 -0.45 -0.36
TSS (°Brix) 0.096 0.06 0.49
Total Acidity (g L–1) 0.071 -0.03 -0.11 -0.25
pH -0.045 0.09 0.22 0.04
Anthocyanins (mg
1000 g–1) 0.134 -0.31 0.49
1Interpretation: High: r = 0.5 to 1.0 or r = -0.5 to -1.0; Weak: r = 0.1 to 0.5 or
r = -0.1 to -0.5; no correlation: r = -0.1 < 0 < 0.1. Coefficient of Determination = r2.
Table 6 – Soluble solids, titratable acidity, and pH of must from grapevine ‘Bordô’ clones in three harvest seasons (2011, 2012 and 2013) in Caldas, MG, Brazil.
Clones Total soluble solids Total acidity pH °Brix g tartaric acid L–1
CL 31 15.9 cd 4.7 b 3.32 abc
CL 6 15.6 d 5.0 ab 3.27 c
CL 7 16.5 b 5.2 ab 3.34 a
CL 8 17.0 a 5.5 a 3.33 ab
CL 10 16.0 bcd 5.3 ab 3.29 bc
CL 12 16.0 bcd 5.3 ab 3.30 abc
CL 13 16.1 bc 5.0 ab 3.30 abc
CL 15 16.1 bc 5.1 ab 3.28 bc
CL 16 16.0 bcd 5.0 ab 3.29 bc
CL 17 16.5 b 5.3 ab 3.31 abc
CL 18 16.0 bcd 5.0 ab 3.32 abc
CL 19 15.9 cd 5.5 ab 3.28 c
20112 15.9 c 6.0 a 3.37 a
2012 16.4 a 5.1 b 3.35 b
2013 16.1 b 4.4 c 3.18 c
CV (%) 2.4 11.3 1.17
1Data within each column represent the means of the three harvest
seasons per clone. Means followed by same letters within columns from clone 3 to clone 19 are not different (Tukey test, p > 0.05); 2Data
within each column represent the means of all clones per season. Means followed by same letters within columns among seasons are not different (Tukey test, p > 0.05).
Table 7 – Total anthocyanin content and total phenolic compounds from skins of ‘Bordô’ grape clones in the 2012 harvest season in Caldas, MG1, Brazil.
Clones
Total anthocyanins (as mg malvidin-3-glucoside
1000 g–1 berry)
Total phenolic compounds (mg gallic acid 1000 g–1
berry)
CL 3 1133.13 b 1698.05 b
CL 6 1657.28 a 2181.38 a
CL 7 1222.85 ab 1749.75 ab
CL 8 1413.63 ab 2115.10 ab
CL 10 1369.52 ab 1784.86 ab
CL 12 1317.42 ab 1900.05 ab
CL 13 1478.49 ab 1903.11 ab
CL 15 1335.49 ab 1900.73 ab
CL 16 1209.72 ab 1715.97 ab
CL 17 1568.65 ab 1958.69 ab
CL 18 1332.83 ab 1862.86 ab
CL 19 1201.40 ab 1608.75 b
CV (%) 11 12
1Means followed by same letters within columns are not different (Tukey test, p > 0.05).
Conclusions
Genetic variability played a major role in pro-ductivity. Yield increases resulted in no impairment of berry quality. The use of clone 13, selected in this trial, may contribute to increasing the productivity of ‘Bordô’ vineyards, with good berry quality and simi-lar production costs of vineyards implanted with non-selected scions.
Acknowledgements
The authors are grateful to the Minas Gerais State Foundation for Research Support (FAPEMIG) and to the Brazilian National Council for Scientific and Techno-logical Development (CNPq) for financial support.
References
Anderson, M.M.; Smith, R.J.; Williams, M.A.; Wolpert, J.A. 2008. Viticultural evaluation of French and Californian Pinot Noir clones grown for production of sparkling wine. American Journal of Enology and Viticulture 59: 181-193.
Bates, T.R.; Dunst, R.M.; Joy, P. 2002. Seasonal dry matter, starch, and nutrient distribution in ‘Concord’ grapevine roots. HortScience 37: 313-316.
Botelho, R.V.; Pavanello, A.P.; Pires, E.J.P.; Terra, M.M.; Müller, M.M.L. 2011. Organic production of red wine grapes under plastic cover in subtropical region of Brazil. Ciência e Agrotecnologia 35: 1186-1195.
Burin, V.M.; Silva, A.L.; Malinovski, L.I.; Rosier, J.P.; Falcão, L.D.; Bordignon-Luiz, M.T. 2011. Characterization and multivariate classification of grapes and wines of two Cabernet Sauvignon clones. Pesquisa Agropecuária Brasileira 46: 474-481.
Dry, P.R.; Longbottom, M.L.; McLoughlin, S.; Johnson, T.E.; Collins, C. 2010. Classification of reproductive performance of ten winegrape varieties. Australian Journal of Grape and Wine Research 16: 47-55.
Ebadi, A.; Coombe, B.G.; May, P. 1995. Fruit-set on small Chardonnay and Shiraz vines grown under varying temperature regimes between budburst and flowering. Australian Journal of Grape and Wine Research1: 3-10. Ebadi, A.; Coombe, B.G.; May, P. 1996. Effect of short-term
temperature and shading on fruit-set, seed and berry development in model vines of Vitis vinifera, cvs Chardonnay and Shiraz.Australian Journal of Grape and Wine Research 2: 2-9.
Embrapa Uva E Vinho. 2013. Methodology of the geoviticulture MCC system. Available at: http://www.cnpuv.embrapa.br/ tecnologias/ccm/met.en.html [Accessed Feb 21, 2014] Falcão, L.D.; Chaves, E.S.; Burin, V.M.; Falcão, A.P.; Gris, E.F.;
Bonin, V.; Bordignon-Luiz, M.T. 2008. Maturity of Cabernet Sauvignon berries from grapevines grown with two different training systems in a new growing region in Brazil. Ciencia e Investigación Agraria 35: 271-282.
Giusti, M.M.; Wrosltad, R.E. 2000. Characterization and Measurement of Anthocyanins by uv-Visible Spectroscopy. John Willey, New York, NY, USA. (Current Protocols in Food Analytical Chemistry).
Jackson, D.I. 1991. Environmental and hormonal effects on development of early bunch stem necrosis. American Journal of Enology and Viticulture 42: 290-294.
Leão, P.C.S.; Cruz, C.D.; Motoike, S.Y. 2010. Genetic diversity of a Brazilian wine grape germplasm collection based on morphoagronomic traits. Revista Brasileira de Fruticultura 32: 1164-1172.
Lebon, G.; Wojnarowiez, G.; Holzapfel, B.; Fontaine, F.; Vaillant-Gaveau, N.; Clément, C. 2008. Sugars and flowering in the grapevine (Vitis vinifera L.). Journal of Experimental Botany 59: 2565-2578.
Maia, A.J.; Schwan-Estrada, K.R.F.; Botelho, R.V.; Jardinetti, V.A.; Faria, C.M.D.R.; Batista, A.F.; Costa, W.F. 2013. Bud break and enzymatic activity in buds of grapevine cv. Ives treated with
Gallesia integrifolia hydrolate. Acta Physiologiae Plantarum 35: 2727-2735.
Norberto, P.M.; Regina, M.A.; Chalfun, N.N.J.; Soares, A.M.; Fernandes, V.B. 2008. Influence of the training system in the yield and in the quality of vine fruits 'Folha de Figo' and 'Niágara Rosada' in Caldas, MG. Ciência e Agrotecnologia 32: 450-455 (in Portuguese, with abstract in English).
Orlando, T.G.S.; Regina, M.A.; Soares, A.M.; Chalfun, N.N.J.; Souza, C.M.; Freitas, G.F.; Toyota, M. 2003. Agronomic characterization of grapevines cultivars (Vitis labrusca L.) in different training systems. Ciência e Agrotecnologia 27: 1460-1469 (in Portuguese, with abstract in English).
Santos, A.O.; Hernandes, J.L.; Pedro Junior, M.J.; Rolim, G.S. 2011. Plant parameters and microclimatic conditions for wine grapes cultivated under sequential double pruning. Revista Brasileira de Engenharia Agrícola e Ambiental 15: 1251-1256 (in Portuguese, with abstract in English).
Smart, R.; Robinson, M. 1991. Sun Light into Wine: A Handbook for Winegrape Canopy Management. Winetitles, Adelaide, Australia.
Tonietto, J.; Vianello, R.L.; Regina, M.A. 2006. Macroclimatic characterization and enological potential of different regions with viticultural inclination in Minas Gerais = Caracterização macroclimática e potencial enológico de diferentes regiões com vocação vitícola em Minas Gerais. Informe Agropecuário 27: 32-55 (in Portuguese).
Torregrosa, L.; Fernandez, L.; Bouquet, A.; Boursiquot, J-M; Pelsy, F.; Martinez-Zapater, J-M. 2011. Origins and consequences of somatic variation in grapevine. p. 68-92. In: Kole, C., ed. Genomics of fruits and vegetables crops. Science Publishers, Enfield, NH, USA.
Villa, F.; Regina, M.A.; Alvarenga, A.A.; Pasqual, M.; Stopa, R.A. 2010. Clonal prospection and viruses occurrence in the grapevine cv. ‘Folha de Figo’ at Caldas, MG, Brazil. Scientia Agraria 11: 155-161 (in Portuguese, with abstract in English). Yang, J.; Martinson, T.E.; Liu, R.H. 2009. Phytochemical profiles