Samila Sather Tavares BatistoniI
Anita Liberalesso NeriI
Ana Paula F Bretas CupertinoII
I Universidade Estadual de Campinas. Campinas, SP, Brasil
II University of Kansas Medical Center. Kansas City, KS, United States
Correspondence:
Samila Sather Tavares Batistoni Departamento de Psicologia Educacional Av. Bertrand Russel, 801
Cidade Universitária Zeferino Vaz – Barão Geraldo
13083-970 Campinas, SP, Brasil E-mail: [email protected] Received: 5/30/2006 Reviewed: 11/23/2006 Approved: 4/122007
Validity of the Center for
Epidemiological Studies
Depression Scale among
Brazilian elderly
ABSTRACT
OBJECTIVE: To obtain internal construct and criteria validity for the Center
of Epidemiological Studies – Depression scale in elderly people.
METHODS: The instrument was applied to 903 elderly living in a city in
southeastern Brazil, between 2002 and 2003. Results were compared with the Brazilian version of the CES-D applied to a sub-sample of 446 participants. Internal consistency of the two scales was assessed using Cronbach’s alpha measured for the items in their total and for the items of each factor obtained for the assessed instrument. To assess the construct validity, the 20 items underwent exploratory factorial analysis to discover their variation pattern and the variance explained according to each factor.
RESULTS: The scale presented satisfactory index for internal validity
(α=0.860), sensibility (74.6%), specifi city (73.6%), and for cutoff point >11. However, it presented a relatively high frequency of false positives compared to the GDS 33.8% vs. 15%. Exploratory factorial analysis of the instrument created factorial structure with three factors: negative affects, problems initiating behaviors, and positive affects.
CONCLUSIONS: The instrument seemed to be psychometrically suitable
when applied to older people. However, further cross-sectional and longitudinal studies, carried out in different contexts, may explain the effects of somatic and situational variables on the results of the instrument in older people.
KEYWORDS: Older people. Depression, diagnosis. Depression, psychology. Validation studies.
INTRODUCTION
Geriatric Depression Scale – GDS23 and the Center for Epidemiological Studies – Depression Scale (CES-D)12,16 are screening instruments acknowledged as fast, simple and useful resources to identify depressive symptoms or old age vulnerability to depression.5 In Brazil, GDS is well known and used by resear-chers and general practitioners. CES-D has been used recently in young21 and adult6 population. Among elderly people, their psychometric properties have not been explored yet.
factor connected with well being, in the factor structure described by Radloff16 (1977), appears as consistently problematic in non-western cultures. Two factors, rather than four, were the best adjustment obtained for Hispanic elderly, interpersonal problems were more prominent in African American elderly, as well as depressive affects and somatic factors for Native Americans. According to these same authors14 Gupta & Yick10 (2000) and Ridler et al18 (2002), CES-D must be validated for each cultural group it is used.
The present study aimed at obtaining internal construct and criteria validity for the Center for Epidemiological Studies – Depression Scale in elderly, and to explore psychometric aspects of CES-D when applied to Bra-zilian elderly living in the community.
METHODS
According to data from the Instituto Brasileiro de Geografi a e Estatística (IBGE – Brazilian Institute of Geography and Statistics), in 2000, Juiz de Fora (Southe-astern Brazil) had 456,796 inhabitants, 10.6% were 60 or over, and the life expectancy was 71.78 years old.
Data from the research was raised in the fi rst phase of the collection of the study “Estudos dos Processos do Envelhecimento Saudável” (PENSA – Studies of the Processes of Healthy Ageing), developed in Juiz de Fora, between 2002 and 2003. The sample was syste-matically searched in the 14 districts of the town with greatest percentage of seniors. All houses in these dis-tricts (N=7,089) were visited, and 1,686 elderly dwel-lers were identifi ed (mean 0.24 elderly per house), who were invited to take part in the survey. Among them, 956 (56%) accepted to take part in the research, 614 (36%) refused and 116 did not take part in the interview because they were physically or cognitively disable. Among participants, 71.8% were women. Age ranged from 60 to 103 years old (mean 72.4; SD=8.3). Half of the elderly were married (N=478), 38 were single, and the remaining were widows/widowers (N=440), separated or divorced. Sixty fi ve per cent were illiterate or had completed elementary school, 38% had fi nished high school, and 10% had fi nished university.
Among the 956 people who accepted taking part in the study, 903 answered CES-D completely. Forty per cent were between 60 and 69, 40% between 70 and 79, and 20%, 80 or over (mean=72.3; SD=8.21); 72.4% were women. Among the 903 elderly, 446 also answered the GDS. There were no signifi cant statistical differences between this sub-sample that answered CES-D and GDS and that who answered only CES-D.
The following instruments were applied:
1. Questionnaire on: gender, age, education and ma-rital status.
2. CES-D, in the semantically validated version done by Silveira & Jorge21 (2000), to assess the frequency of depressive symptoms experienced in the week prior to the interview. It has 20 scale items on mood, somatic symptoms, interaction with others, and motor functions. Answers are in Likert’s scale (never or rarely, sometimes, frequently, always). Final score ranged from zero to 60 points. In the North American version16 cutoff point for identi-fying depression is ≥16 points.
3. Brazilian version of the GDS-15.20 It is a dicho-tomous scale, in which participants are invited to check the presence or absence (yeas vs. no) of symptoms referring to changes in mood and to specifi c feeling such as despair, feeling of worth-lessness, loss of interest, happiness, and irritability. Studies where the Brazilian version of GDS were used showed that their measures are valid for the diagnoses of major depressive episode, according to the criteria of Diagnostic and Statistical Manual of Mental Disorders, fourth edition (DSM-IV) and the International Classifi cation of Diseases, 10th review. The >5 cutoff point produced 90.9% sensitivity, and 64.5% specifi city rates for diagnosing major depressive episode according to DSM-IV.2
Internal consistency of both scales in the sample was assessed using Cronbach alpha measure (α), calcula-ted for the items in their totality and for the items of each factor obtained for CES-D. To obtain the cutoff point for CES-D, a predictor of the depressive state in the Brazilian sample, we used the assessment of Receiver Operating Characteristic curve (ROC). ROC curve maximized the sensitivity and specifi city values of CES-D, comparing them with those values obtained by individuals classifi ed as depressed or not depressed according to GDS, which was considered the reference scale. To assess construct validity, its 20 items underwent exploratory factor analysis to learn the patterns of variation of the items and the variation explained by each factor. Orthogonal rotation using Varimax method was performed so as the resulting factors were as independent as possible.
The research was approved by the Ethical Committee of Research in Human Beings of the University Hospital in the Universidade Federal de Juiz de Fora (Process # 170-009/2002). All participants gave their written consent.
RESULTS
friends”) and in GDS-15 number 9 and 15 (“Do you prefer staying home than doing new activities?” “Do you think there are many people better off than you?”),
however, withdrawing them did not change the internal consistency rates substantially.
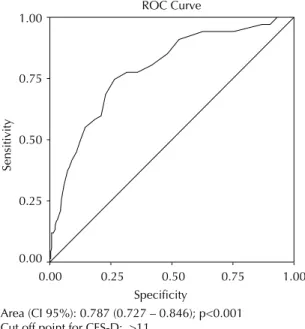
In the Figure are presented the outcomes of the analy-sis of the ROC curve for the total score of CES-D in comparison to GDS values. The analysis presents the correlation between the sensibility and specifi city for each cut-off point. The better the measure in study to di-fferentiate the possibly affected group and the possibly non-affected group, the closer the curve will get to the top left hand corner (as an inverted “L”) and the closer the curve will get to 1.0 (Fletcher et al,7 1991).
For CES-D, a score higher than 11 was what best discriminated between cases and non-cases, since it showed the ability to balance the results of sensitivity and specifi city. Sensitivity of CES-D, that is, its ability to provide a positive indicator of depressive sympto-matology between those considered depressed by GDS was 74.6%. Ability of CES-D to discriminate those free from depression to those who had been considered de-pressed by GDS (specifi city) was 73.6%. Percentage of participants correctly classifi ed (accuracy) was 73.8%. These outcomes indicate that the score >11 for CES-D is the one which best separates the items of the scale according to the criteria of co-variation with those of GDS, whose cutoff score previously established as reference was >5. According to this new parameter
Area (CI 95%): 0.787 (0.727 – 0.846); p<0.001 Cut off point for CES-D: >11
Figure. Sensitivity and specificity coefficient for CES-D
compared to GDS-15. Juiz de Fora, Southeastern Brazil, 2002-2003.
ROC Curve
Specificity
1.00 0.75
0.50 0.25
0.00
Sensitivity
1.00
0.75
0.50
0.25
0.00
Table 1. Factor loading matrix of the items in Center for Epidemiological Studies – Depression Scale (CES-D) obtained by the
assessment of main components after orthogonal rotation using Varimax method. Juiz de Fora, Southeastern Brazil, 2002-2003. N=903
Item Factor 1 Factor 2 Factor 3 Factor 4
1 0.08570 0.60381 0.03429 0.17406
2 0.08294 0.61201 0.11154 0.01812
3 0.46795 0.55929 0.06289 0.10289
4 0.06166 0.00875 0.61635 -0.26105
5 0.30769 0.55743 0.05856 -0.05144
6 0.72603 0.30664 0.11323 0.08899
7 0.27658 0.61290 0.05118 0.16274
8 0.17983 0.04234 0.71899 0.02941
9 0.59050 0.00267 0.11471 0.19422
10 0.43841 0.23607 0.06863 0.13458
11 0.12950 0.41832 0.13441 0.50661
12 0.18207 0.19156 0.59982 0.43690
13 0.39232 0.37238 0.06754 0.03417
14 0.55218 0.22041 0.23250 -0.03383
15 0.15854 0.07946 -0.03061 0.76137
16 0.09637 0.19324 0.64491 0.43894
17 0.59072 0.13953 0.15773 -0.06115
18 0.70799 0.28386 0.15032 0.14882
19 0.59693 -0.01866 -0.04774 0.42948
they separate emotions that are usually understood as dysphoric (items of Factor 1) of their opposite (those of Factor 3), which are the identity trace of depression considered as mood disorder. We can see in Table 1 that items 13 to 20, although they are more similar in the set of questions referring to somatic complaints, were grouped in the fi rst factor. However, they are not substantial and factor one remains being interpreted as “negative affects” as a latent variable, since the fi rst six items (those with greater weight in the factor) concern dysphoric mood. In turn, Factor 2 refers to another important characteristic of depression, that is, the relative change in behaviors which has impact on the practical life and on social relations. Thus, Factor 2 was named “problems initiating behaviors” instead of somatic symptoms as in the original analysis. Factor 4 has only two items and accounts for small variability of the data and presents one item that corresponds to Factor 1 and another to Factor 2, these are the reasons why it has not been interpreted, because together they are not coherent with the preceding analysis. Radloff16 (cutoff point >11 in CES-D) for the total sample (903),
prevalence was 33.8%, a rate that was twice as great as the prevalence estimated by GDS (15%) in the sub sample of 446 elderly people.
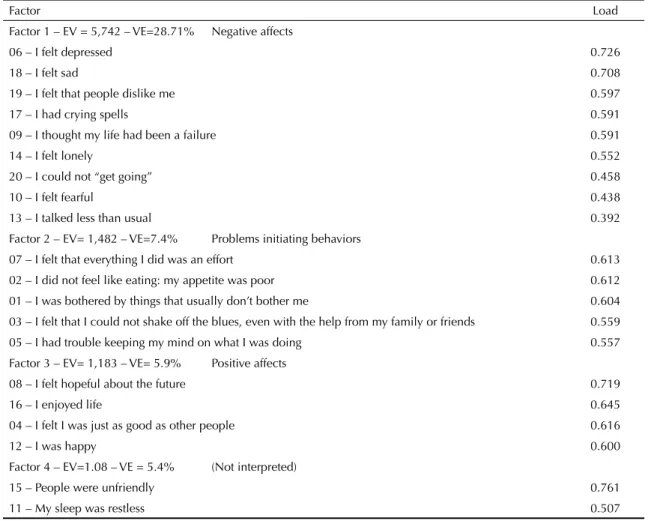
Measure of sampling adequacy (MSA), or Kaiser-Meyer-Olkin Measure (KMO) was 0.9115, indicating high consistency to be used in the factor analysis. Main components method was used for extracting factors. Orthogonal rotation of the items was performed using Varimax method for the total sample of elderly who answered CES-D (Table 1). By the criteria of selecting factors with self value greater than 1, four factors were obtained, which explain 47.5% of the variability of the total data (Johnson & Wichern, 1988 and Pereira, 1998). Table 2 presents resulting factors and the name they received based on the assumption that they were variables latent to construct of depression assessed by CES-D in the sample studied.
Factors derived from the behavior of the scale in the Brazilian sample are empirically interesting because
Table 2. Factor structure of Center for Epidemiological Studies Scale – Depression (CES-D) resulting from the analysis of the
main components of the reduced matrix. Juiz de Fora, Southeastern Brazil, 2002-2003. N=903
Factor Load
Factor 1 – EV = 5,742 – VE=28.71% Negative affects
06 – I felt depressed 0.726
18 – I felt sad 0.708
19 – I felt that people dislike me 0.597
17 – I had crying spells 0.591
09 – I thought my life had been a failure 0.591
14 – I felt lonely 0.552
20 – I could not “get going” 0.458
10 – I felt fearful 0.438
13 – I talked less than usual 0.392
Factor 2 – EV= 1,482 – VE=7.4% Problems initiating behaviors
07 – I felt that everything I did was an effort 0.613
02 – I did not feel like eating: my appetite was poor 0.612
01 – I was bothered by things that usually don’t bother me 0.604
03 – I felt that I could not shake off the blues, even with the help from my family or friends 0.559
05 – I had trouble keeping my mind on what I was doing 0.557
Factor 3 – EV= 1,183 – VE= 5.9% Positive affects
08 – I felt hopeful about the future 0.719
16 – I enjoyed life 0.645
04 – I felt I was just as good as other people 0.616
12 – I was happy 0.600
Factor 4 – EV=1.08 – VE = 5.4% (Not interpreted)
15 – People were unfriendly 0.761
11 – My sleep was restless 0.507
(1977) named the fourth factor of his original analysis as “interpersonal problems”, even though it was the factor with lighter weight formed only by two items.
The three factors that resulted in a factor analysis underwent internal consistency analysis. Resulting Cronbach’s alpha index were 0.80 for Factor 1, 0.68 for factor 2 and 0.63 for factor 3, indicating high in-ternal consistency for the fi rst factor and intermediate consistency for the second and third.
DISCUSSION
As a symptom scale, CES-D will not work for diffe-rentiating groups with different diagnoses, as recom-mended by DSM-IV, however, its use in this study showed satisfactory reliability and validity. CES-D is not a diagnostic instrument in the strict sense, however, it works as an indicator of the possible presence of de-pression, that must be assessed by clinical, biochemical and psychosocial criteria, so that a safer statement can be made on its presence or absence.4,8,19
When assessing internal validity of CES-D, we have observed that the items of CES-D presented high inter-nal consistency (a=0.860) indicating a scale with uni-dimensional behavior in the sample of elderly. Silveira & Jorge21 (2000) obtained a rates=0.848 with young people. That means the items in the scale refer to the same type of disorder, occurring both in young and old people, and, in parallel, it confi rms the suitability of the language used in CES-D for the Brazilian Portuguese. The result that indicates unidimensionality of CES-D in this sample was also found by Graysonet al9 (2000).
Regarding validity criteria, after the assessment of the ROC curve, CES-D (>11) was sensible, specifi c and accurate, however, it presented low positive predictive value (ability to identify true positive values among those over 11), regarding the negative predictive value (ability to identify true negative values among those below 11). This outcome may be explained by the difference in content among the two scales: CES-D included somatic symptoms and GDS did not. Somatic symptoms present high probability of occurring in elderly patients, because many of them present somatic diseases associated with ageing.3 As CES-D allows elderly to record these symptoms and GDS does not, maybe this explains the difference in prevalence identifi ed for each of the scales (GDS=15% and CES-D=33.8%). Thus, compared to GDS, CES-D overestimated the percentage of old people possibly affected by depression in the sample studied. Grayson et al9 (2000) reached a comparable conclusion in a me-thodological study to quantify the effect of bias created by the presence of somatic symptoms on the diagnoses of depression in 75 year-old-community-dwelling indi-viduals. According to these authors, being older, being
a woman and being a widow/er present signifi cant and independent effects on the total score of depression assessed by CES-D, not because of these conditions, but because of the disabling diseases associated with them. Thus, answers to these items involving effort, sleep, and energy are affected by the presence of so-matic diseases, affecting the total score of depression assessed by CES-D. In turn, the affective items, such as those involving sadness, failure, and satisfaction for example, are less sensible to the presence of diseases effects. However, researchers suggest that assessing how much the score of each age group or of different health conditions may be affected by the somatic and affective items should not be intuitively conducted but rather, it should be carried out with the use of statistical techniques such as that of differential item functioning in the perspective of the Item response theory.
Although GDS has been adopted as the reference scale for assessing the validity of CES-D among Bra-zilian elderly, precisely because it has been validated and used in Brazil, it is important to be aware of its limitations. Just as it is said that CES-D applied to all elderly presents infl ated score because of the presence of somatic items in the scale, it is also believed that part of the items of GDS concern adaptive changes of ageing and not to depression in itself.1 These indications are enough to indicate criterions use of these scales in population studies and, on the other hand, suggest the conduction of cross-sectional studies and longitudinal studies comparing different population of elderly and non-elderly with and without somatic diseases.
Even with the impairment CES-D has separating the effects of somatic items, as highlighted by Grayson et al9 (2000) and Reifl er17 (1994), among others, these items must be taken into account, because they can indicate dysphoric mood, which cannot often be na-med or recognized by the elderly. Somatic items give important clues to identify depression indicators that should be further investigated in more detailed studies. Emphasizing this point of view, Jenkins et al13 (1991) suggested that somatization, in depression, would be a universal phenomena. They used as a basis for this suggestion data from the use of CES-D in adults, studies where the somatic and dysphoric items were merged in the same explanatory factor of the scale. This sug-gestion demands for clinical investigations as well as more detailed surveys.
CES-D is a widely used instrument in geriatric research worldwide, and when compared to clinical criteria, and self report and construct validity criteria, it presents satisfactory internal consistency, test-retest reliability, and concurrent validity.9 Validating it using Brazi-lian samples broadens the psychometric knowledge, enables performing comparisons of population data between countries as well as performing cross-cultural studies.
It is important to perform comparative studies between depression scales built under different logics. Data on
the prevalence of depression are often confl icting be-cause they were collected with different instruments, or the type of research performed or the context in which they are conducted. Review of researches using CES-D, other inventories and diagnostic classifi cations have led to different conclusions. For example, there are data of longitudinal research reporting that depression incre-ases, decreases or remain stable over the different age group.5 Data from cross-sectional research demonstrate that depression is more prevalent in populations betwe-en 60-70 and betwebetwe-en 80 or over, and less prevalbetwe-ent among those from 70 to 80 and among middle-aged adults, and that it is more prevalent among those 80 or over, especially those more severely ill, those less independent, those poorer, more lonely, and those with less support, and women and widowers.5,9,11,15,22
1. Adams KB. Depressive symptoms, depletion, or developmental change? Withdrawal, apathy, and lack of vigor in the Geriatric Depression Scale.
Gerontologist. 2001;41(6):768-77.
2. Almeida OP, Almeida SA. Short versions of the Geriatric Depression Scale: A study of their validity for the diagnosis of major depressive episode according
to ICD-10 and DSM-IV. Int J Geriatr Psychiatry.
1999;14(10):858-65.
3. Carvalho VFC, Fernandez MED. Depressão no Idoso. In: Papaléo Netto M, organizador. Gerontologia. São Paulo: Atheneu; 2002. p.160-73.
4. Davidson H, Feldman PH, Crawford S. Measuring
depressive symptoms in the frail elderly. J Gerontol.
1994;49(4):P159–64.
5. Fisk A, Jones RS. Depression. In: Johnson M, Bengtson VL, Coleman P, Kirkwood T, editores. The Cambridge Handbook of Age and Ageing. Cambridge: Cambridge University Press; 2005.
6. Fleck MPA, Lima AFBS, Louzada S, Schestasky G, Henriques A, Borges VR, et al. Associação entre sintomas depressivos e funcionamento social em
cuidados primários à saúde. Rev Saude Publica.
2002;36(4):431-8.
7. Fletcher RH, Fletcher SW, Wagner EH. Epidemiologia
Clínica. 2. ed. Porto Alegre: Artes Médicas;1991.
8. Gatz M, Kasl-Godley JE, Karel MJ. Aging and mental disorders. In: Birren JE, Schaie KW, editores. Handbook of the Psychology of Aging. San Diego: Academic Press; 1996. p 367-82.
9. Grayson DA, Mackinnon A, Jorm AF, Creasey H, Broe GA. Item bias in the Center for Epidemiological Studies Depression Scale: Effects of physical disorders and
disability in an elderly communitt sample. J Gerontol B
Psychol Sci Soc Sci. 2000;55(5):273-82.
10. Gupta R, Yick A. Validation of CES-D scale for
older Chinese immigrants. J Ment Health Aging.
2001;7(2):257-72.
11. Heok KE. Epidemiologia da depressão no Idoso. In: Forlenza OV, Carameli P. Neuropsiquiatria Geriátrica. Rio de Janeiro: Atheneu; 2000. p. 35-7.
12. Hybels CF, Blazer DG, Pieper CF. Toward a threshold for subthreshold depression: an analysis of correlates of depression by severity of symptoms using data
from an elderly community sample. Gerontologist.
2001;41(3):357-65.
13. Jenkins JH, Kleinman A, Good BJ. Cross-Cultural studies of depression. In: Becker J, Kleinman A. editors. Psychosocial aspects of depression. New Jersey: Lawrence Erlbaum Associates; 1991. p. 67-99.
14. Mui A, Burnett D, Chen L. Cross-cultural assessment of geriatric depression: a review of the CES-D and the
GDS. J Ment Health Aging. 2001;7(1):137–64.
15. Newman JP, Engel RJ, Jensen JE. Age differences in
depressive experiences. J Gerontol. 1991;46(5):P224-35.
16. Radloff LS. The CES-D Scale: a self-report depression
scale for research in the general population. Appl
Psychol Meas. 1977;1:385-401.
17. Reifl er BV Depression: Diagnosis and Comorbidity. In: Schneider LJ, Reynolds III CF, Lebowitz BD, Friedhoff AJ, editores. Diagnosis and treatment of late life depression: Results of the NIH consensus development conference. Washington: American Psychiatric Press; 1994. p 55–9.
18. Riddler A, Blais MR, Hess U. A Multi-Group Investigation of the CES-D’s Measurement Structure Across Adolescents, Young Adults and Middle-Aged Adults. Montreal: Cirano; 2002.(Scientifi c Series).
19. Robison J, Gruman C, Gaztambide S, Blank K. Screening for depression in middle-aged and older
Puerto Rican primary care pacients. J Gerontol A Biol
Sci Med Sci. 2002;57(5): M308-14.
20. Sheikh JI, Yesavage JA. Geriatric depression scale (GDS): recent evidence and development of a shorter
version. Clin Gerontol. 1986;5:165-73.
21. Silveira DX, Jorge MR. Escala de rastreamento populacional para depressão CES-D em populações clínicas e não clínicas de adolescentes e adultos jovens. In: Gorestain C, Andrade LHSG, Zuarde AW, editores. Escalas de avaliação clínica em psiquiatria e farmacologia. São Paulo: Lemos Editorial; 2000.
22. Veras RP, Murphy E. The mental health of older
people in Rio de Janeiro. Int J Geriatr Psychiatry.
1994;9(4):285-95.
23. Yesavage JA, Brink TL, Rose T, Lum O, Huang V, Adey M, Leirer VO. Development and validation of a geriatric depression screening scale: a preliminary
report. J Psychiatr Res. 1983;17(1):37-49.
REFERENCES
Article based on a Master’s dissertation of SST Batistoni, presented to the Faculdade de Educação of the Universidade Estadual de Campinas, in 2004.
SST Batistoni was supported by Coordenação de Aperfeiçoamento de Pessoal de Nível Superior (Capes – Master’s scholarship).